
Houses for sale & to rent in PA23 7JB, Belmont Lane, Dunoon, Dunoon
House Prices in PA23 7JB, Belmont Lane, Dunoon
Properties in PA23 7JB have no sales history available within the last 3 years. PA23 7JB is a postcode in Belmont Lane located in Dunoon, an area in Dunoon, Argyll and Bute, with 3 households².
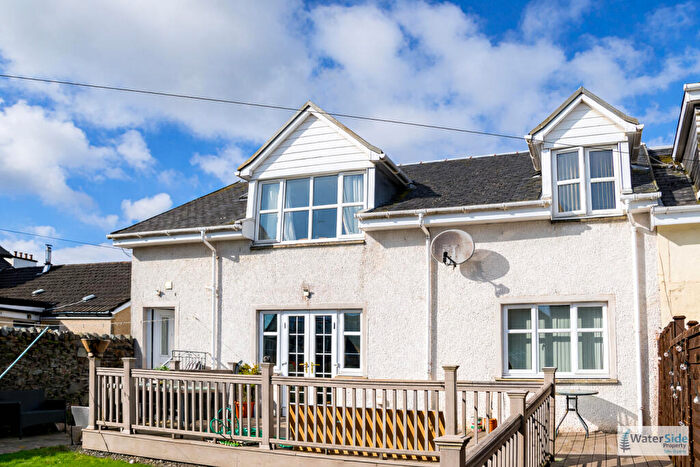
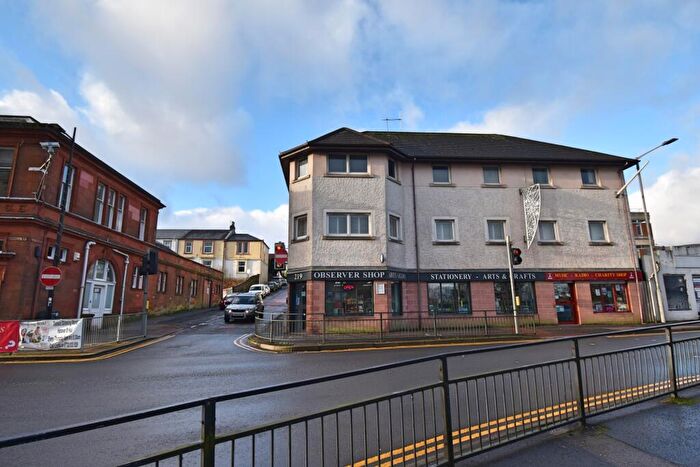
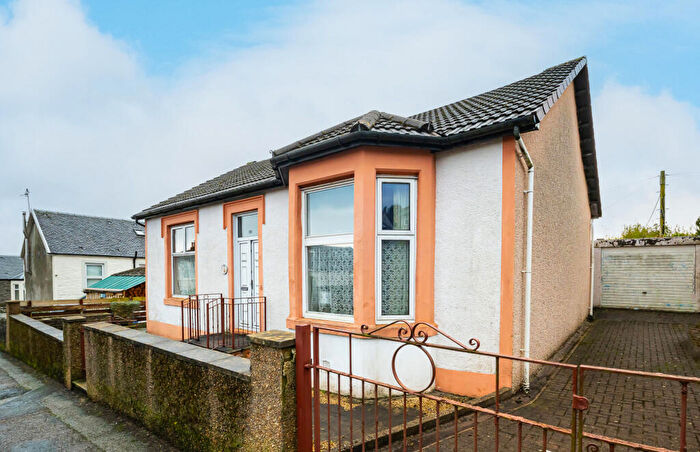
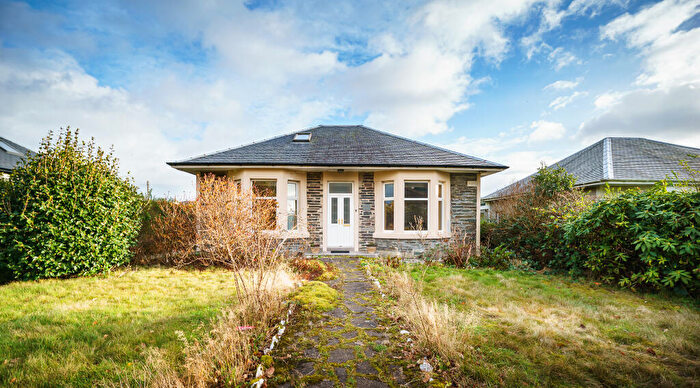
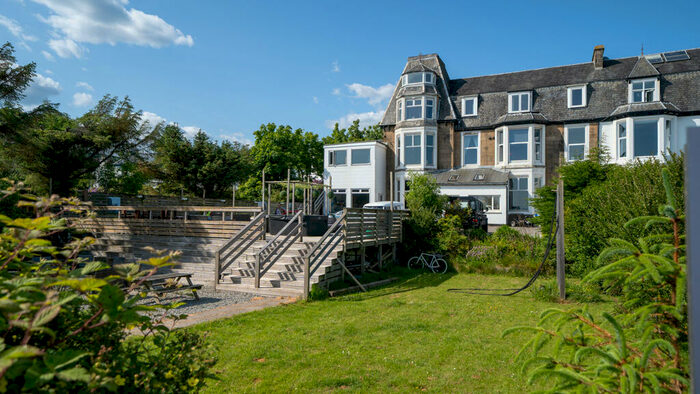
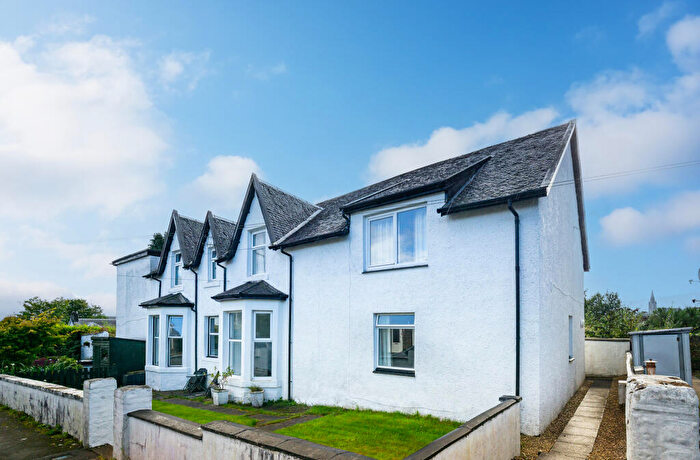
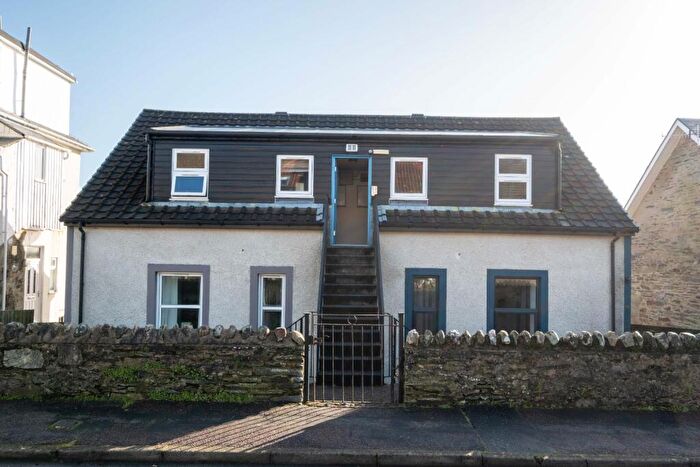
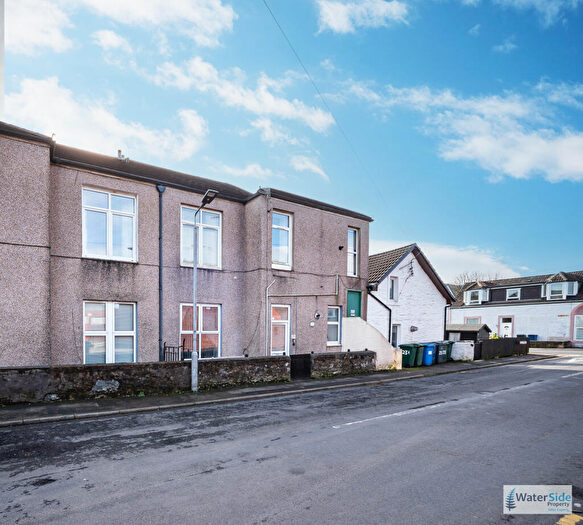
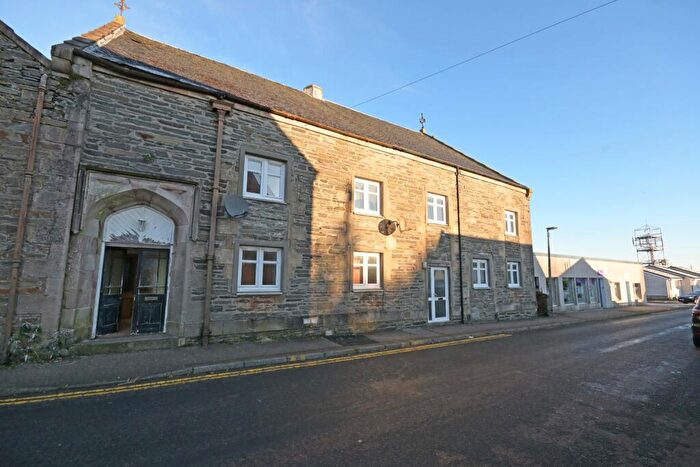
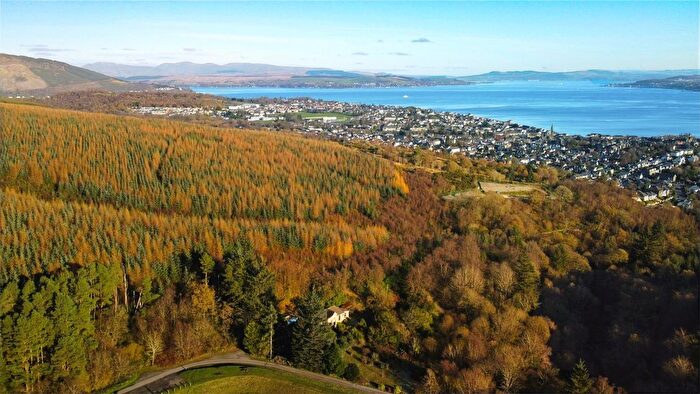
Properties for sale near PA23 7JB, Belmont Lane


![]()
If you are looking to sell your house, let it out, or receive a property valuation, an expert can help you.
Click the button below to get started.

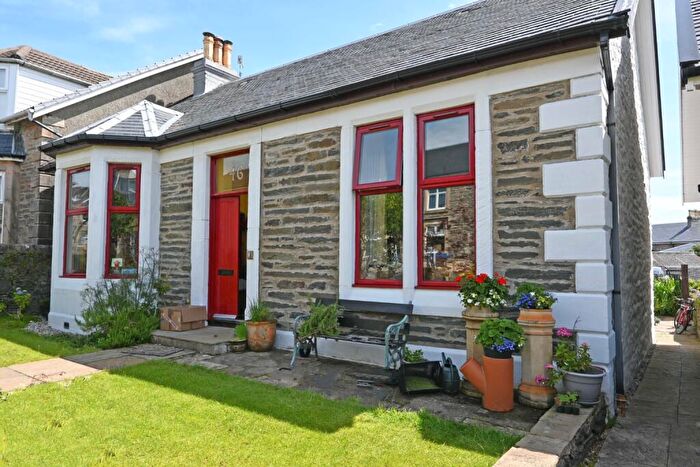
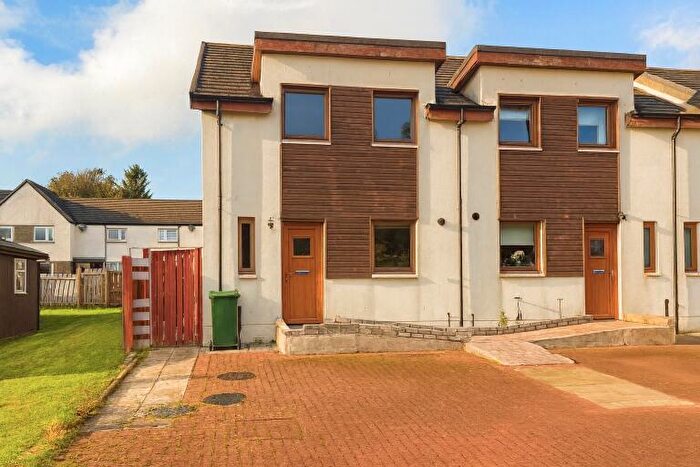
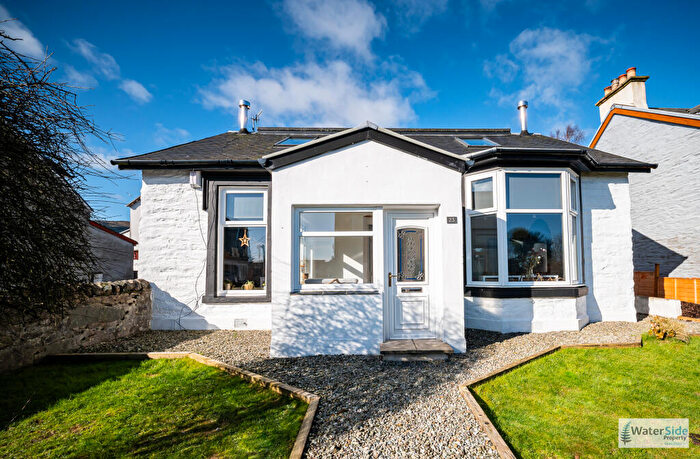
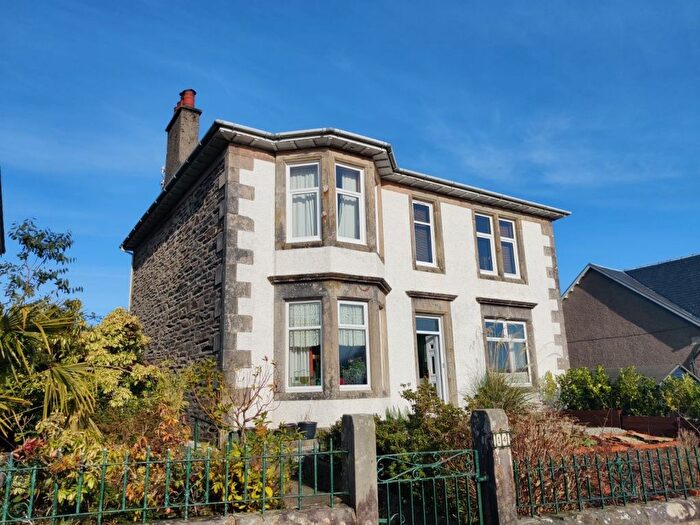
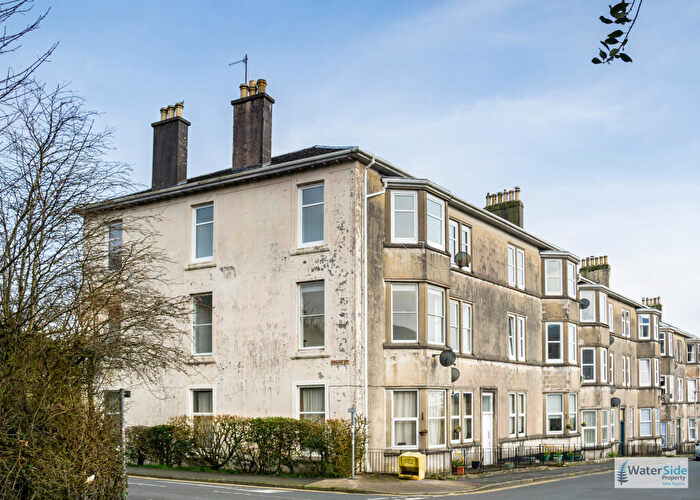
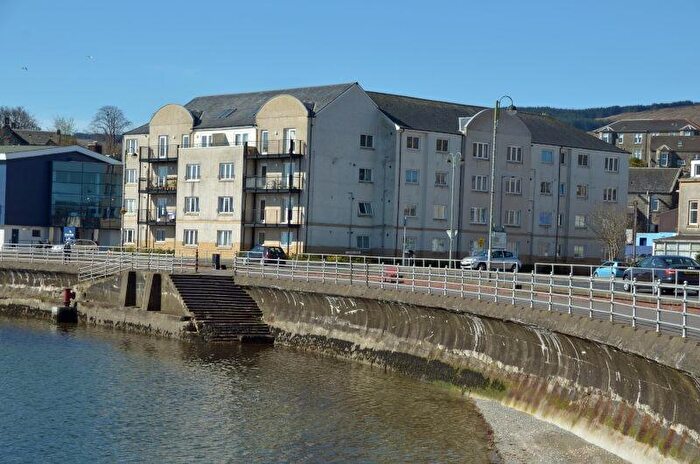
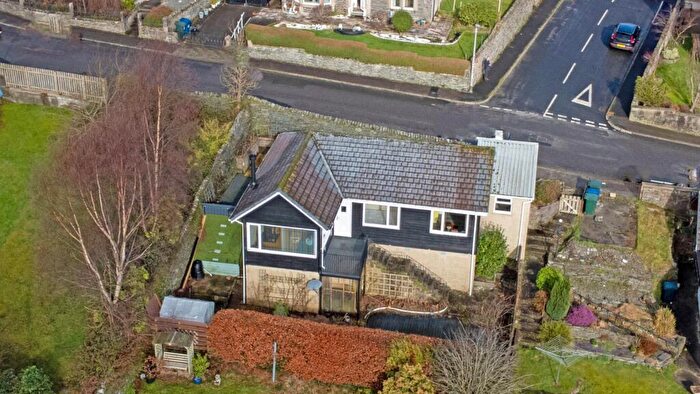
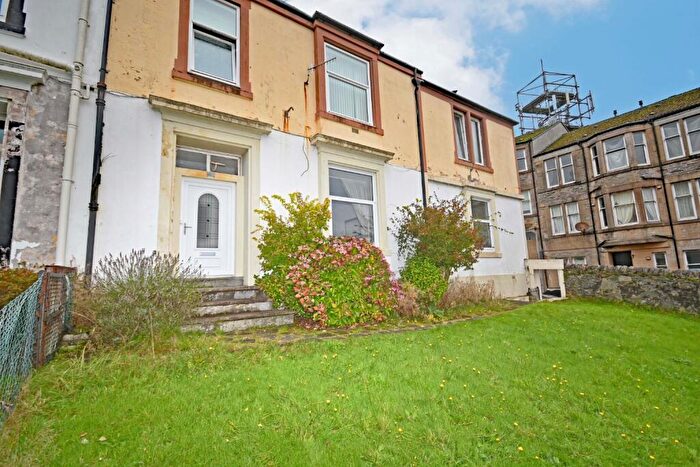
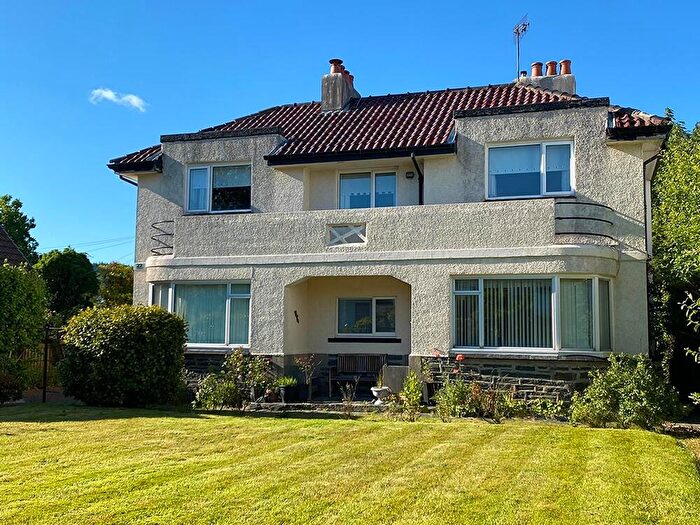
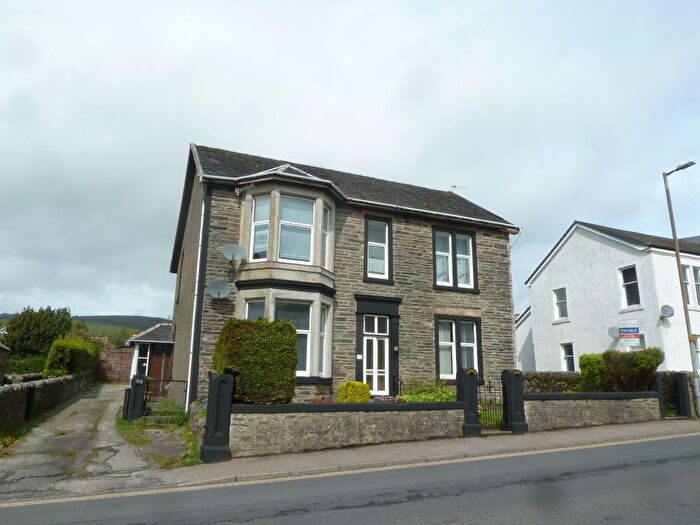
Previously listed properties near PA23 7JB, Belmont Lane
![]()
If you are looking to sell your house, let it out, or receive a property valuation, an expert can help you.
Click the button below to get started.
Price Paid in Belmont Lane, PA23 7JB, Dunoon
1 Belmont Lane, PA23 7JB, Dunoon Dunoon
Property 1 has been sold 3 times. The last time it was sold was in 01/05/2018 and the sold price was £118,000.00.
This is a Property which was sold as an Established Building in 01/05/2018
| Date | Price | Classification |
|---|---|---|
| 01/05/2018 | £118,000.00 | Established Building |
| 31/07/2015 | £185,000.00 | New Build |
| 05/10/2004 | £95,625.00 | Established Building |
1a Belmont Lane, PA23 7JB, Dunoon Dunoon
Property 1a has been sold 1 time. The last time it was sold was in 31/07/2015 and the sold price was £185,000.00.
This is a Property which was sold as an Established Building in 31/07/2015
| Date | Price | Classification |
|---|---|---|
| 31/07/2015 | £185,000.00 | Established Building |
Belmont Lane Dunoon Belmont Lane, PA23 7JB, Dunoon Dunoon
Property Belmont Lane Dunoon has been sold 1 time. The last time it was sold was in 07/05/2012 and the sold price was £204,000.00.
This is a Property which was sold as an Established Building in 07/05/2012
| Date | Price | Classification |
|---|---|---|
| 07/05/2012 | £204,000.00 | Established Building |
Postcodes in Belmont Lane, Dunoon
Navigate through other locations in Belmont Lane, Dunoon, Dunoon to see more property listings for sale or to rent.
Transport near PA23 7JB, Belmont Lane

House price paid reports for PA23 7JB, Belmont Lane
Click on the buttons below to see price paid reports by year or property price:
- Price Paid By Year
Property Price Paid in PA23 7JB, Belmont Lane by Year
The average sold property price by year was:
| Year | Average Sold Price | Price Change |
Sold Properties
|
|---|---|---|---|
| 2018 | £118,000 | -57% |
1 Property |
| 2015 | £185,000 | -10% |
2 Properties |
| 2012 | £204,000 | 53% |
1 Property |
| 2004 | £95,625 | - |
1 Property |