
Houses for sale & to rent in Isle Of Bute, Argyll and Bute
House Prices in Isle Of Bute
Properties in Isle Of Bute have an average house price of £142k and had 129 Property Transactions within the last 3 years.¹
Isle Of Bute is an area in Argyll and Bute with 3,367 households², where the most expensive property was sold for £715k.
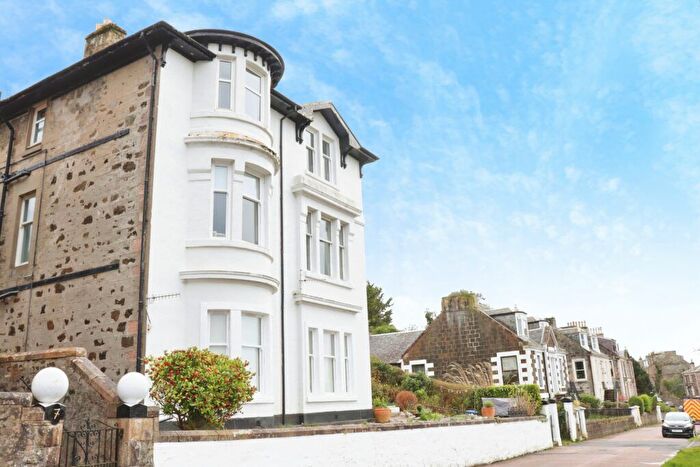
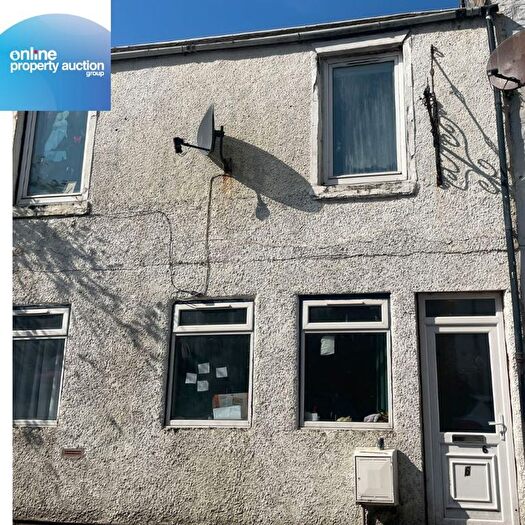
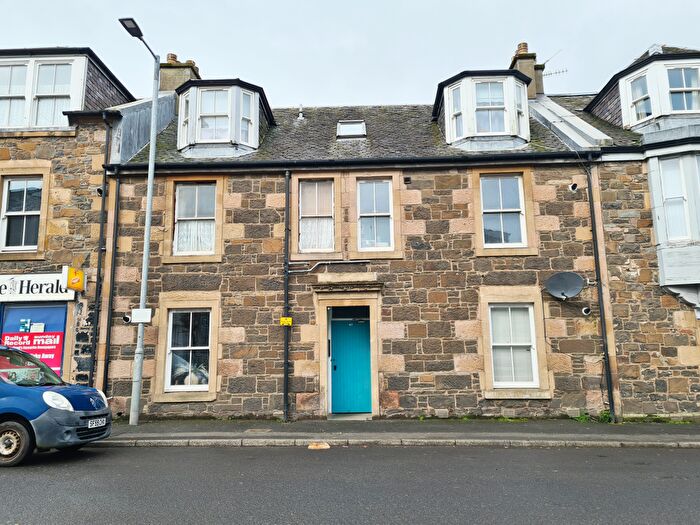
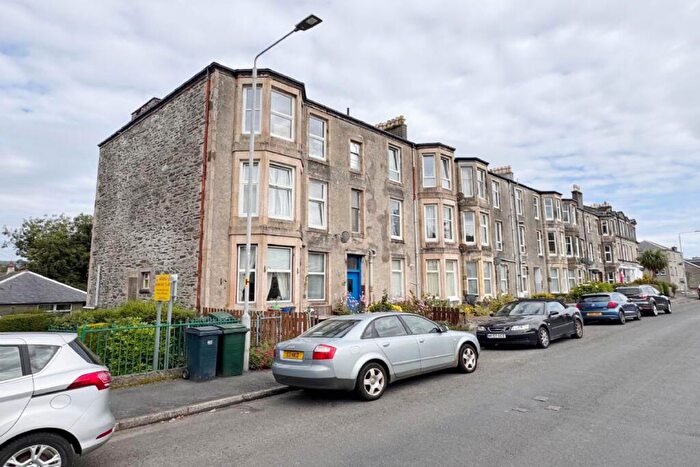
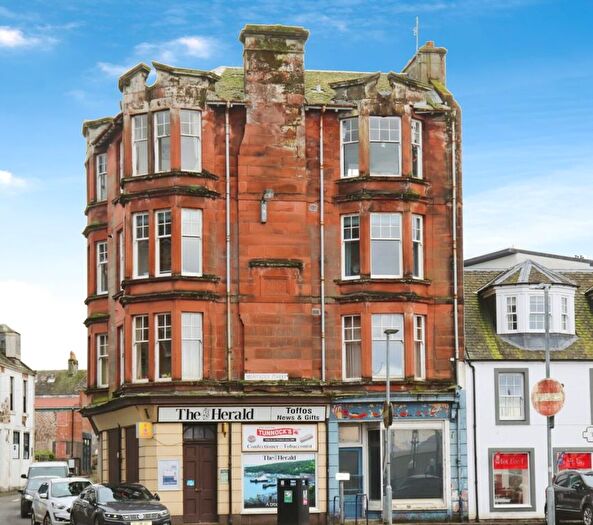
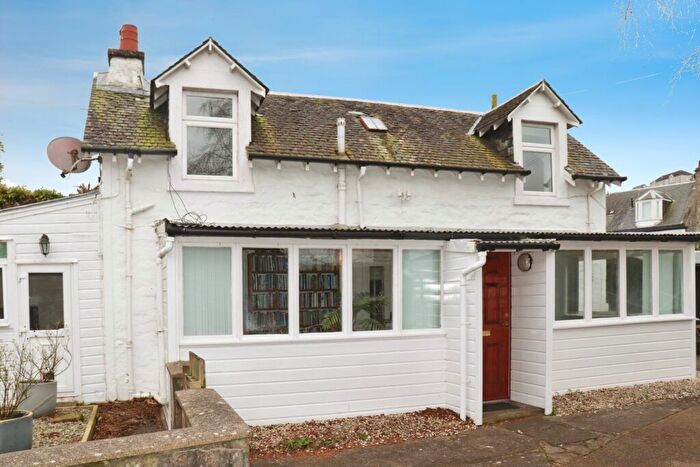
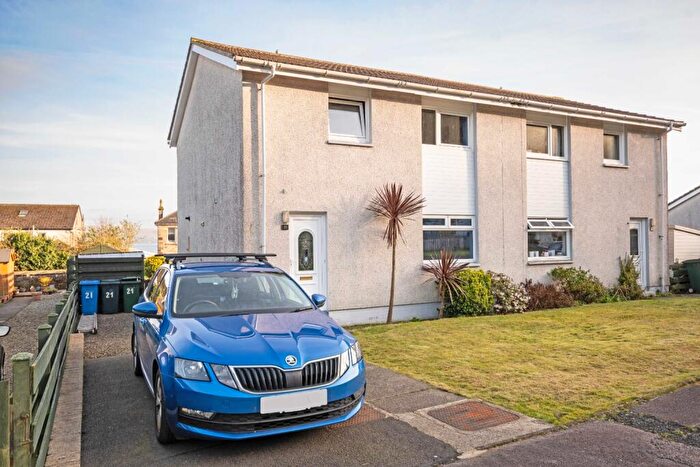
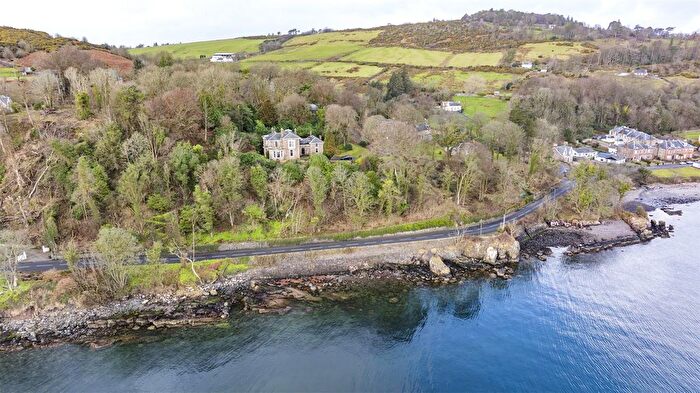
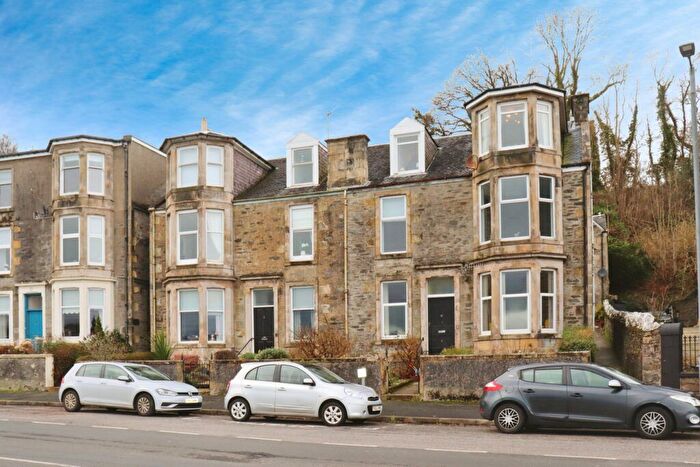
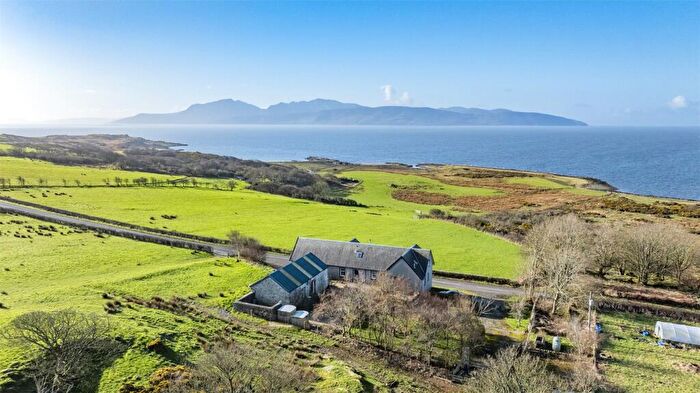
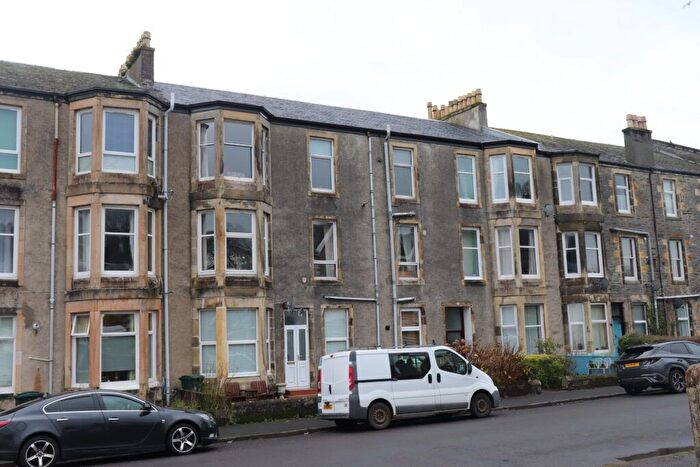
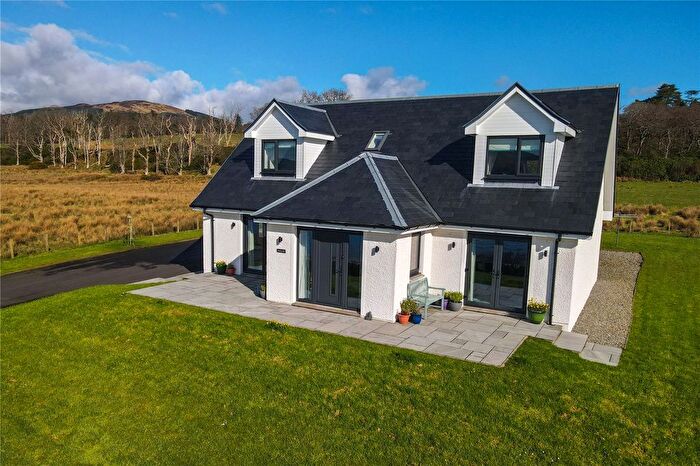
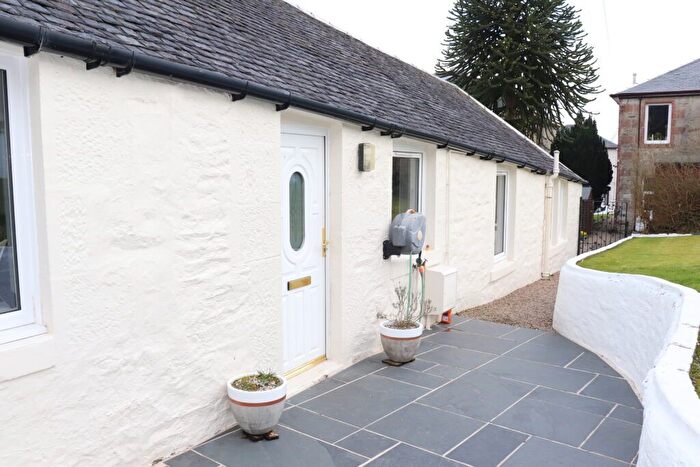
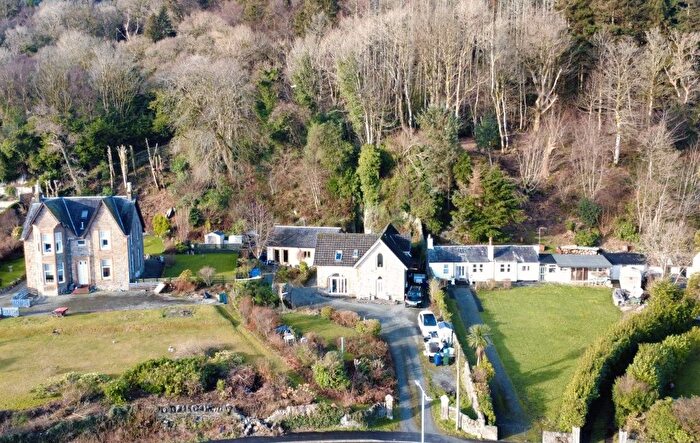
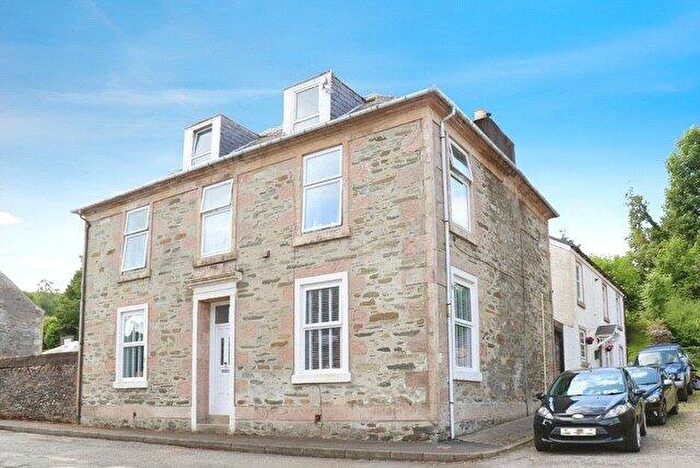
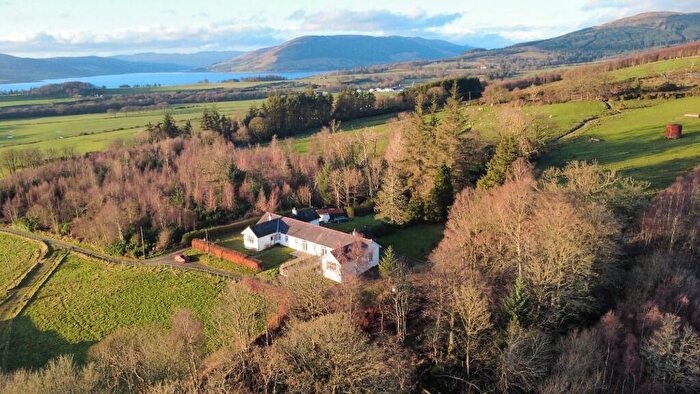
Properties for sale in Isle Of Bute
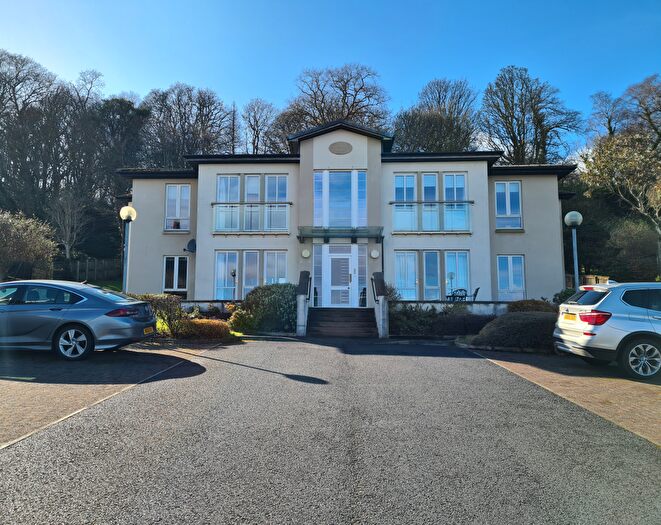
![]()
If you are looking to sell your house, let it out, or receive a property valuation, an expert can help you.
Click the button below to get started.
Neighbourhoods in Isle Of Bute
Navigate through our locations to find the location of your next house in Isle Of Bute, Argyll and Bute for sale or to rent.
Transport in Isle Of Bute
Please see below transportation links in this area:

- FAQ
- Price Paid By Year
Frequently asked questions about Isle Of Bute
What is the average price for a property for sale in Isle Of Bute?
The average price for a property for sale in Isle Of Bute is £141,704. This amount is 32% lower than the average price in Argyll and Bute. There are 846 property listings for sale in Isle Of Bute.
Which train stations are available in or near Isle Of Bute?
Some of the train stations available in or near Isle Of Bute are Wemyss Bay, Largs and Inverkip.
Property Price Paid in Isle Of Bute by Year
The average sold property price by year was:
| Year | Average Sold Price | Price Change |
Sold Properties
|
|---|---|---|---|
| 2025 | £167,970 | 23% |
39 Properties |
| 2024 | £129,448 | -1% |
37 Properties |
| 2023 | £130,933 | -14% |
53 Properties |
| 2022 | £148,792 | 21% |
203 Properties |
| 2021 | £118,234 | 8% |
223 Properties |
| 2020 | £108,573 | 14% |
192 Properties |
| 2019 | £92,924 | -4% |
192 Properties |
| 2018 | £96,830 | -9% |
168 Properties |
| 2017 | £105,377 | 12% |
212 Properties |
| 2016 | £93,045 | -5% |
146 Properties |
| 2015 | £97,572 | 3% |
132 Properties |
| 2014 | £94,258 | -5% |
130 Properties |
| 2013 | £98,570 | 2% |
134 Properties |
| 2012 | £96,226 | -3% |
104 Properties |
| 2011 | £99,327 | -8% |
94 Properties |
| 2010 | £107,473 | 6% |
112 Properties |
| 2009 | £101,209 | 1% |
124 Properties |
| 2008 | £99,886 | -10% |
191 Properties |
| 2007 | £109,478 | 29% |
214 Properties |
| 2006 | £78,249 | 11% |
226 Properties |
| 2005 | £69,644 | 8% |
190 Properties |
| 2004 | £63,822 | 25% |
257 Properties |
| 2003 | £47,991 | -5% |
239 Properties |
| 2002 | £50,382 | 45% |
250 Properties |
| 2001 | £27,508 | - |
18 Properties |