
Houses for sale & to rent in Largs, North Ayrshire
House Prices in Largs
Properties in Largs have an average house price of £182k and had 528 Property Transactions within the last 3 years.¹
Largs is an area in North Ayrshire with 6,341 households², where the most expensive property was sold for £615k.
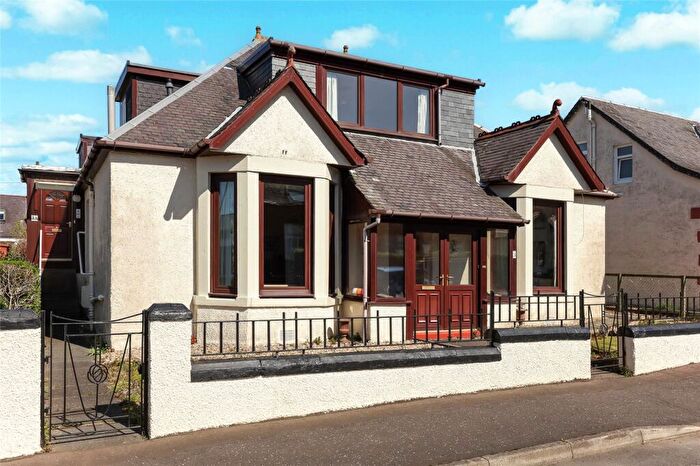
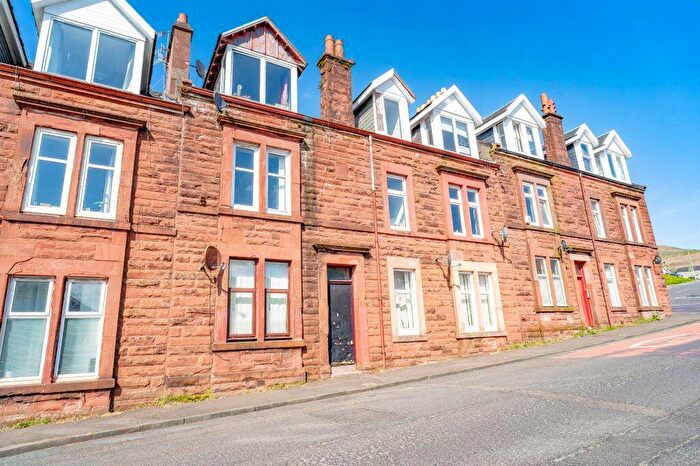
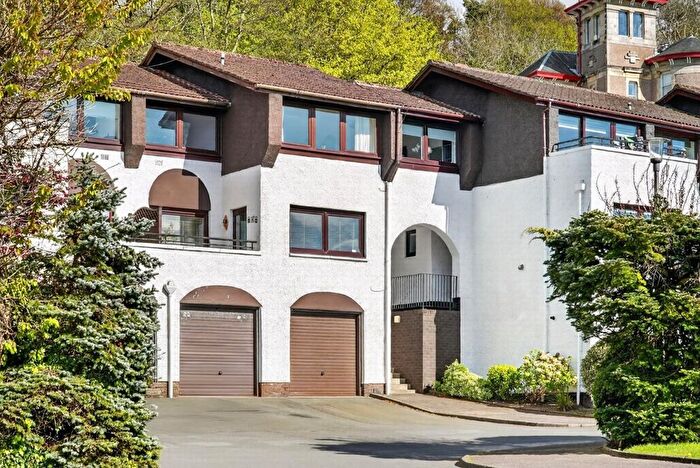
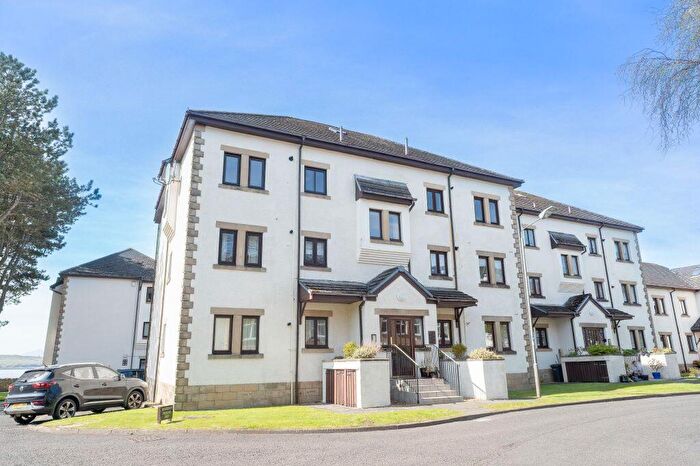
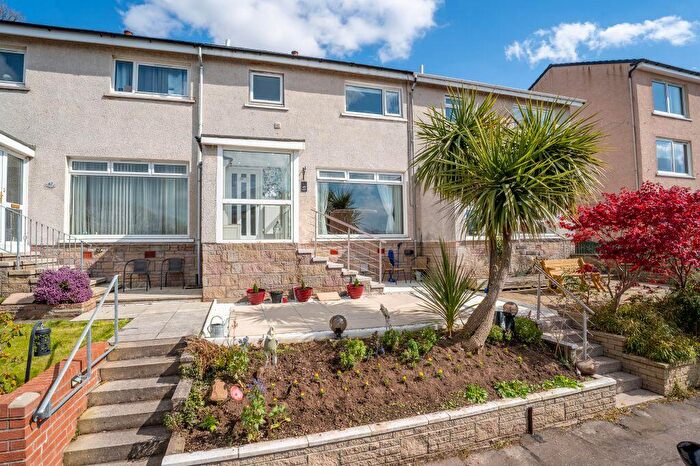
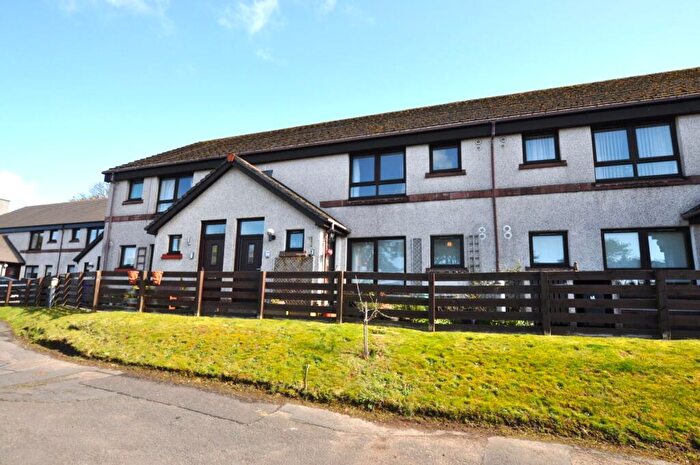
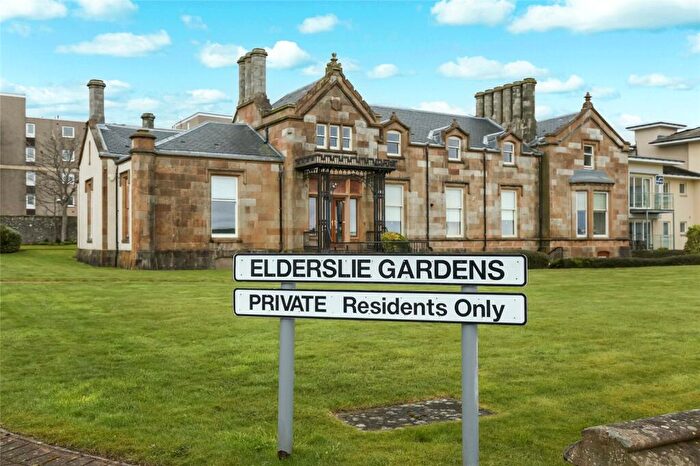
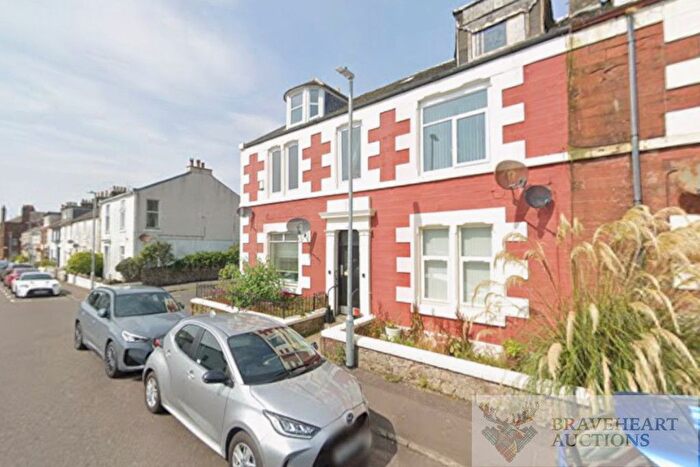
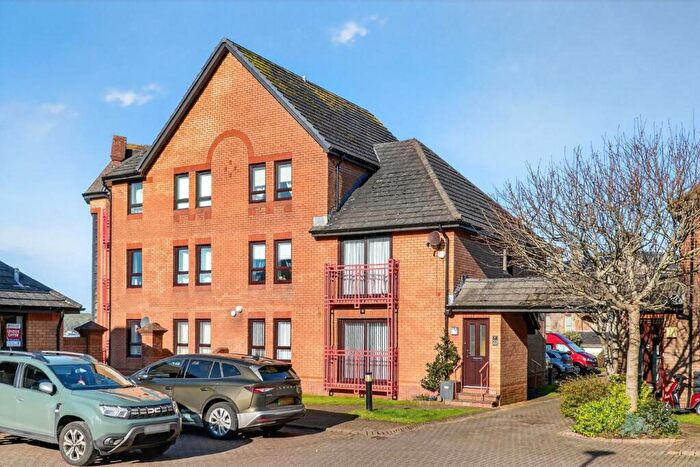
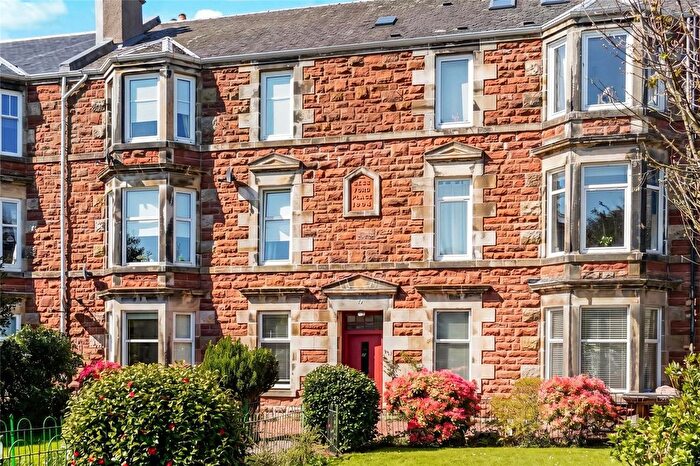
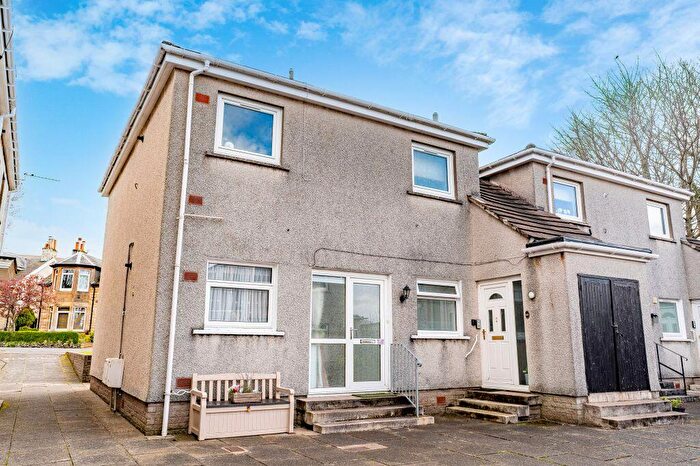
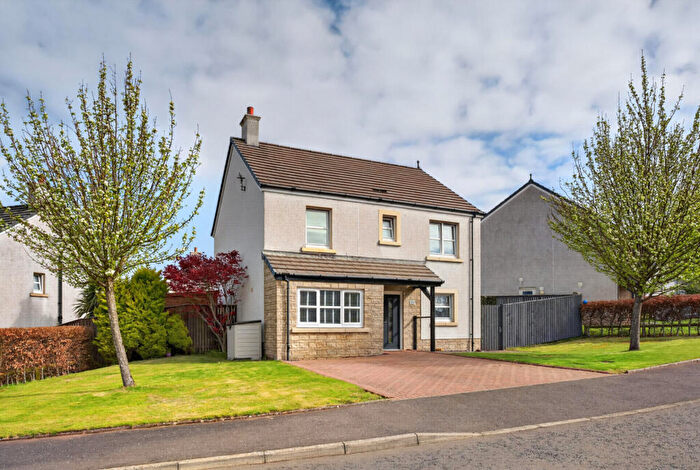
Properties for sale in Largs
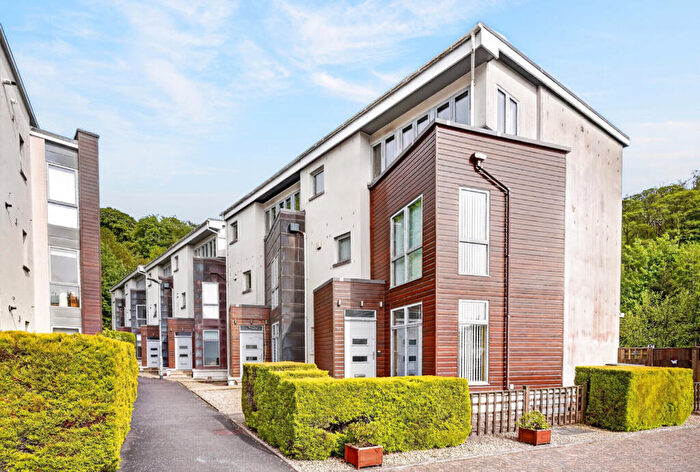
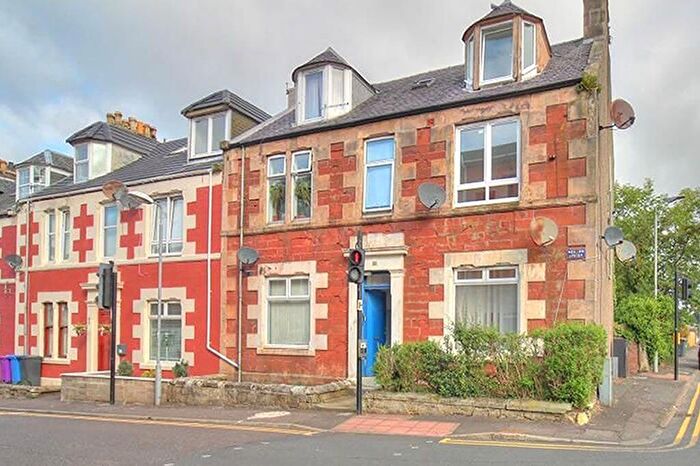
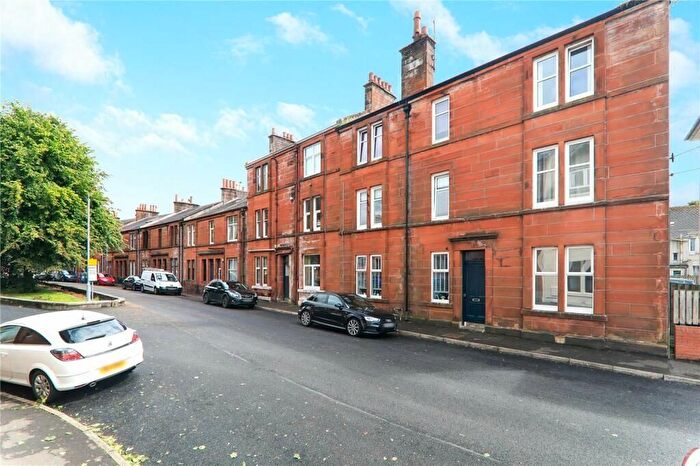
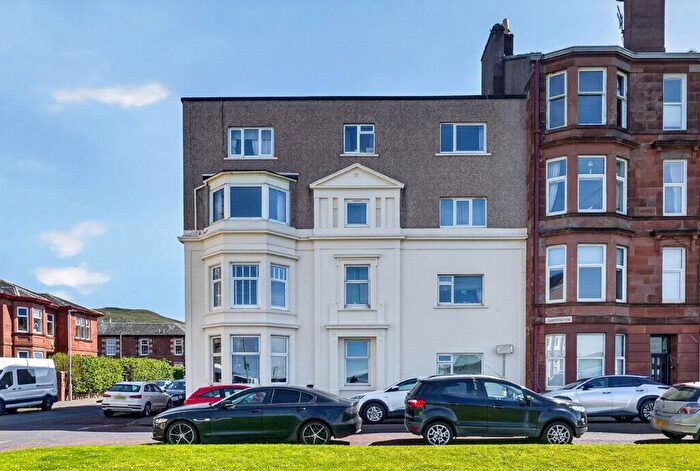
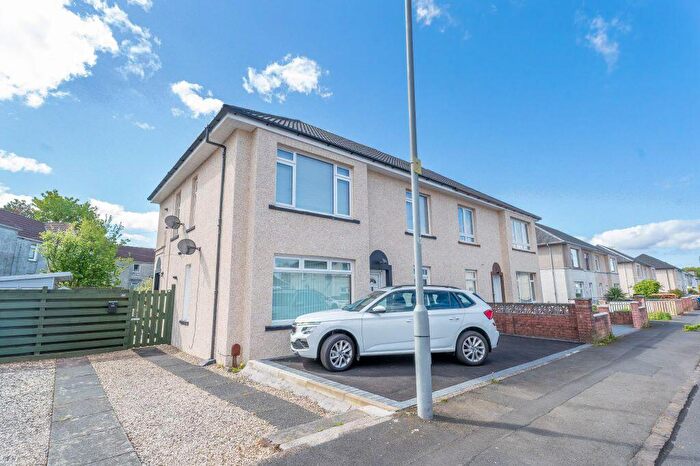

![]()
If you are looking to sell your house, let it out, or receive a property valuation, an expert can help you.
Click the button below to get started.

Neighbourhoods in Largs
Navigate through our locations to find the location of your next house in Largs, North Ayrshire for sale or to rent.
Transport in Largs
Please see below transportation links in this area:
-
 Largs Station
 -
Fairlie Station
-
Wemyss Bay Station
-
West Kilbride Station
-
Inverkip Station
-
Glengarnock Station
-
Dalry Station
-
Lochwinnoch Station
-
IBM Station
- FAQ
- Price Paid By Year
Frequently asked questions about Largs
What is the average price for a property for sale in Largs?
The average price for a property for sale in Largs is £182,146. This amount is 27% higher than the average price in North Ayrshire. There are 1,072 property listings for sale in Largs.
Which train stations are available in or near Largs?
Some of the train stations available in or near Largs are Largs, Fairlie and Wemyss Bay.
Property Price Paid in Largs by Year
The average sold property price by year was:
| Year | Average Sold Price | Price Change |
Sold Properties
|
|---|---|---|---|
| 2025 | £192,834 | 2% |
184 Properties |
| 2024 | £189,229 | 11% |
132 Properties |
| 2023 | £168,459 | 10% |
212 Properties |
| 2022 | £151,786 | 5% |
360 Properties |
| 2021 | £144,523 | -3% |
434 Properties |
| 2020 | £148,700 | 5% |
360 Properties |
| 2019 | £141,541 | 10% |
375 Properties |
| 2018 | £127,511 | -5% |
390 Properties |
| 2017 | £133,687 | 2% |
405 Properties |
| 2016 | £130,935 | -4% |
390 Properties |
| 2015 | £135,918 | 1% |
358 Properties |
| 2014 | £134,193 | 7% |
321 Properties |
| 2013 | £125,325 | 3% |
342 Properties |
| 2012 | £121,535 | -15% |
325 Properties |
| 2011 | £139,663 | -1% |
262 Properties |
| 2010 | £141,034 | 8% |
297 Properties |
| 2009 | £130,127 | -118% |
269 Properties |
| 2008 | £284,120 | 49% |
364 Properties |
| 2007 | £144,189 | 11% |
501 Properties |
| 2006 | £128,682 | 16% |
468 Properties |
| 2005 | £108,188 | -1% |
596 Properties |
| 2004 | £109,270 | 25% |
551 Properties |
| 2003 | £81,730 | 6% |
504 Properties |
| 2002 | £76,612 | 33% |
521 Properties |
| 2001 | £51,684 | - |
46 Properties |