
Houses for sale & to rent in Mid Argyll, Lochgilphead
House Prices in Mid Argyll
Properties in Mid Argyll have an average house price of £160k and had 125 Property Transactions within the last 3 years¹.
Mid Argyll is an area in Lochgilphead, Argyll and Bute with 2,908 households², where the most expensive property was sold for £546k.
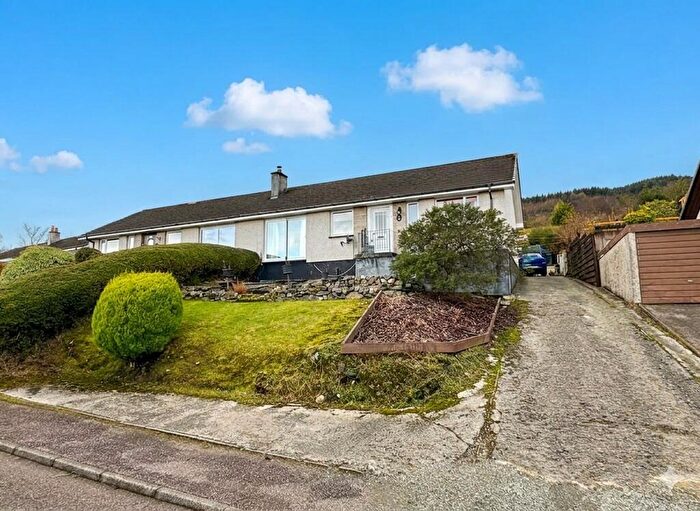
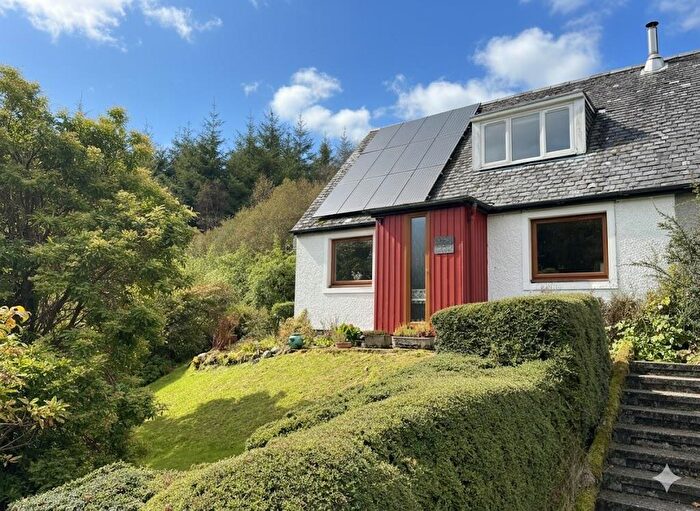
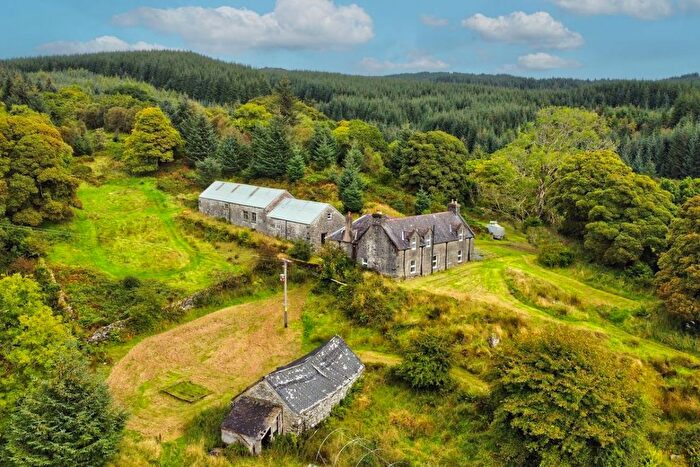
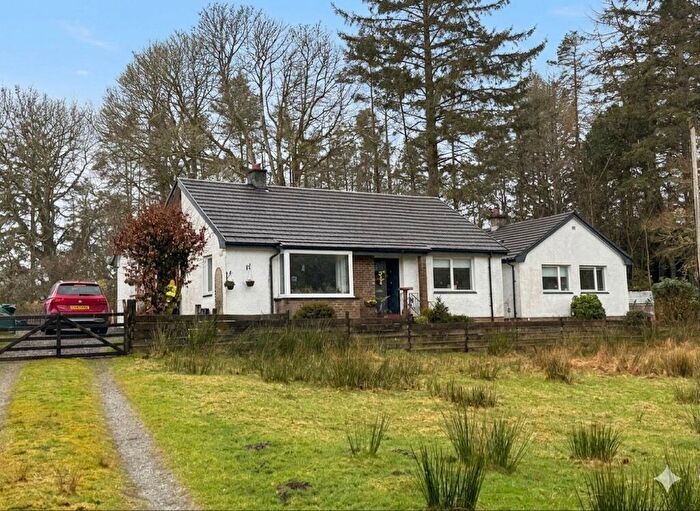
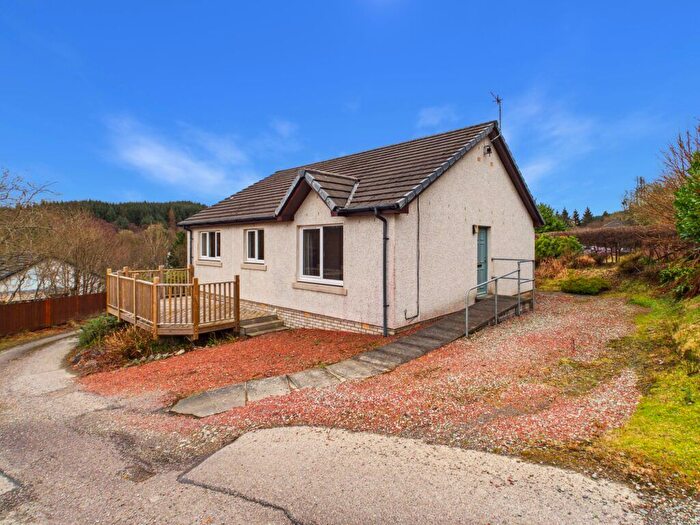
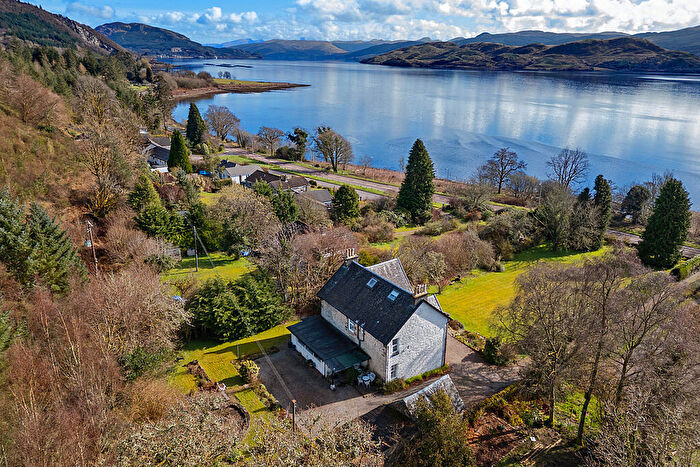
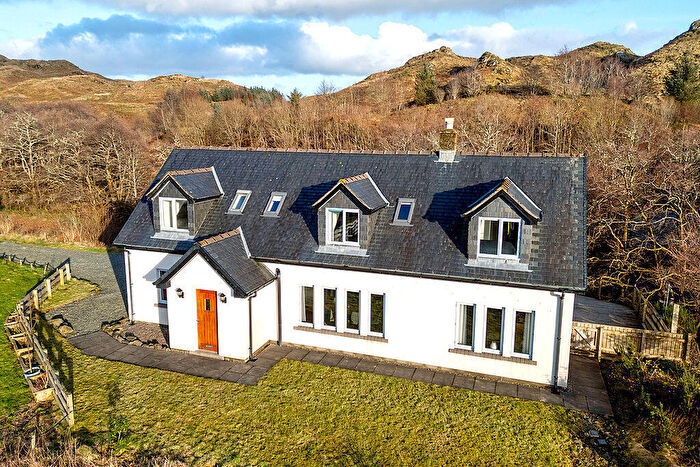
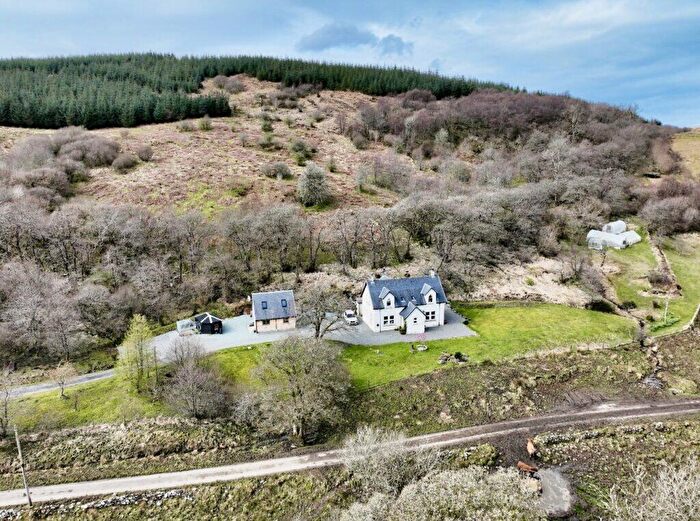
Properties for sale in Mid Argyll
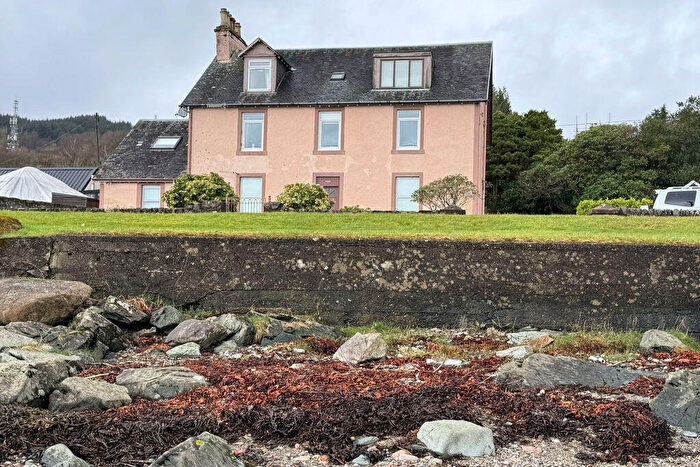
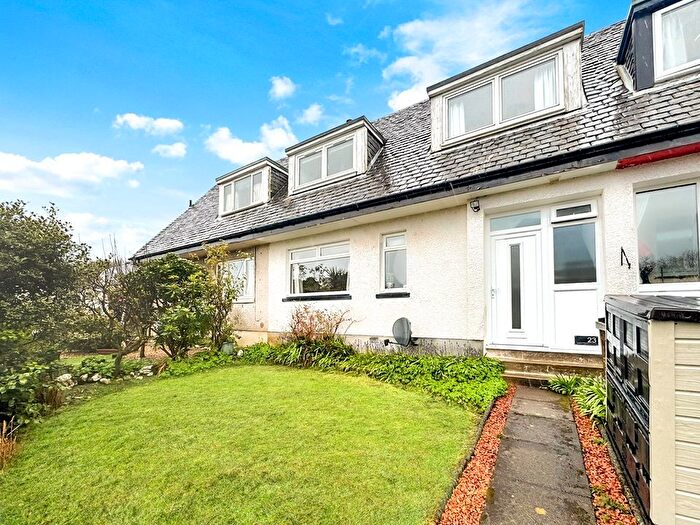
![]()
If you are looking to sell your house, let it out, or receive a property valuation, an expert can help you.
Click the button below to get started.
Roads and Postcodes in Mid Argyll
Navigate through our locations to find the location of your next house in Mid Argyll, Lochgilphead for sale or to rent.
Transport near Mid Argyll
-
 Garelochhead Station
 -
Inverkip Station
-
Wemyss Bay Station
-
Oban Station
-
Gourock Station
-
IBM Station
-
Fort Matilda Station
-
Branchton Station
-
Drumfrochar Station
-
Falls Of Cruachan Station
- FAQ
- Price Paid By Year
Frequently asked questions about Mid Argyll
What is the average price for a property for sale in Mid Argyll?
The average price for a property for sale in Mid Argyll is £159,725. There are 715 property listings for sale in Mid Argyll.
What streets have the most expensive properties for sale in Mid Argyll?
The streets with the most expensive properties for sale in Mid Argyll are Glenburn Road at an average of £325,250, Fernoch Crescent at an average of £288,480 and Dun Mor Avenue at an average of £237,500.
What streets have the most affordable properties for sale in Mid Argyll?
The streets with the most affordable properties for sale in Mid Argyll are Lochnell Street at an average of £58,600, Lorne Street at an average of £60,500 and Blarbuie Road at an average of £72,000.
Which train stations are available in or near Mid Argyll?
Some of the train stations available in or near Mid Argyll are Garelochhead, Inverkip and Wemyss Bay.
Property Price Paid in Mid Argyll by Year
The average sold property price by year was:
| Year | Average Sold Price | Price Change |
Sold Properties
|
|---|---|---|---|
| 2025 | £159,297 | 16% |
33 Properties |
| 2024 | £133,717 | -34% |
39 Properties |
| 2023 | £179,130 | -23% |
53 Properties |
| 2022 | £220,289 | 23% |
128 Properties |
| 2021 | £169,771 | 3% |
147 Properties |
| 2020 | £163,997 | -4% |
96 Properties |
| 2019 | £171,173 | 8% |
119 Properties |
| 2018 | £157,700 | 8% |
133 Properties |
| 2017 | £145,651 | -0,1% |
102 Properties |
| 2016 | £145,869 | -1% |
92 Properties |
| 2015 | £147,956 | 9% |
90 Properties |
| 2014 | £134,492 | -27% |
90 Properties |
| 2013 | £170,716 | 22% |
85 Properties |
| 2012 | £133,891 | 2% |
87 Properties |
| 2011 | £130,614 | -31% |
83 Properties |
| 2010 | £171,431 | 18% |
78 Properties |
| 2009 | £140,033 | 8% |
90 Properties |
| 2008 | £128,497 | -9% |
141 Properties |
| 2007 | £140,555 | -6% |
158 Properties |
| 2006 | £149,659 | 27% |
152 Properties |
| 2005 | £109,383 | 12% |
166 Properties |
| 2004 | £96,723 | 22% |
182 Properties |
| 2003 | £75,919 | -2% |
164 Properties |
| 2002 | £77,466 | 56% |
158 Properties |
| 2001 | £33,821 | - |
7 Properties |