
Houses for sale & to rent in Liberton/Gilmerton, Edinburgh
House Prices in Liberton/Gilmerton
Properties in Liberton/Gilmerton have an average house price of £267,822.00 and had 768 Property Transactions within the last 3 years¹.
Liberton/Gilmerton is an area in Edinburgh, City of Edinburgh with 14,512 households², where the most expensive property was sold for £801,000.00.
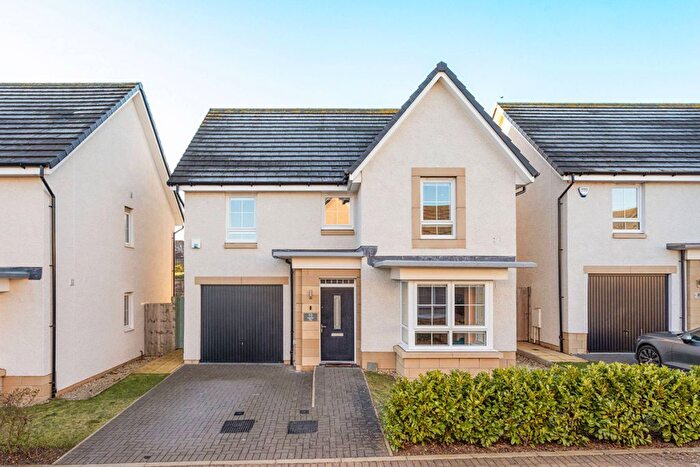
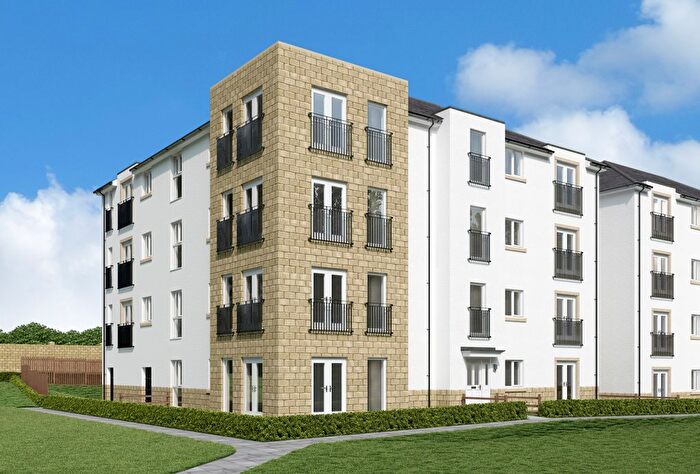
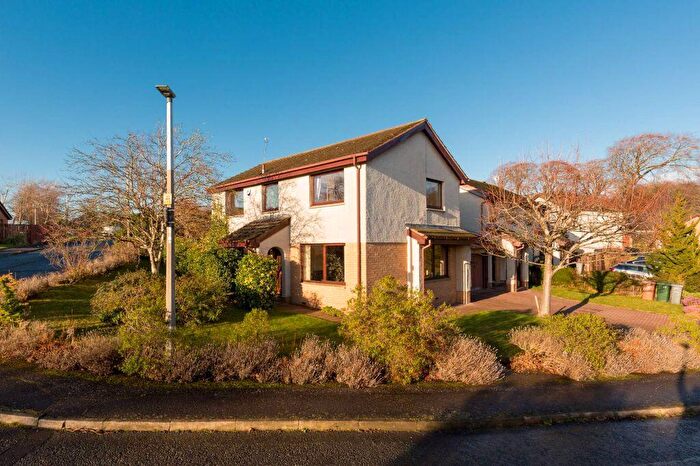
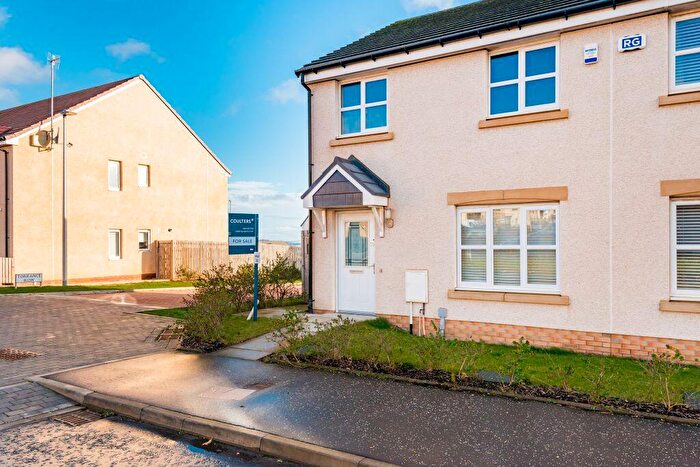
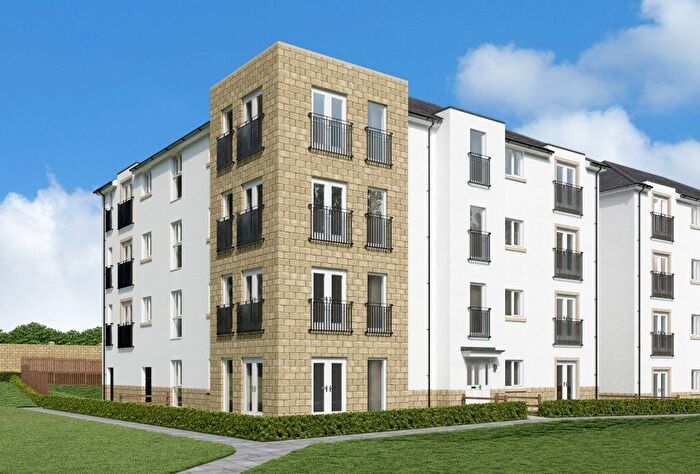
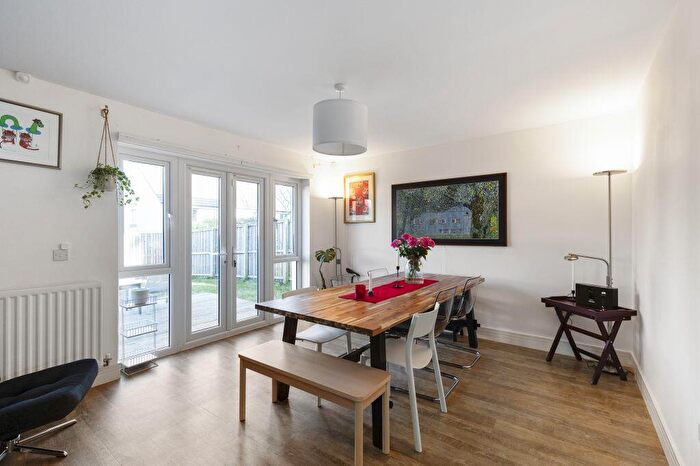
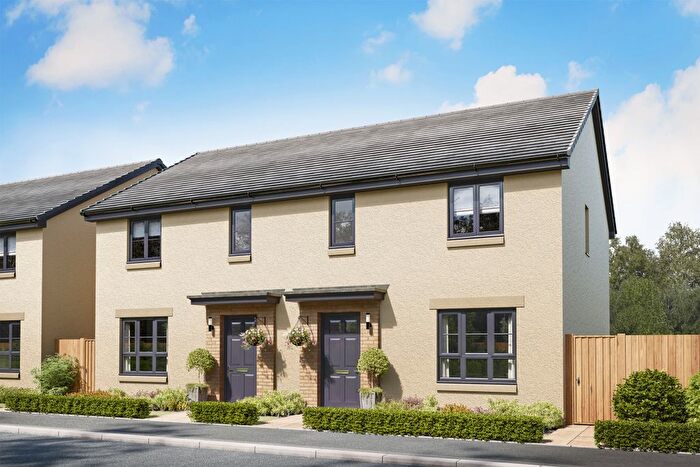
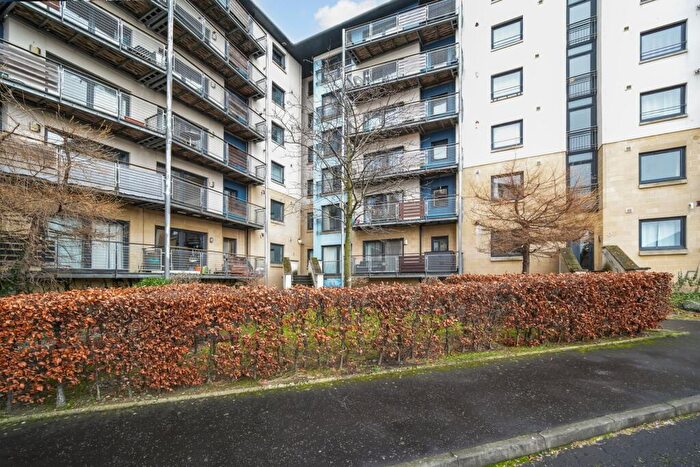
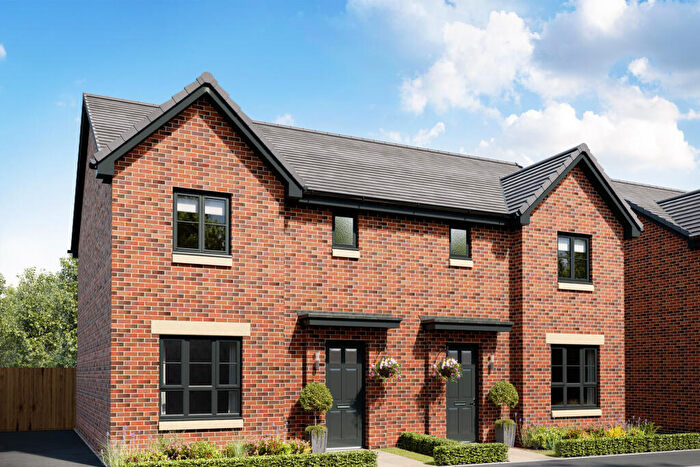
Properties for sale in Liberton/Gilmerton


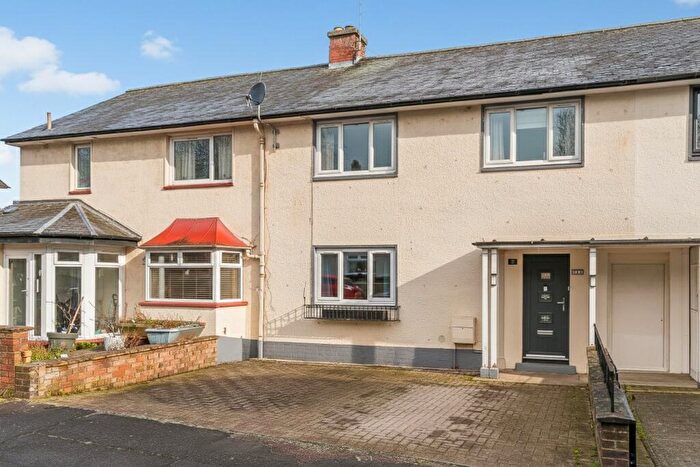
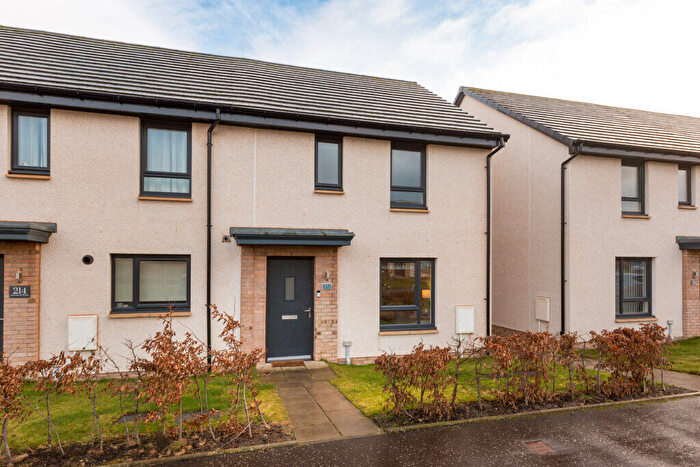

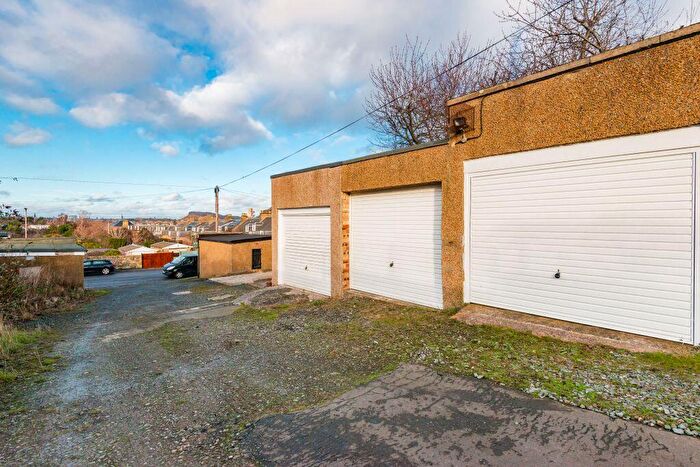
![]()
If you are looking to sell your house, let it out, or receive a property valuation, an expert can help you.
Click the button below to get started.


Roads and Postcodes in Liberton/Gilmerton
Navigate through our locations to find the location of your next house in Liberton/Gilmerton, Edinburgh for sale or to rent.
Transport near Liberton/Gilmerton
-
 Newcraighall Station
 -
Shawfair Station
-
Brunstane Station
-
Eskbank Station
-
Edinburgh Station
-
Musselburgh Station
-
Haymarket Station
-
Slateford Station
-
Newtongrange Station
-
Kingsknowe Station
- FAQ
- Price Paid By Year
Frequently asked questions about Liberton/Gilmerton
What is the average price for a property for sale in Liberton/Gilmerton?
The average price for a property for sale in Liberton/Gilmerton is £267,822. This amount is 20% lower than the average price in Edinburgh. There are 2,713 property listings for sale in Liberton/Gilmerton.
Which train stations are available in or near Liberton/Gilmerton?
Some of the train stations available in or near Liberton/Gilmerton are Newcraighall, Shawfair and Brunstane.
Property Price Paid in Liberton/Gilmerton by Year
The average sold property price by year was:
| Year | Average Sold Price | Price Change |
Sold Properties
|
|---|---|---|---|
| 2023 | £244,965 | -11% |
94 Properties |
| 2022 | £271,010 | 2% |
674 Properties |
| 2021 | £266,326 | 2% |
861 Properties |
| 2020 | £260,101 | 6% |
682 Properties |
| 2019 | £243,851 | 5% |
923 Properties |
| 2018 | £232,444 | 11% |
764 Properties |
| 2017 | £206,497 | 10% |
680 Properties |
| 2016 | £186,742 | 6% |
759 Properties |
| 2015 | £176,299 | 7% |
655 Properties |
| 2014 | £164,058 | 2% |
552 Properties |
| 2013 | £160,114 | 2% |
490 Properties |
| 2012 | £156,843 | -3% |
399 Properties |
| 2011 | £160,878 | 1% |
306 Properties |
| 2010 | £158,621 | 7% |
326 Properties |
| 2009 | £147,470 | -13% |
427 Properties |
| 2008 | £167,310 | - |
507 Properties |
| 2007 | £167,237 | 10% |
654 Properties |
| 2006 | £149,910 | 7% |
742 Properties |
| 2005 | £139,368 | 14% |
680 Properties |
| 2004 | £120,400 | 12% |
849 Properties |
| 2003 | £106,187 | 16% |
910 Properties |
| 2002 | £89,642 | -3% |
869 Properties |
| 2001 | £92,692 | 2% |
107 Properties |
| 2000 | £91,139 | - |
42 Properties |