
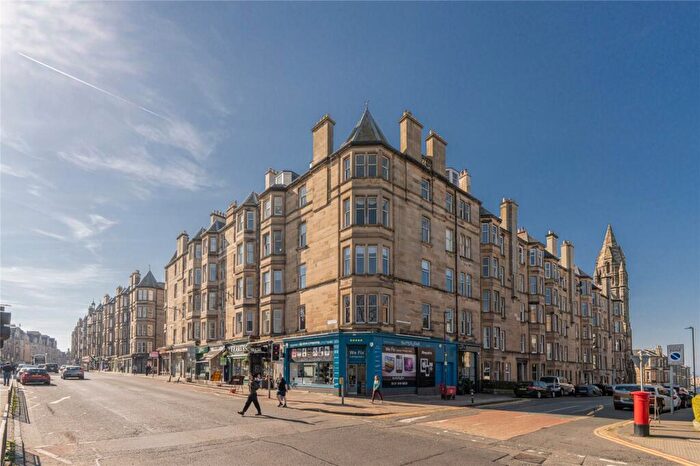
Houses for sale & to rent in Edinburgh, City of Edinburgh
House Prices in Edinburgh
Properties in Edinburgh have an average house price of £385k and had 7,910 Property Transactions within the last 3 years.¹
Edinburgh is an area in City of Edinburgh with 215,939 households², where the most expensive property was sold for £5.96M.
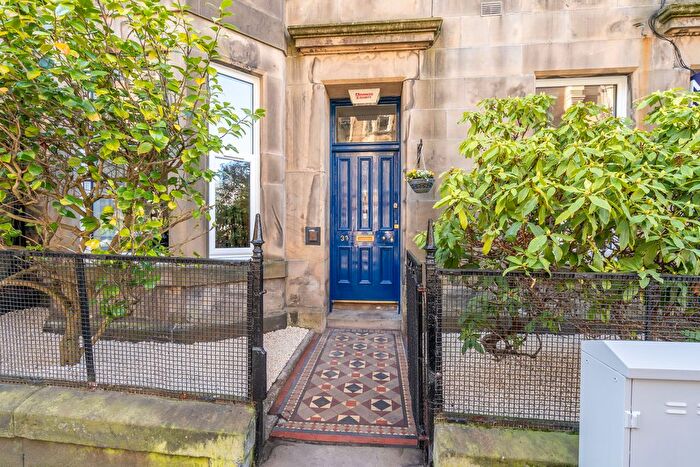
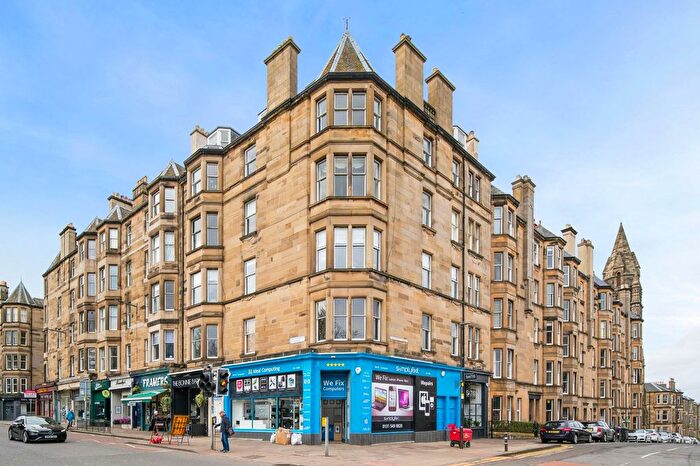
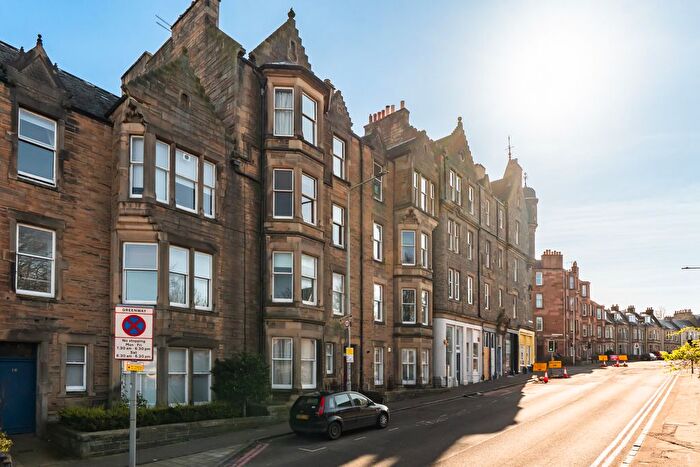
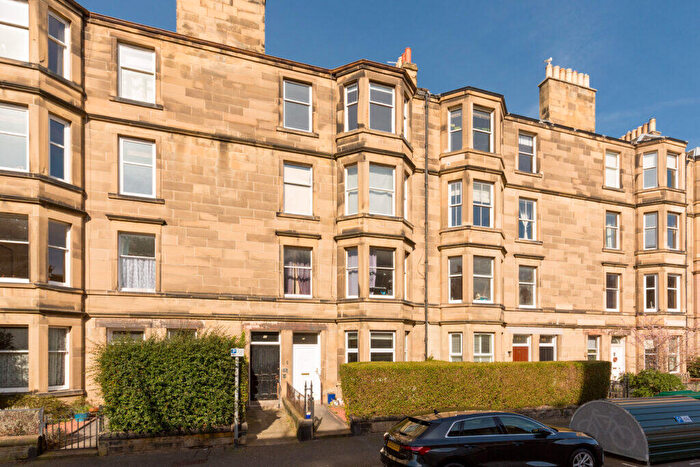
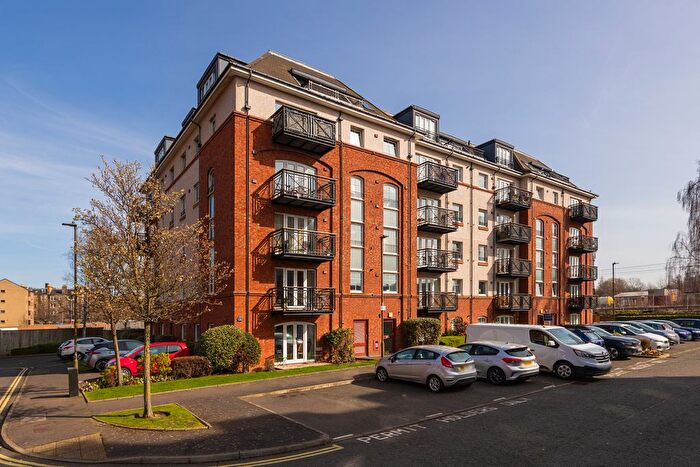
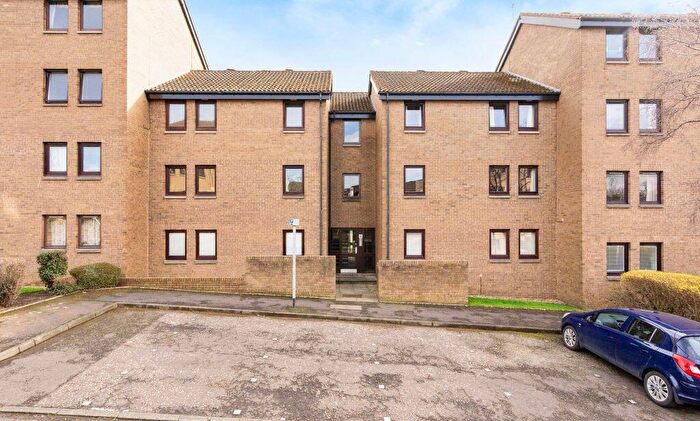
Properties for sale in Edinburgh

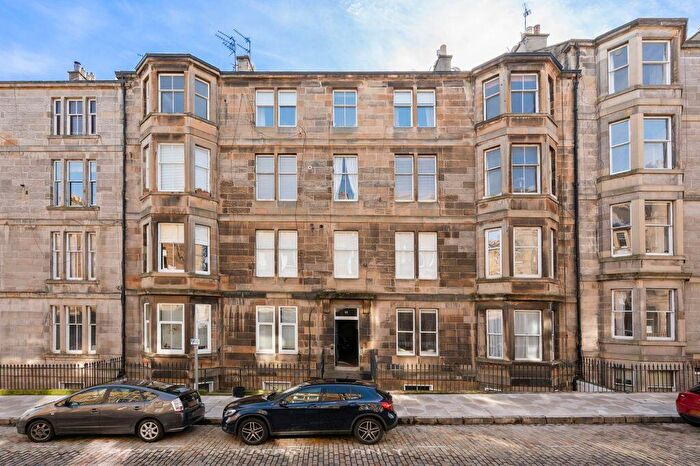
![]()
If you are looking to sell your house, let it out, or receive a property valuation, an expert can help you.
Click the button below to get started.


Neighbourhoods in Edinburgh
Navigate through our locations to find the location of your next house in Edinburgh, City of Edinburgh for sale or to rent.
Transport in Edinburgh
Please see below transportation links in this area:

- FAQ
- Price Paid By Year
Frequently asked questions about Edinburgh
What is the average price for a property for sale in Edinburgh?
The average price for a property for sale in Edinburgh is £385,125. This amount is 2% higher than the average price in City of Edinburgh. There are more than 10,000 property listings for sale in Edinburgh.
What locations have the most expensive properties for sale in Edinburgh?
The locations with the most expensive properties for sale in Edinburgh are City Centre at an average of £615,960, Morningside at an average of £604,079 and Southside/Newington at an average of £562,052.
What locations have the most affordable properties for sale in Edinburgh?
The locations with the most affordable properties for sale in Edinburgh are Sighthill/Gorgie at an average of £213,865, Liberton/Gilmerton at an average of £267,715 and Drum Brae/Gyle at an average of £297,705.
Which train stations are available in or near Edinburgh?
Some of the train stations available in or near Edinburgh are Haymarket, Edinburgh and Slateford.
Property Price Paid in Edinburgh by Year
The average sold property price by year was:
| Year | Average Sold Price | Price Change |
Sold Properties
|
|---|---|---|---|
| 2025 | £408,647 | 2% |
2,255 Properties |
| 2024 | £401,767 | 11% |
2,278 Properties |
| 2023 | £358,192 | 5% |
3,377 Properties |
| 2022 | £338,540 | 7% |
10,096 Properties |
| 2021 | £313,919 | 4% |
11,986 Properties |
| 2020 | £302,765 | 6% |
8,179 Properties |
| 2019 | £283,860 | 1% |
10,904 Properties |
| 2018 | £280,290 | 8% |
10,583 Properties |
| 2017 | £258,262 | 5% |
11,344 Properties |
| 2016 | £244,065 | -2% |
11,657 Properties |
| 2015 | £247,911 | 5% |
11,835 Properties |
| 2014 | £235,638 | 3% |
10,618 Properties |
| 2013 | £228,742 | 1% |
9,271 Properties |
| 2012 | £226,110 | -2% |
7,420 Properties |
| 2011 | £230,724 | -5% |
6,680 Properties |
| 2010 | £243,113 | 5% |
6,992 Properties |
| 2009 | £230,205 | -13% |
7,252 Properties |
| 2008 | £260,986 | -66% |
9,339 Properties |
| 2007 | £433,830 | 42% |
12,621 Properties |
| 2006 | £252,201 | 15% |
14,164 Properties |
| 2005 | £214,476 | 19% |
12,837 Properties |
| 2004 | £174,506 | 9% |
14,603 Properties |
| 2003 | £158,687 | 7% |
14,994 Properties |
| 2002 | £147,896 | 25% |
14,743 Properties |
| 2001 | £111,457 | 2% |
1,702 Properties |
| 2000 | £109,684 | - |
812 Properties |