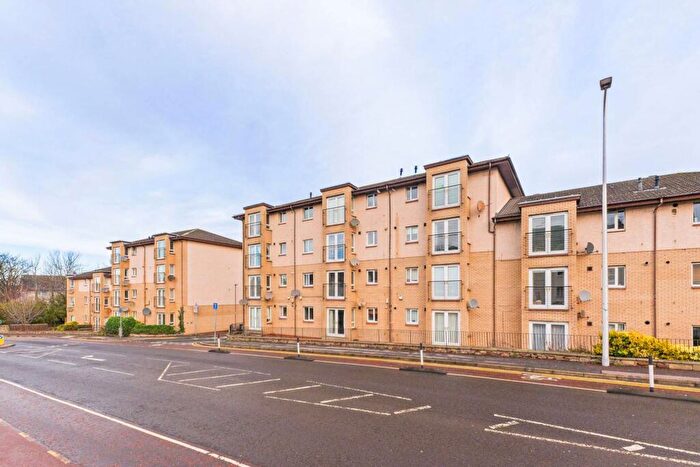
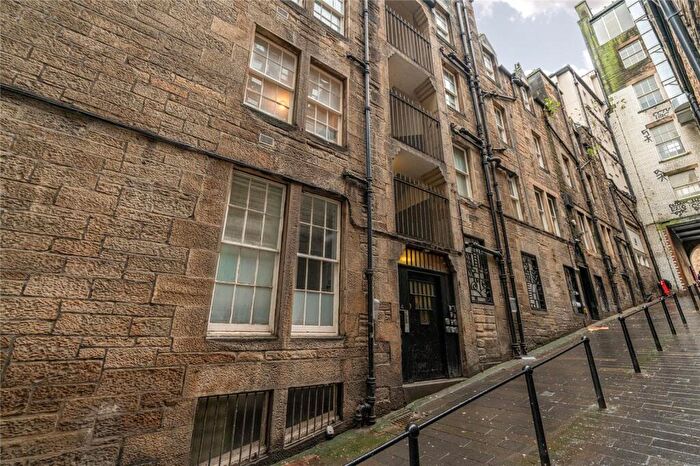
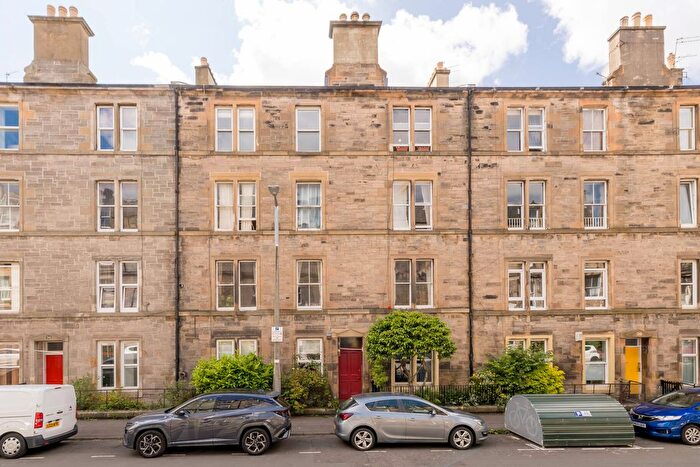
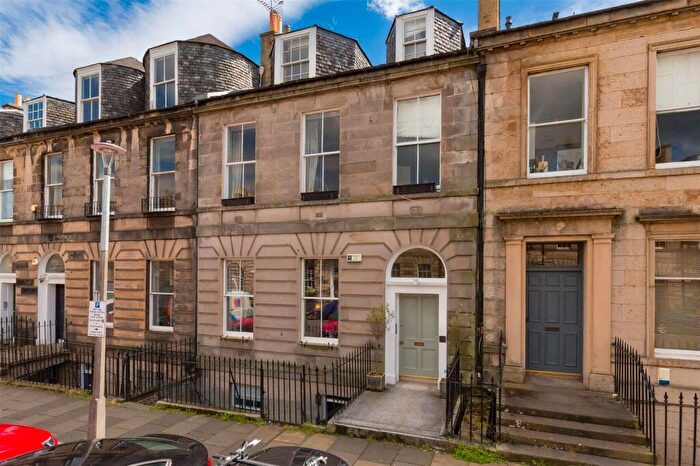
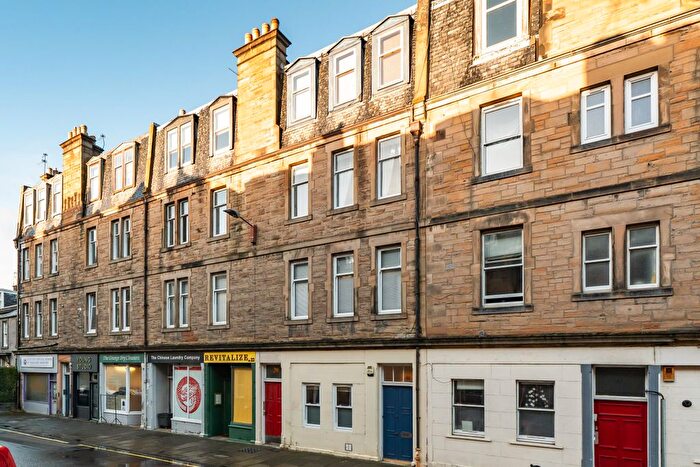
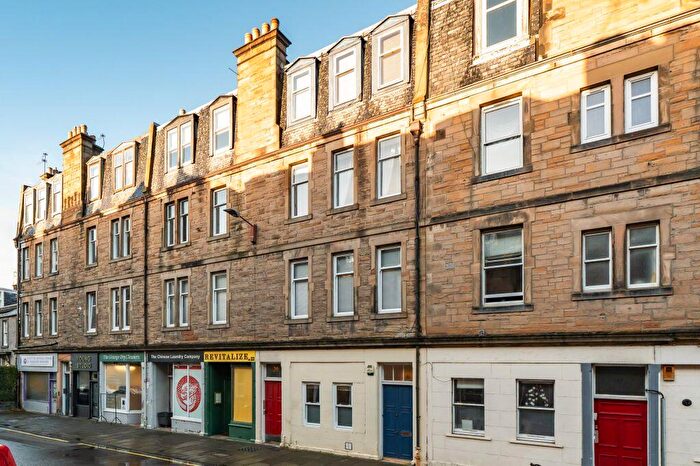
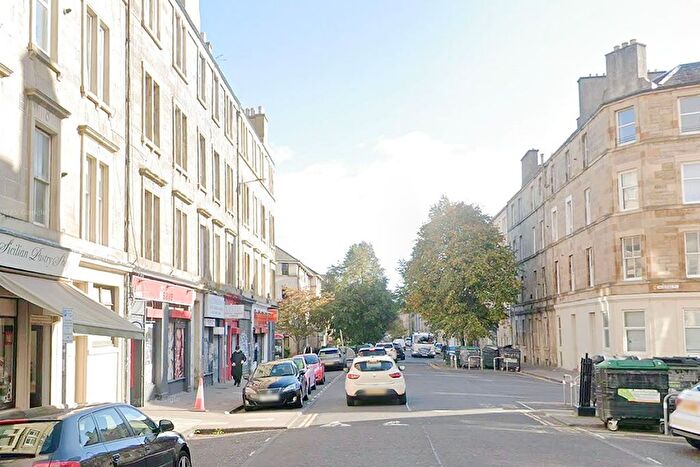
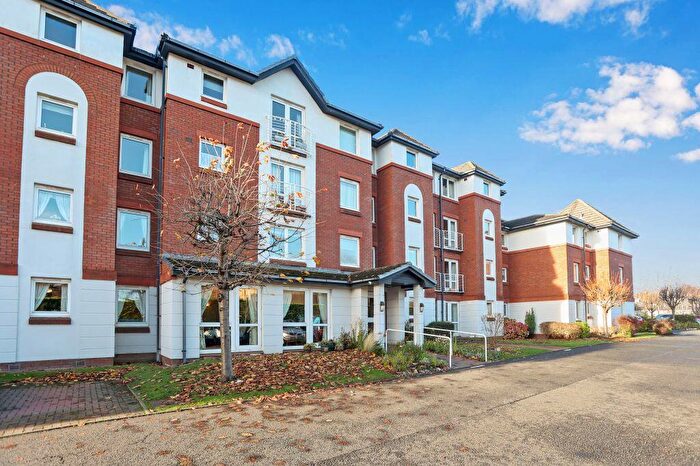
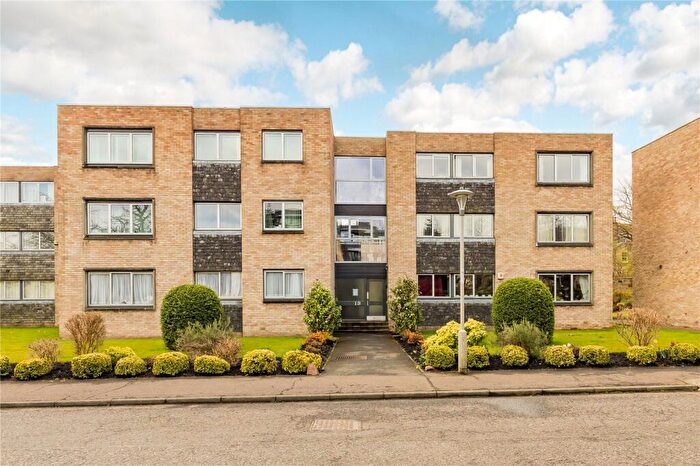
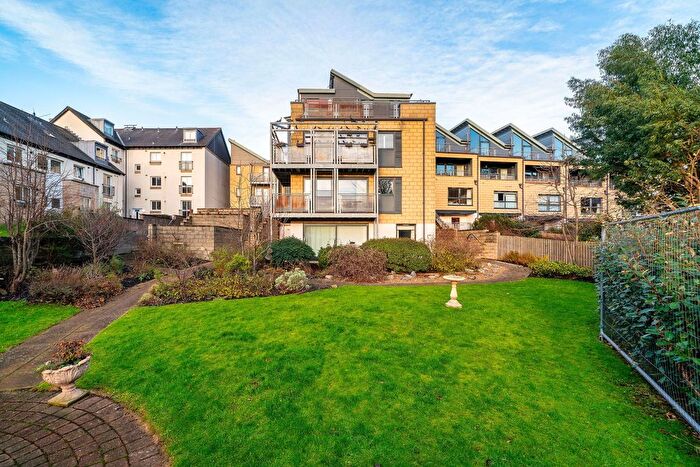
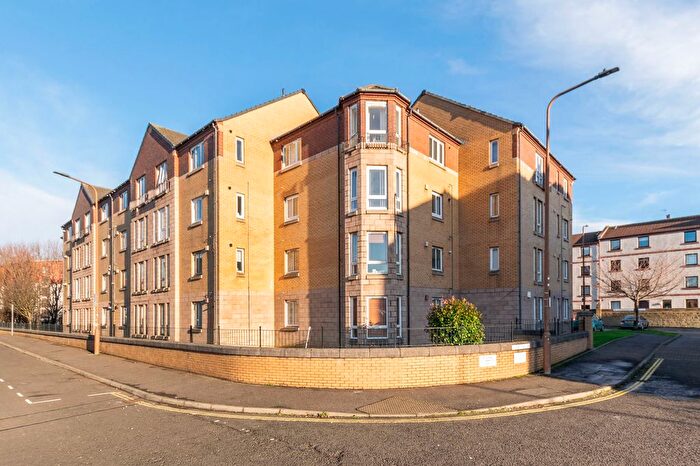
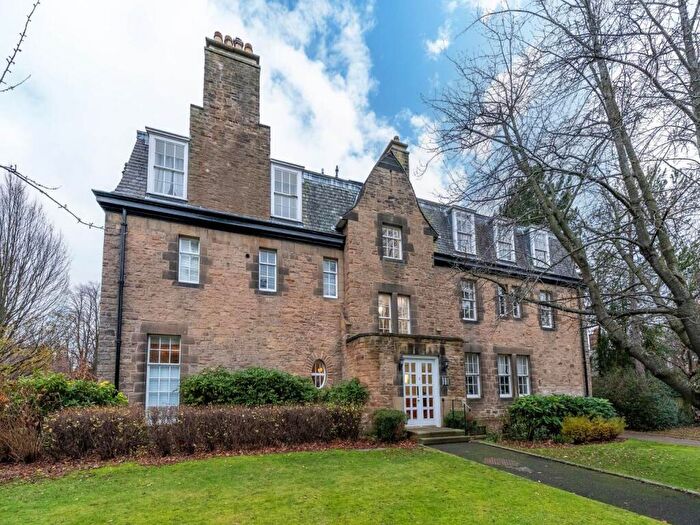
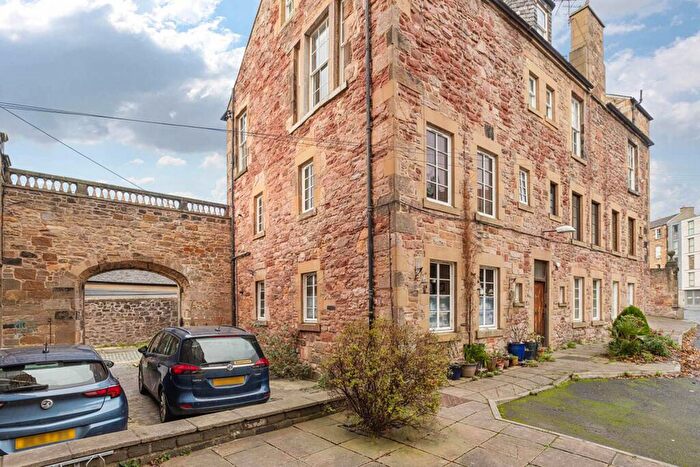
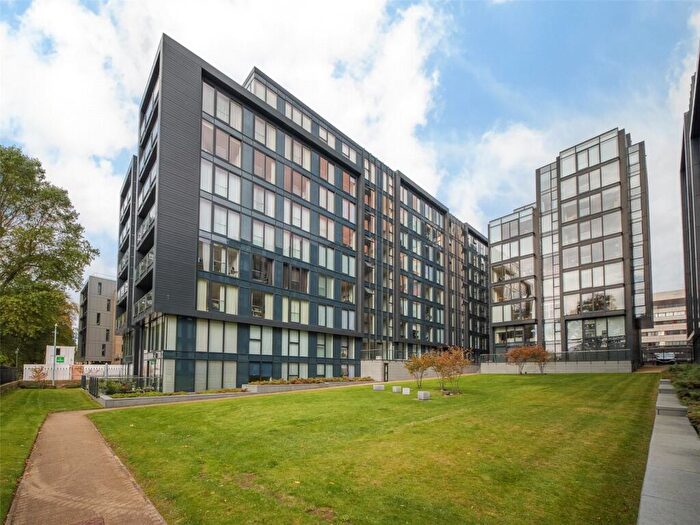
Houses for sale & to rent in Southside/Newington, Edinburgh
House Prices in Southside/Newington
Properties in Southside/Newington have an average house price of £410,700.00 and had 625 Property Transactions within the last 3 years¹.
Southside/Newington is an area in Edinburgh, City of Edinburgh with 13,847 households², where the most expensive property was sold for £2,600,000.00.
Properties for sale in Southside/Newington
Roads and Postcodes in Southside/Newington
Navigate through our locations to find the location of your next house in Southside/Newington, Edinburgh for sale or to rent.
Transport near Southside/Newington
- FAQ
- Price Paid By Year
Frequently asked questions about Southside/Newington
What is the average price for a property for sale in Southside/Newington?
The average price for a property for sale in Southside/Newington is £410,700. This amount is 23% higher than the average price in Edinburgh. There are 4,253 property listings for sale in Southside/Newington.
Which train stations are available in or near Southside/Newington?
Some of the train stations available in or near Southside/Newington are Edinburgh, Haymarket and Slateford.
Property Price Paid in Southside/Newington by Year
The average sold property price by year was:
| Year | Average Sold Price | Price Change |
Sold Properties
|
|---|---|---|---|
| 2023 | £392,084 | -6% |
87 Properties |
| 2022 | £413,711 | 10% |
538 Properties |
| 2021 | £372,871 | -3% |
622 Properties |
| 2020 | £383,382 | 3% |
373 Properties |
| 2019 | £372,055 | -2% |
567 Properties |
| 2018 | £378,787 | 9% |
542 Properties |
| 2017 | £345,021 | 7% |
574 Properties |
| 2016 | £321,208 | 4% |
638 Properties |
| 2015 | £308,295 | 7% |
693 Properties |
| 2014 | £287,158 | 3% |
611 Properties |
| 2013 | £278,679 | -3% |
567 Properties |
| 2012 | £286,775 | 1% |
503 Properties |
| 2011 | £285,288 | -2% |
404 Properties |
| 2010 | £289,966 | 8% |
441 Properties |
| 2009 | £266,975 | -78% |
418 Properties |
| 2008 | £474,425 | 34% |
541 Properties |
| 2007 | £313,088 | 15% |
701 Properties |
| 2006 | £265,954 | -33% |
852 Properties |
| 2005 | £353,111 | 42% |
758 Properties |
| 2004 | £205,671 | 2% |
852 Properties |
| 2003 | £202,038 | 10% |
874 Properties |
| 2002 | £181,339 | 19% |
837 Properties |
| 2001 | £146,573 | 2% |
111 Properties |
| 2000 | £143,716 | - |
62 Properties |

