
Houses for sale & to rent in City of Edinburgh, Scotland
House Prices in City of Edinburgh
Properties in City of Edinburgh have
an average house price of
£378k
and had 8,482 Property Transactions
within the last 3 years.¹
City of Edinburgh is a location in
Scotland with
222,850 households², where the most expensive property was sold for £5.96M.
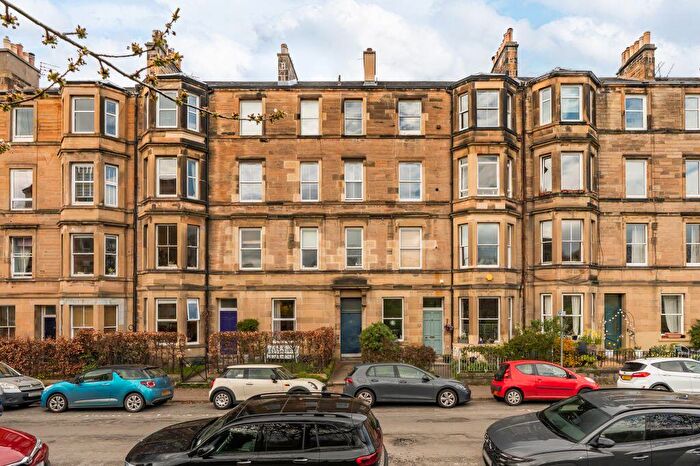
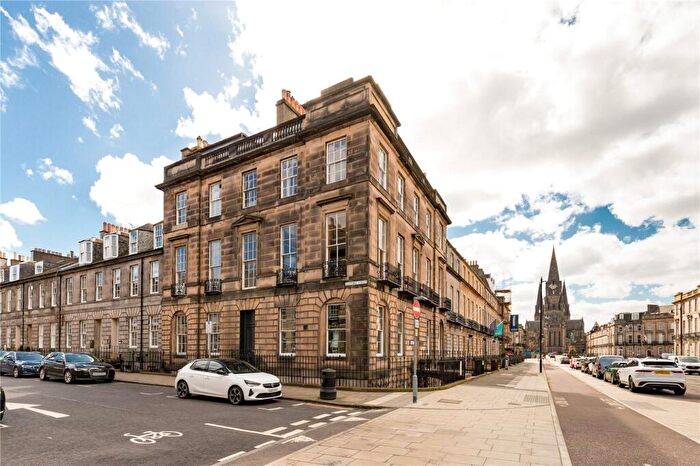
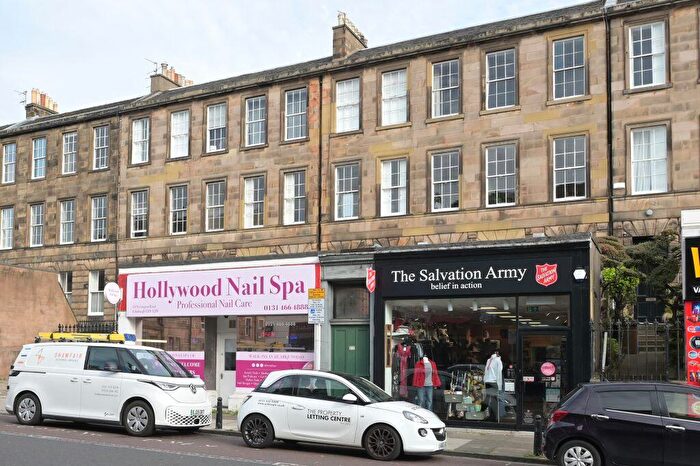
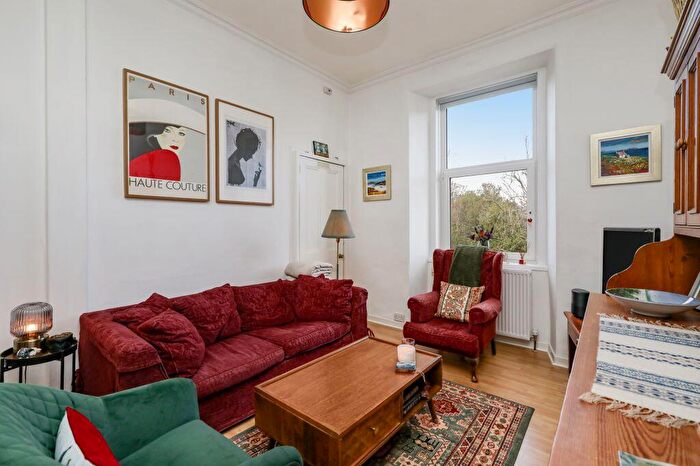
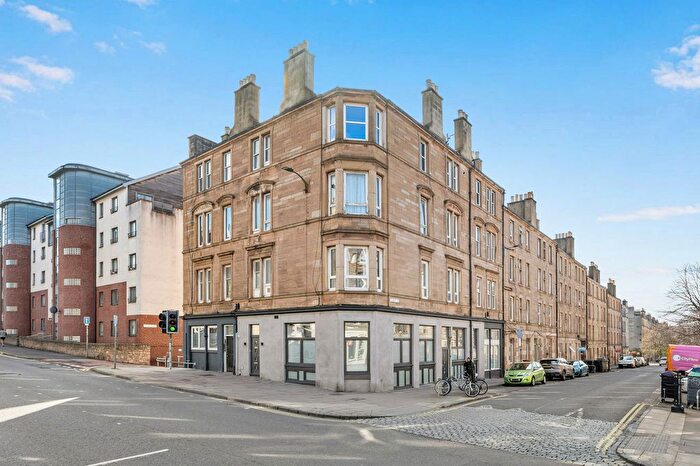
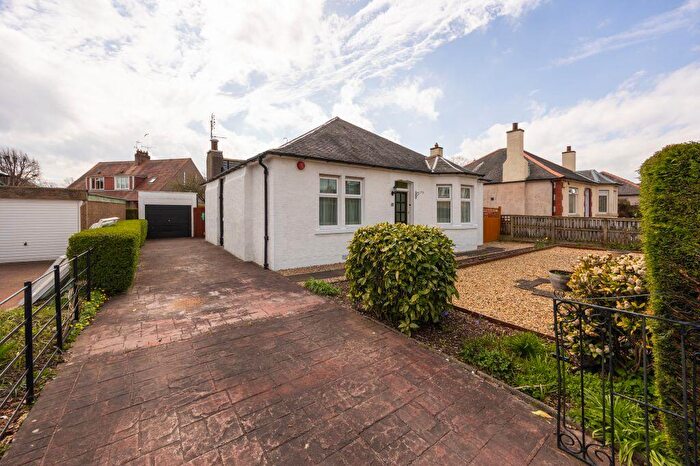
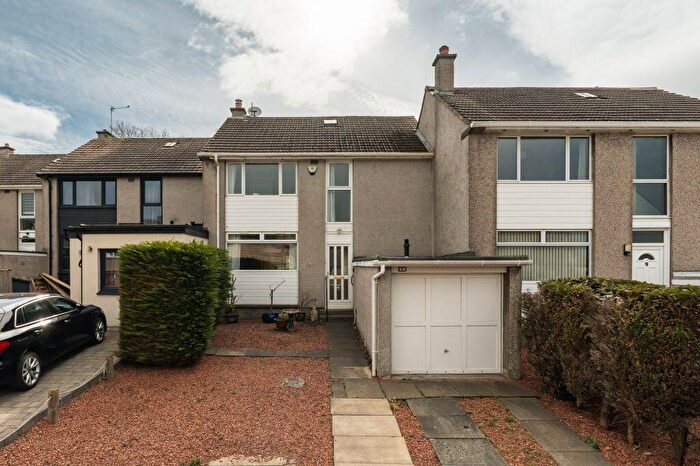
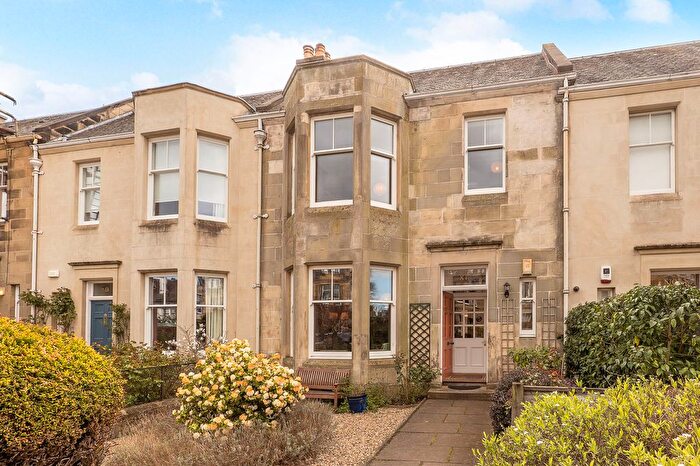
Properties for sale in City of Edinburgh
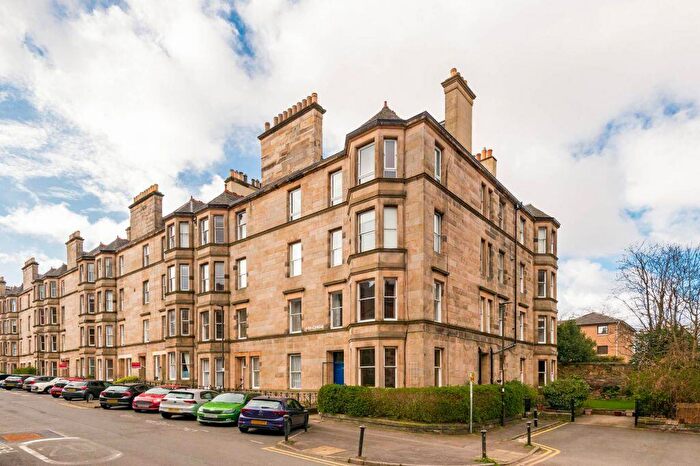
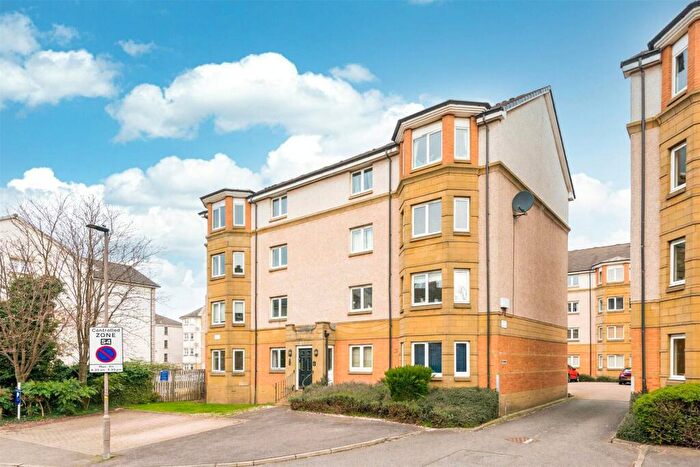

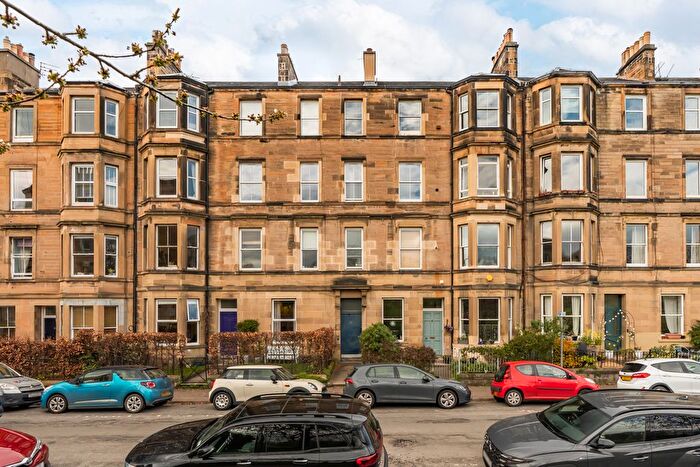
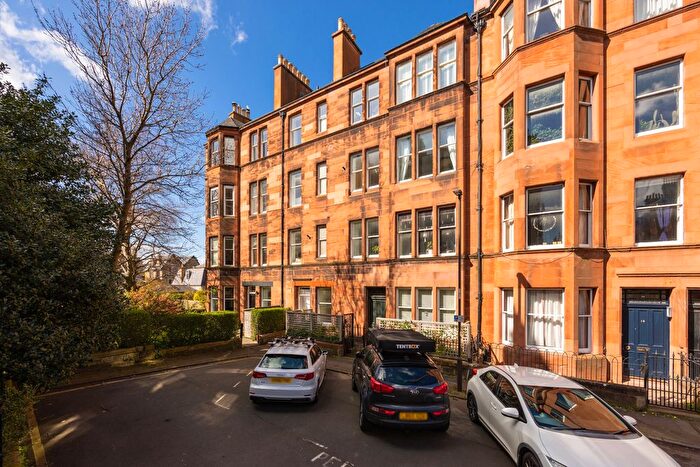
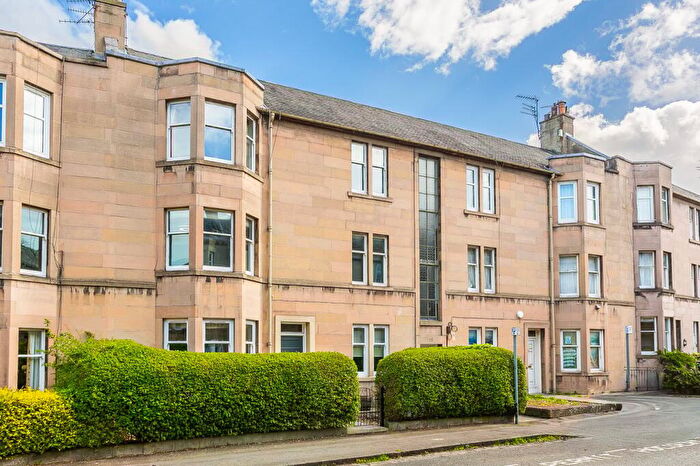
![]()
If you are looking to sell your house, let it out, or receive a property valuation, an expert can help you.
Click the button below to get started.


Towns in City of Edinburgh
Navigate through our locations to find the location of your next house in City of Edinburgh, Scotland for sale or to rent.
Transport in City of Edinburgh
Please see below transportation links in this area:

- FAQ
- Price Paid By Year
Frequently asked questions about City of Edinburgh
What is the average price for a property for sale in City of Edinburgh?
The average price for a property for sale in City of Edinburgh is £378,272. This amount is 88% higher than the average price in Scotland. There are more than 10,000 property listings for sale in City of Edinburgh.
What locations have the most expensive properties for sale in City of Edinburgh?
The locations with the most expensive properties for sale in City of Edinburgh are Kirknewton at an average of £472,857, Edinburgh at an average of £385,125 and Livingston at an average of £382,500.
What locations have the most affordable properties for sale in City of Edinburgh?
The locations with the most affordable properties for sale in City of Edinburgh are South Queensferry at an average of £267,634, Newbridge at an average of £277,772 and Kirkliston at an average of £299,524.
Which train stations are available in or near City of Edinburgh?
Some of the train stations available in or near City of Edinburgh are Haymarket, Edinburgh and Slateford.
Property Price Paid in City of Edinburgh by Year
The average sold property price by year was:
| Year | Average Sold Price | Price Change |
Sold Properties
|
|---|---|---|---|
| 2025 | £398,970 | 1% |
2,447 Properties |
| 2024 | £393,604 | 10% |
2,453 Properties |
| 2023 | £353,632 | 4% |
3,582 Properties |
| 2022 | £337,928 | 8% |
10,563 Properties |
| 2021 | £311,967 | 3% |
12,486 Properties |
| 2020 | £301,336 | 6% |
8,488 Properties |
| 2019 | £283,501 | 2% |
11,395 Properties |
| 2018 | £278,840 | 8% |
11,189 Properties |
| 2017 | £257,178 | 5% |
12,108 Properties |
| 2016 | £244,186 | -2% |
12,341 Properties |
| 2015 | £248,326 | 5% |
12,422 Properties |
| 2014 | £235,185 | 3% |
10,996 Properties |
| 2013 | £228,527 | 1% |
9,641 Properties |
| 2012 | £226,741 | -2% |
7,856 Properties |
| 2011 | £231,376 | -4% |
6,960 Properties |
| 2010 | £241,683 | 5% |
7,143 Properties |
| 2009 | £229,721 | -13% |
7,454 Properties |
| 2008 | £259,133 | -64% |
9,574 Properties |
| 2007 | £425,924 | 42% |
13,025 Properties |
| 2006 | £248,977 | 15% |
14,633 Properties |
| 2005 | £212,357 | 18% |
13,209 Properties |
| 2004 | £173,346 | 9% |
14,988 Properties |
| 2003 | £157,436 | 7% |
15,478 Properties |
| 2002 | £146,658 | 24% |
15,152 Properties |
| 2001 | £111,011 | 1% |
1,741 Properties |
| 2000 | £109,473 | - |
815 Properties |