
Houses for sale & to rent in Castle Douglas, Dumfries and Galloway
House Prices in Castle Douglas
Properties in Castle Douglas have an average house price of £189k and had 214 Property Transactions within the last 3 years.¹
Castle Douglas is an area in Dumfries and Galloway with 5,555 households², where the most expensive property was sold for £900k.
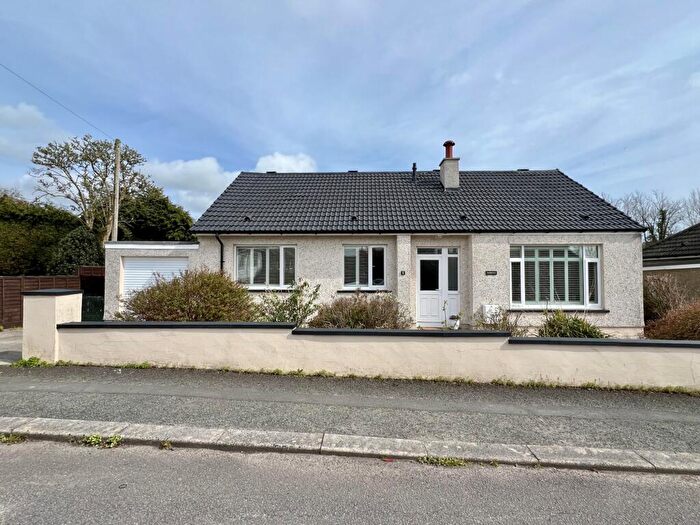
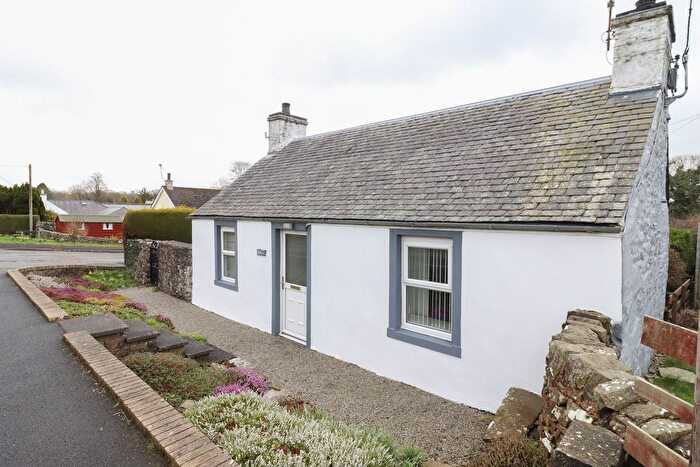
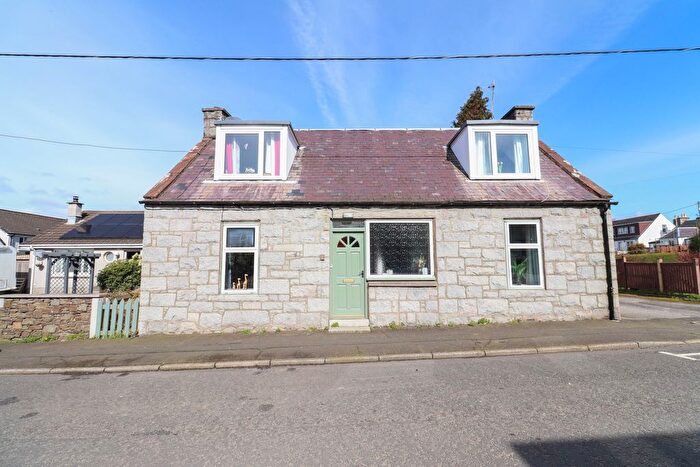
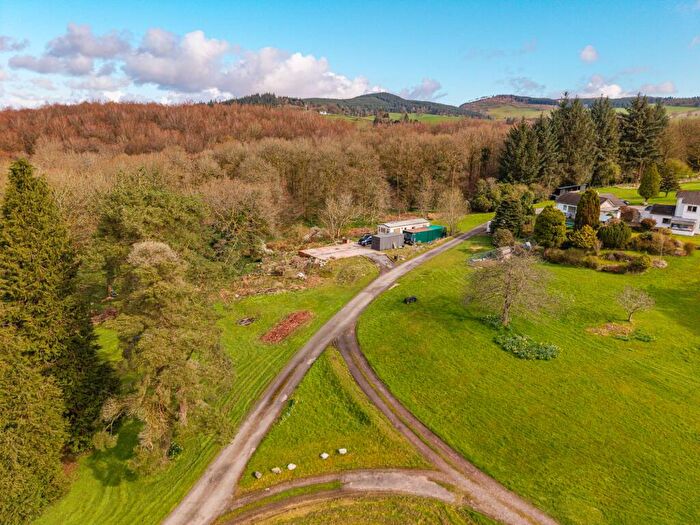
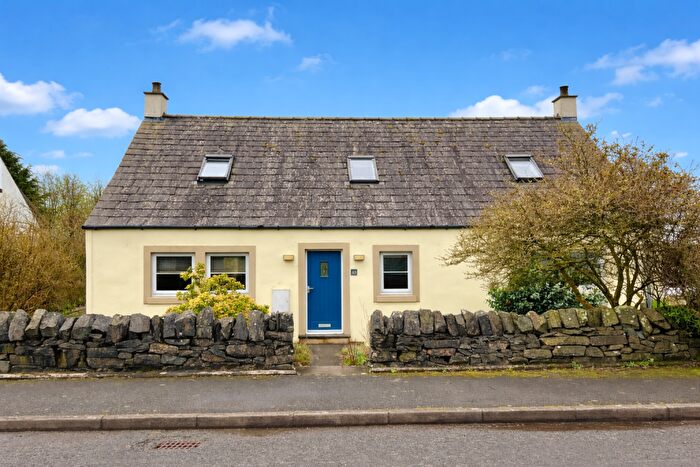
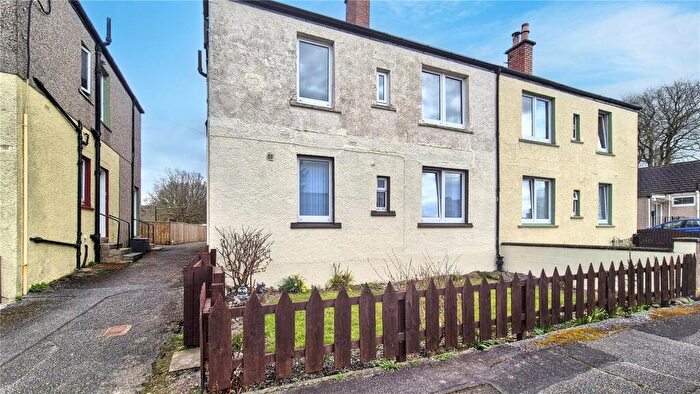
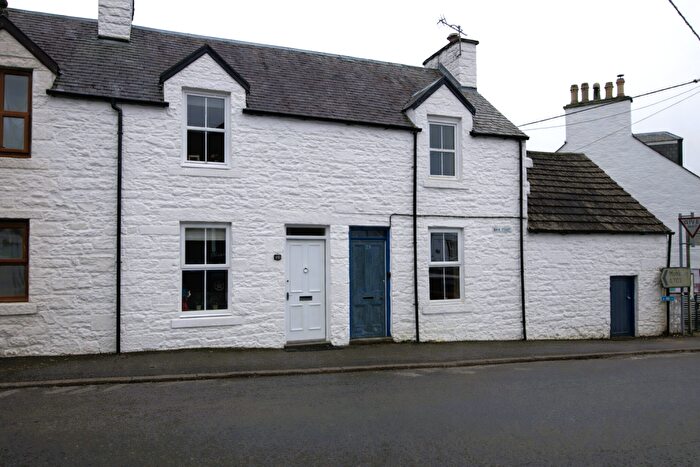
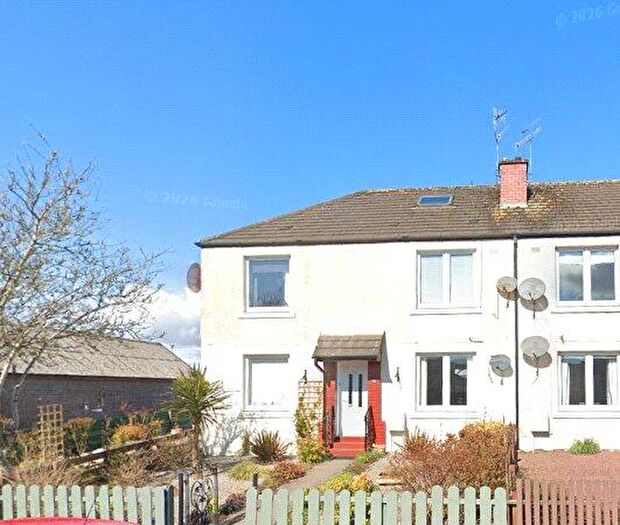
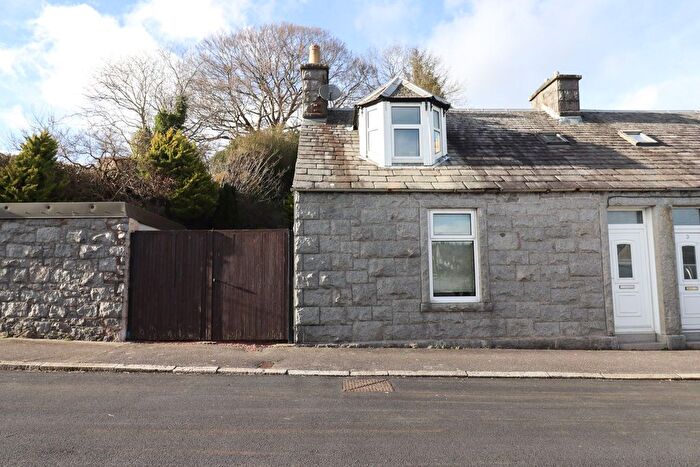
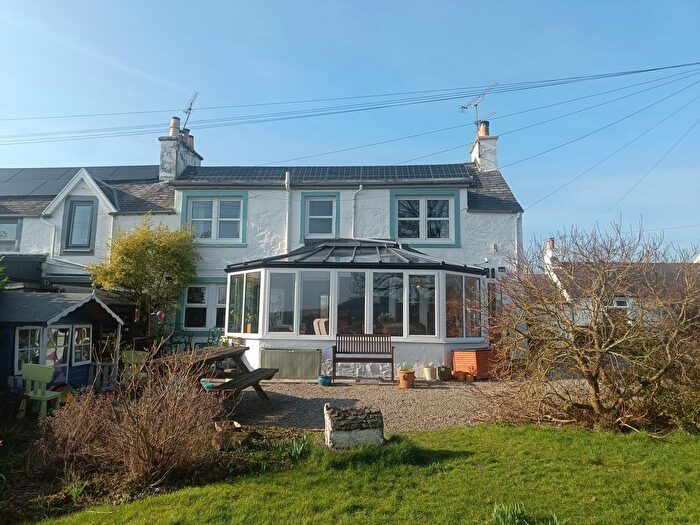
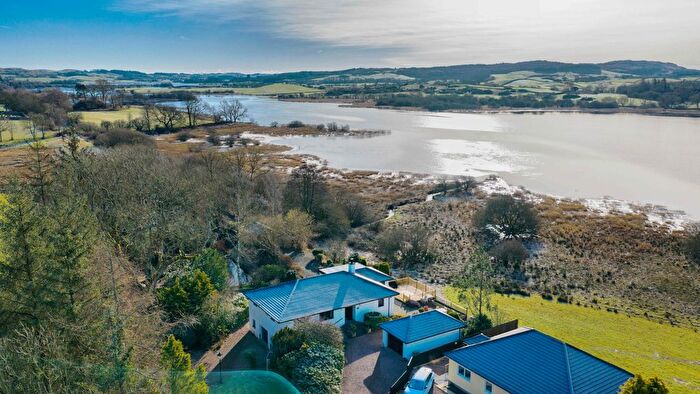
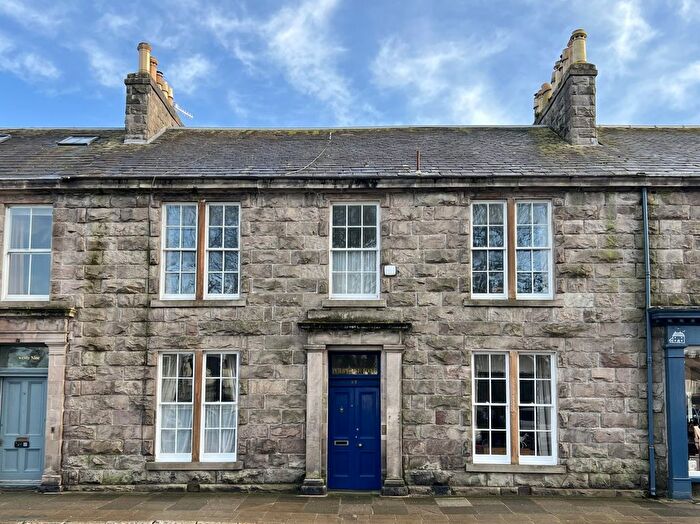
Properties for sale in Castle Douglas
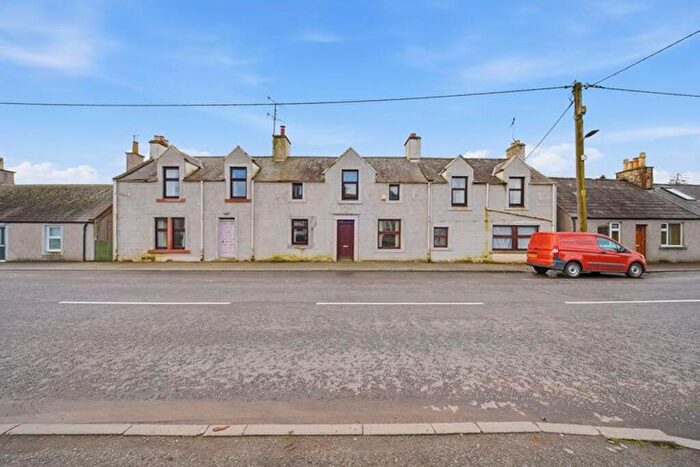
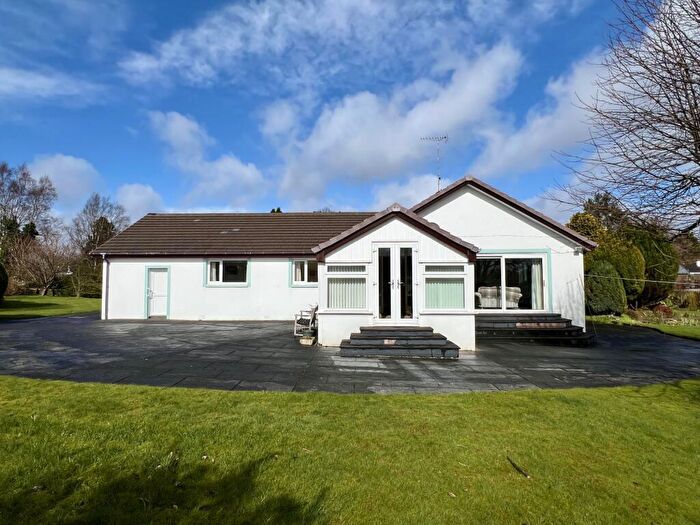
![]()
If you are looking to sell your house, let it out, or receive a property valuation, an expert can help you.
Click the button below to get started.
Neighbourhoods in Castle Douglas
Navigate through our locations to find the location of your next house in Castle Douglas, Dumfries and Galloway for sale or to rent.
Transport in Castle Douglas
Please see below transportation links in this area:
-
 Dumfries Station
 -
Maryport Station
-
Flimby Station
-
Sanquhar Station
-
Lockerbie Station
-
Workington Station
-
Kirkconnel Station
-
Annan Station
- FAQ
- Price Paid By Year
Frequently asked questions about Castle Douglas
What is the average price for a property for sale in Castle Douglas?
The average price for a property for sale in Castle Douglas is £188,655. This amount is 20% higher than the average price in Dumfries and Galloway. There are 2,056 property listings for sale in Castle Douglas.
What locations have the most expensive properties for sale in Castle Douglas?
The location with the most expensive properties for sale in Castle Douglas is Dee and Glenkens at an average of £233,547.
What locations have the most affordable properties for sale in Castle Douglas?
The location with the most affordable properties for sale in Castle Douglas is Castle Douglas and Crocketford at an average of £161,315.
Which train stations are available in or near Castle Douglas?
Some of the train stations available in or near Castle Douglas are Dumfries, Maryport and Flimby.
Property Price Paid in Castle Douglas by Year
The average sold property price by year was:
| Year | Average Sold Price | Price Change |
Sold Properties
|
|---|---|---|---|
| 2025 | £189,124 | 0,3% |
87 Properties |
| 2024 | £188,553 | 0,2% |
52 Properties |
| 2023 | £188,181 | -31% |
75 Properties |
| 2022 | £246,322 | 14% |
224 Properties |
| 2021 | £211,575 | 9% |
228 Properties |
| 2020 | £192,592 | 2% |
159 Properties |
| 2019 | £188,877 | 6% |
228 Properties |
| 2018 | £178,215 | 7% |
200 Properties |
| 2017 | £165,978 | 5% |
197 Properties |
| 2016 | £158,313 | -3% |
184 Properties |
| 2015 | £162,554 | 2% |
167 Properties |
| 2014 | £159,715 | -6% |
164 Properties |
| 2013 | £169,727 | -6% |
172 Properties |
| 2012 | £179,881 | 11% |
140 Properties |
| 2011 | £160,889 | 1% |
133 Properties |
| 2010 | £158,891 | -20% |
145 Properties |
| 2009 | £191,306 | 12% |
140 Properties |
| 2008 | £168,633 | -7% |
191 Properties |
| 2007 | £180,750 | 2% |
195 Properties |
| 2006 | £176,414 | 20% |
280 Properties |
| 2005 | £140,741 | 12% |
232 Properties |
| 2004 | £123,454 | -28% |
258 Properties |
| 2003 | £157,563 | 56% |
275 Properties |
| 2002 | £69,049 | 9% |
290 Properties |
| 2001 | £62,699 | - |
21 Properties |