
Houses for sale & to rent in Newton Stewart, Dumfries and Galloway
House Prices in Newton Stewart
Properties in Newton Stewart have an average house price of £158k and had 219 Property Transactions within the last 3 years.¹
Newton Stewart is an area in Dumfries and Galloway with 5,923 households², where the most expensive property was sold for £600k.
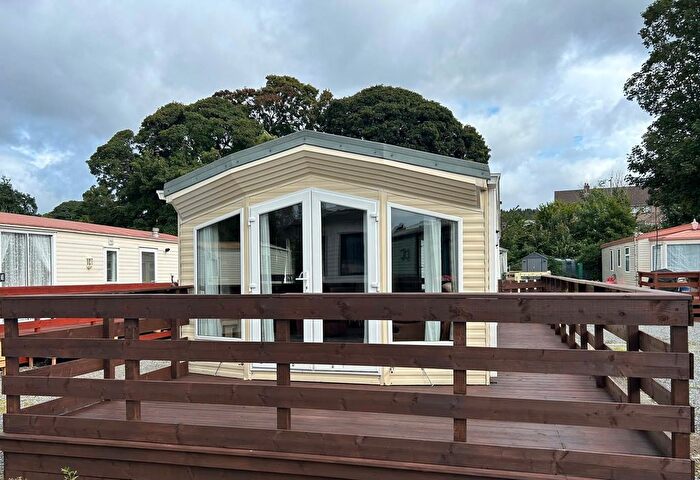
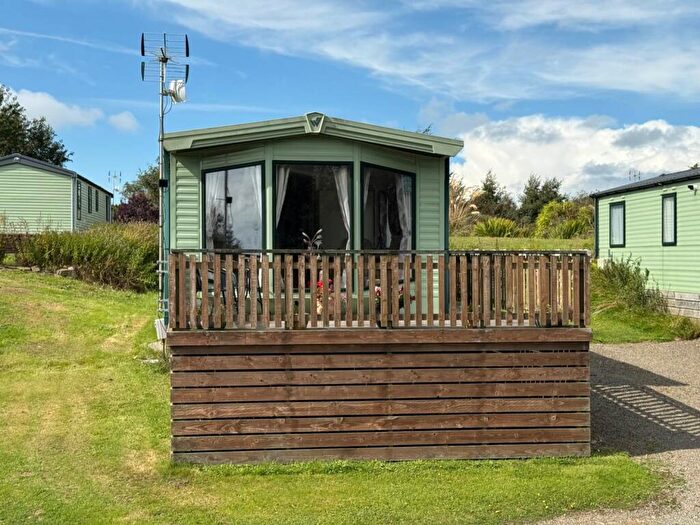
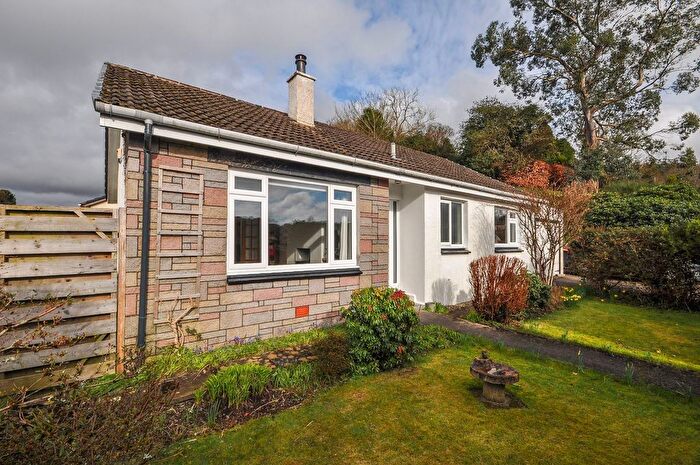
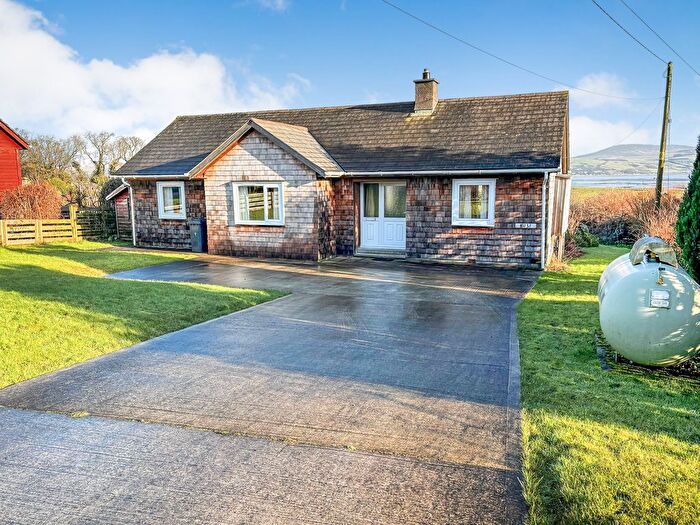
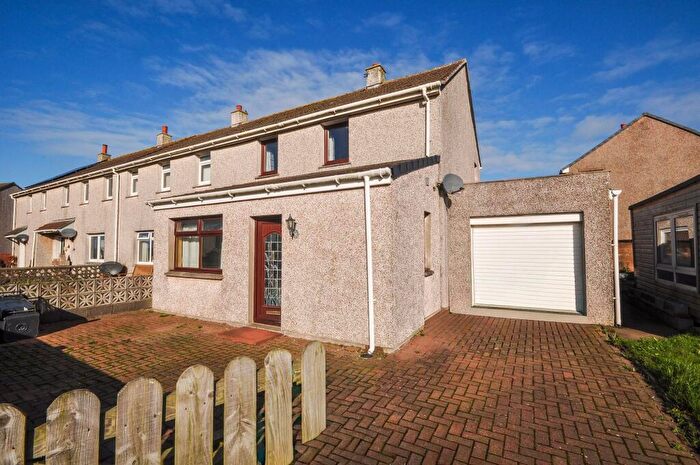
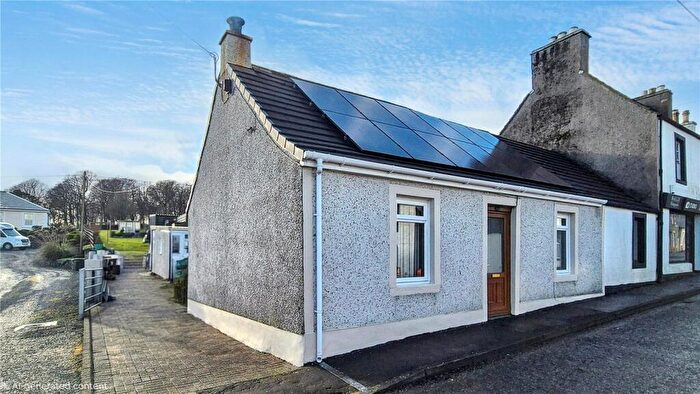
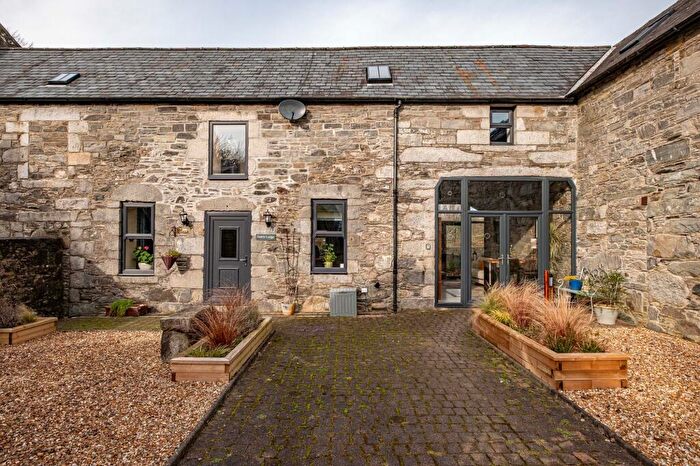
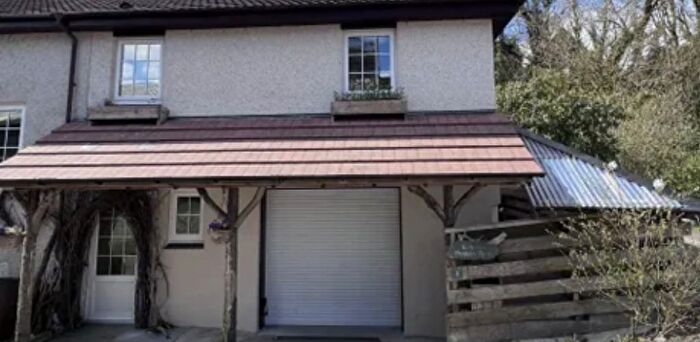
Properties for sale in Newton Stewart
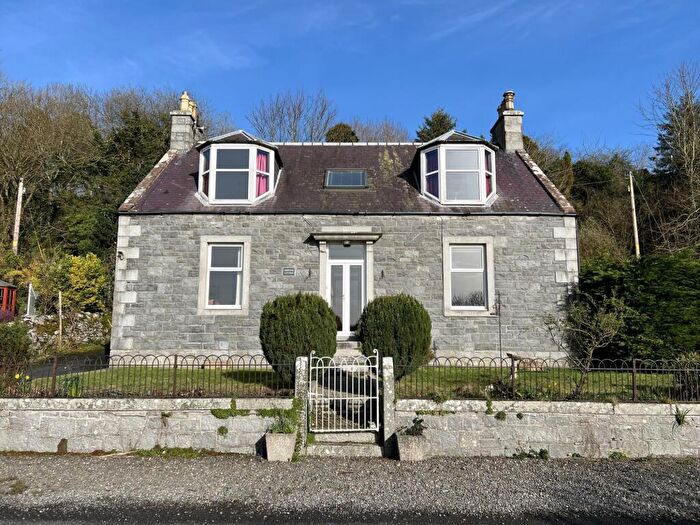


![]()
If you are looking to sell your house, let it out, or receive a property valuation, an expert can help you.
Click the button below to get started.


Neighbourhoods in Newton Stewart
Navigate through our locations to find the location of your next house in Newton Stewart, Dumfries and Galloway for sale or to rent.
Transport in Newton Stewart
Please see below transportation links in this area:

- FAQ
- Price Paid By Year
Frequently asked questions about Newton Stewart
What is the average price for a property for sale in Newton Stewart?
The average price for a property for sale in Newton Stewart is £158,485. This amount is 1% higher than the average price in Dumfries and Galloway. There are 1,846 property listings for sale in Newton Stewart.
Which train stations are available in or near Newton Stewart?
Some of the train stations available in or near Newton Stewart are Barrhill, Stranraer and Girvan.
Property Price Paid in Newton Stewart by Year
The average sold property price by year was:
| Year | Average Sold Price | Price Change |
Sold Properties
|
|---|---|---|---|
| 2025 | £171,606 | 13% |
65 Properties |
| 2024 | £149,905 | -3% |
60 Properties |
| 2023 | £154,888 | -17% |
94 Properties |
| 2022 | £181,320 | 14% |
252 Properties |
| 2021 | £155,154 | 19% |
323 Properties |
| 2020 | £125,434 | -1% |
206 Properties |
| 2019 | £127,043 | -3% |
211 Properties |
| 2018 | £131,038 | 5% |
245 Properties |
| 2017 | £124,217 | 5% |
241 Properties |
| 2016 | £117,683 | 4% |
194 Properties |
| 2015 | £113,213 | 5% |
217 Properties |
| 2014 | £107,684 | 2% |
161 Properties |
| 2013 | £105,208 | -4% |
177 Properties |
| 2012 | £109,119 | -16% |
136 Properties |
| 2011 | £127,010 | -8% |
127 Properties |
| 2010 | £136,620 | 1% |
171 Properties |
| 2009 | £134,758 | -12% |
173 Properties |
| 2008 | £151,401 | 19% |
203 Properties |
| 2007 | £122,675 | 12% |
244 Properties |
| 2006 | £108,529 | -9% |
268 Properties |
| 2005 | £118,177 | 24% |
328 Properties |
| 2004 | £90,293 | 20% |
326 Properties |
| 2003 | £72,108 | 9% |
374 Properties |
| 2002 | £65,761 | -12% |
399 Properties |
| 2001 | £73,550 | - |
43 Properties |