Houses for sale & to rent in Mid Galloway and Wigtown West, Newton Stewart
House Prices in Mid Galloway and Wigtown West
Properties in Mid Galloway and Wigtown West have an average house price of £178,440.00 and had 292 Property Transactions within the last 3 years¹.
Mid Galloway and Wigtown West is an area in Newton Stewart, Dumfries and Galloway with 5,923 households², where the most expensive property was sold for £995,000.00.
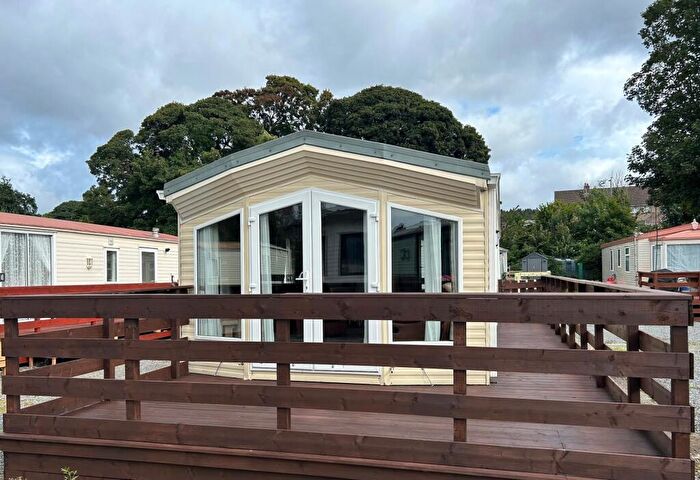
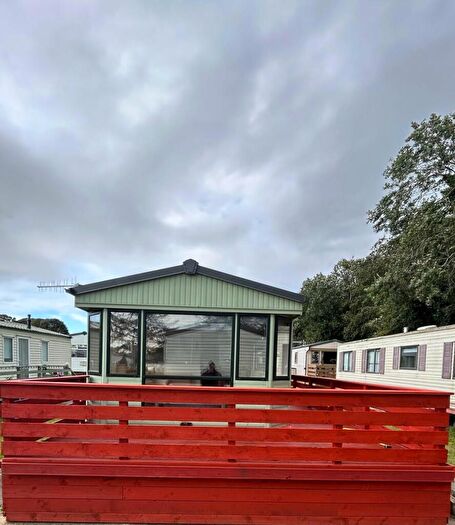
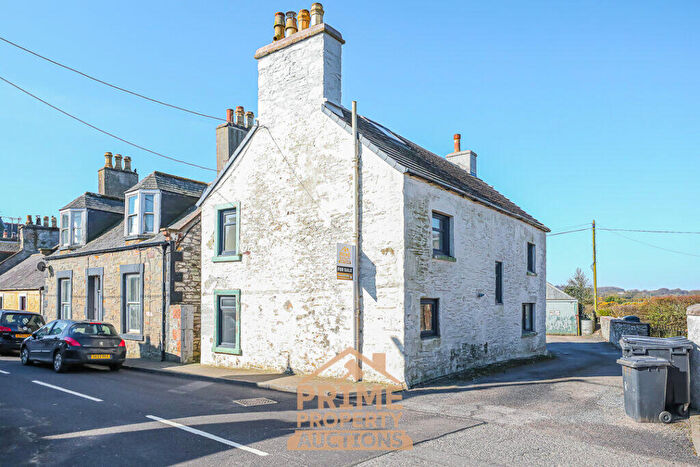
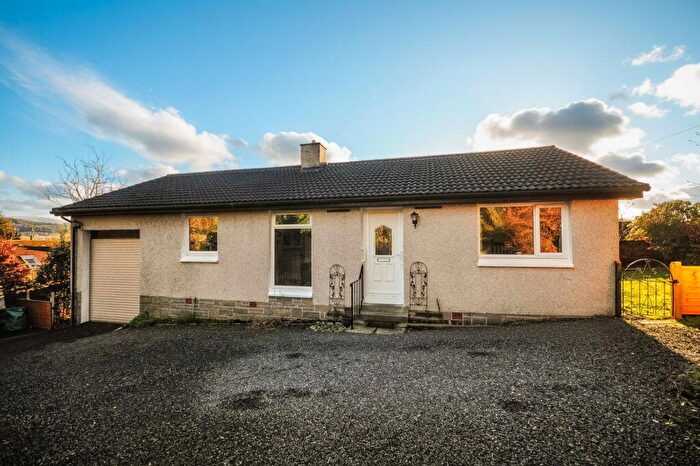
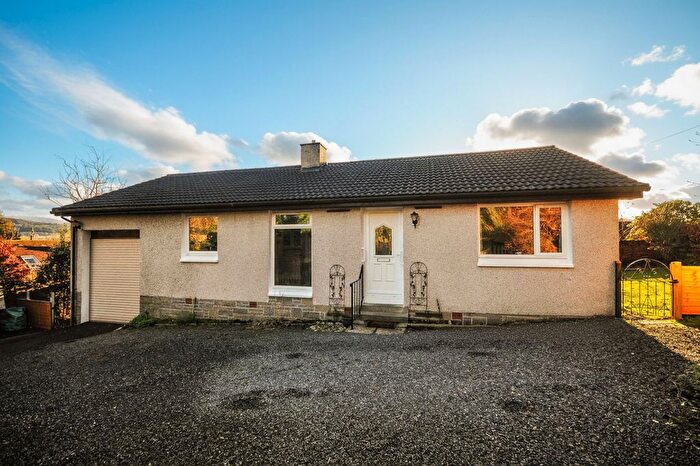
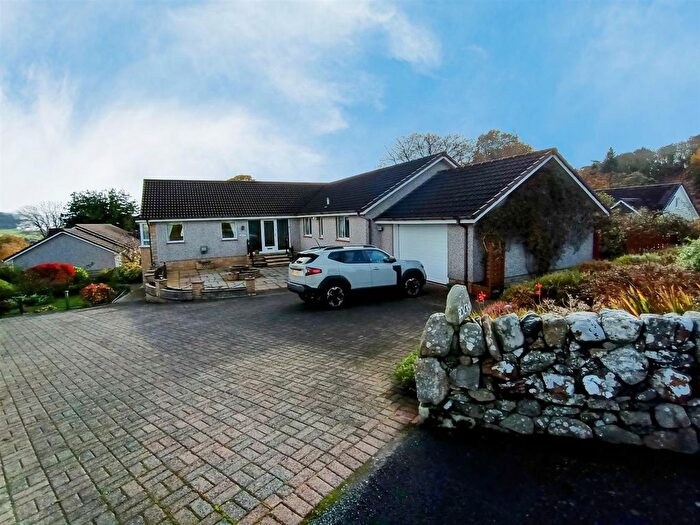
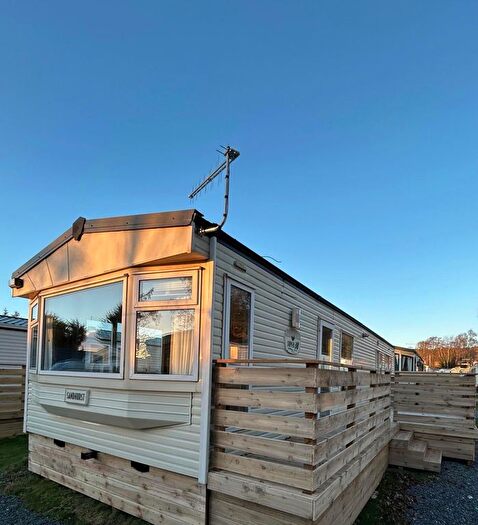
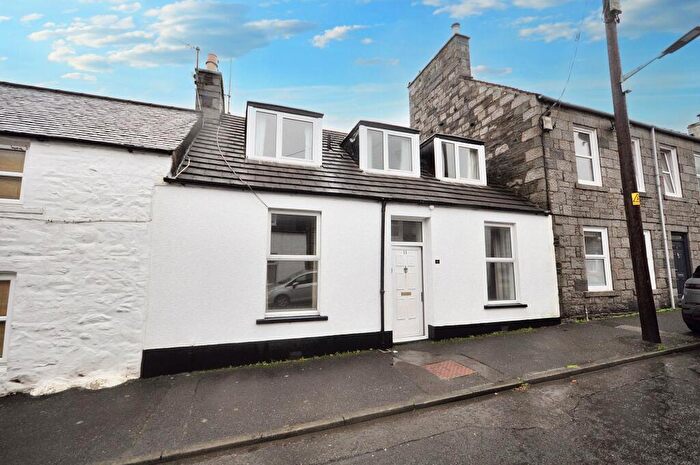
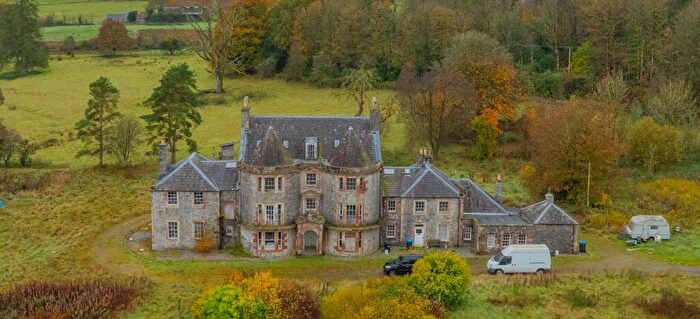
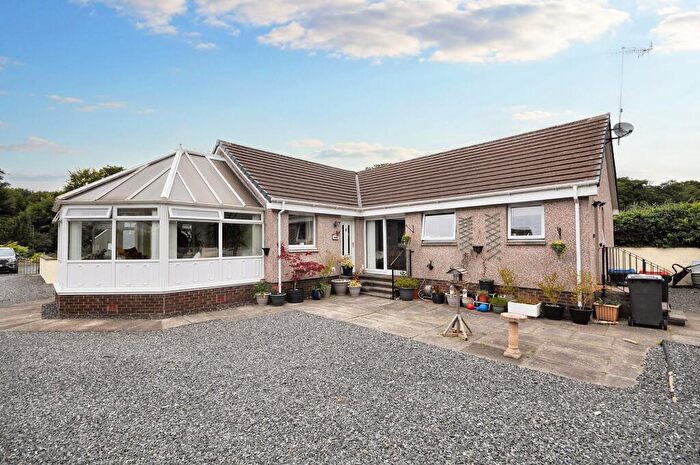
Properties for sale in Mid Galloway and Wigtown West
Roads and Postcodes in Mid Galloway and Wigtown West
Navigate through our locations to find the location of your next house in Mid Galloway and Wigtown West, Newton Stewart for sale or to rent.
Transport near Mid Galloway and Wigtown West
- FAQ
- Price Paid By Year
Frequently asked questions about Mid Galloway and Wigtown West
What is the average price for a property for sale in Mid Galloway and Wigtown West?
The average price for a property for sale in Mid Galloway and Wigtown West is £178,440. There are 1,744 property listings for sale in Mid Galloway and Wigtown West.
Which train stations are available in or near Mid Galloway and Wigtown West?
Some of the train stations available in or near Mid Galloway and Wigtown West are Barrhill, Stranraer and Girvan.
Property Price Paid in Mid Galloway and Wigtown West by Year
The average sold property price by year was:
| Year | Average Sold Price | Price Change |
Sold Properties
|
|---|---|---|---|
| 2023 | £170,190 | -6% |
45 Properties |
| 2022 | £179,943 | 13% |
247 Properties |
| 2021 | £155,653 | 20% |
310 Properties |
| 2020 | £123,943 | -3% |
203 Properties |
| 2019 | £127,449 | -3% |
202 Properties |
| 2018 | £130,869 | 6% |
237 Properties |
| 2017 | £123,415 | 4% |
232 Properties |
| 2016 | £118,010 | 3% |
187 Properties |
| 2015 | £114,286 | 5% |
206 Properties |
| 2014 | £108,766 | 4% |
153 Properties |
| 2013 | £104,746 | -4% |
174 Properties |
| 2012 | £109,404 | -15% |
134 Properties |
| 2011 | £125,407 | -9% |
121 Properties |
| 2010 | £136,235 | 1% |
163 Properties |
| 2009 | £134,569 | -12% |
169 Properties |
| 2008 | £150,849 | 17% |
193 Properties |
| 2007 | £125,182 | 14% |
213 Properties |
| 2006 | £107,926 | -9% |
256 Properties |
| 2005 | £117,784 | 23% |
323 Properties |
| 2004 | £90,948 | 21% |
316 Properties |
| 2003 | £71,556 | 8% |
367 Properties |
| 2002 | £65,953 | -12% |
392 Properties |
| 2001 | £74,111 | - |
42 Properties |

