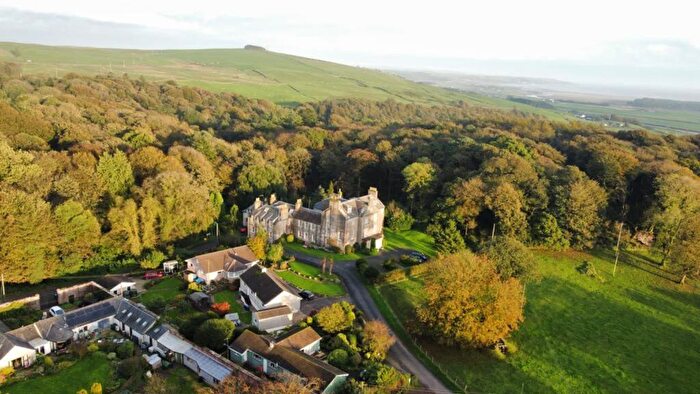
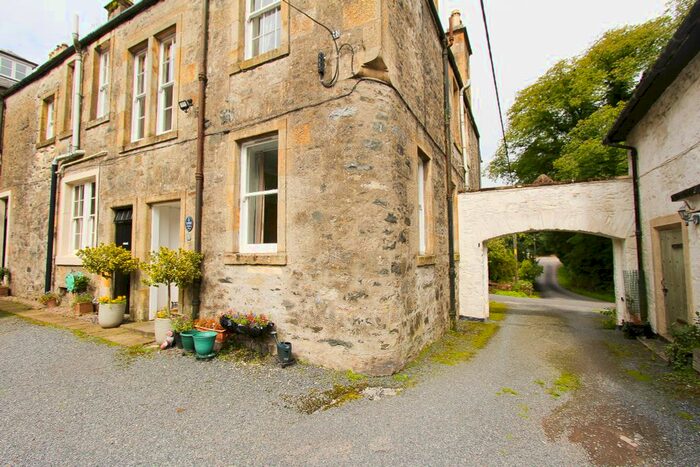
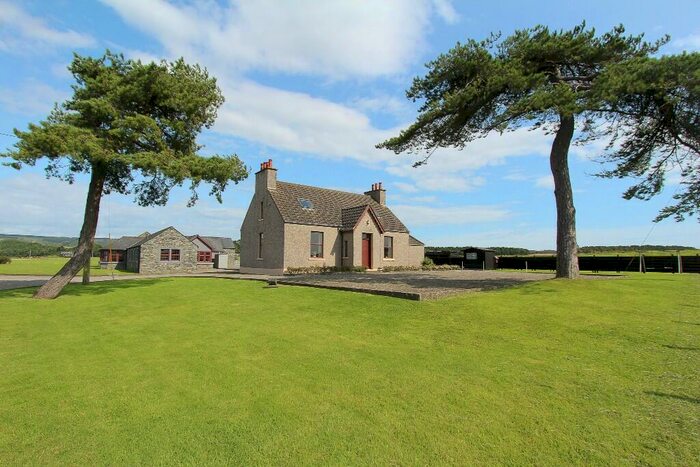
Houses for sale & to rent in Mid Galloway and Wigtown West, Stranraer
House Prices in Mid Galloway and Wigtown West
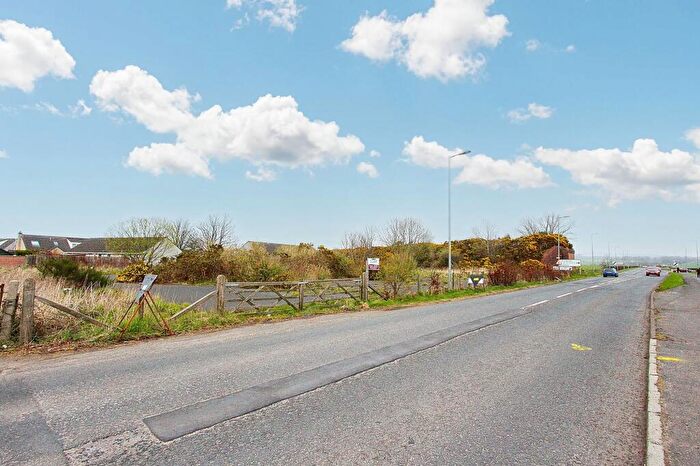
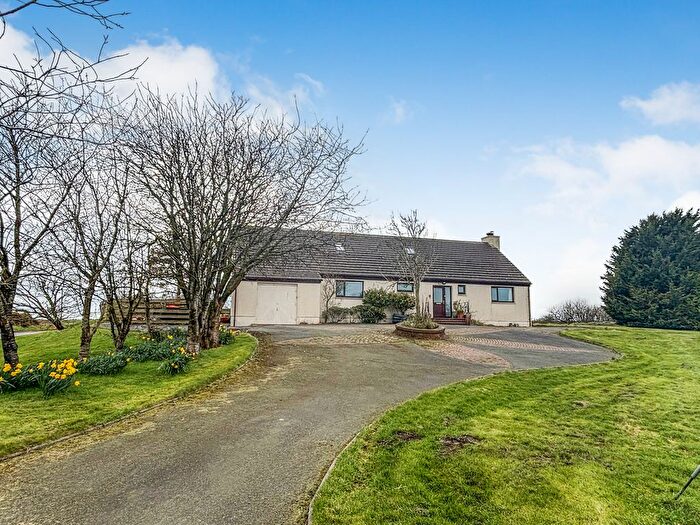
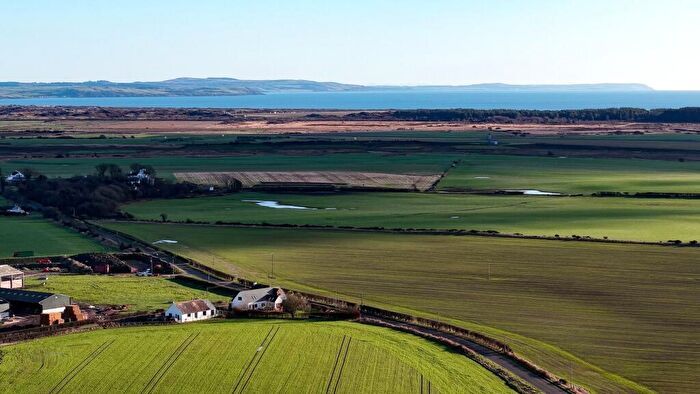
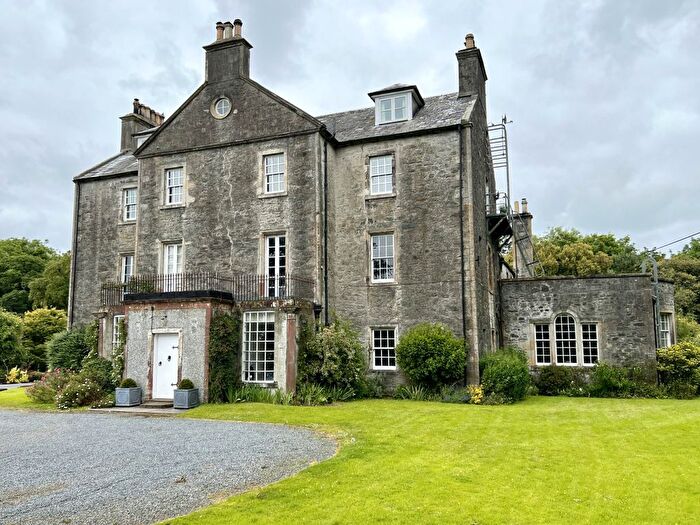
Properties in Mid Galloway and Wigtown West have an average house price of £151,087.00 and had 18 Property Transactions within the last 3 years¹.
Mid Galloway and Wigtown West is an area in Stranraer, Dumfries and Galloway with 378 households², where the most expensive property was sold for £530,000.00.
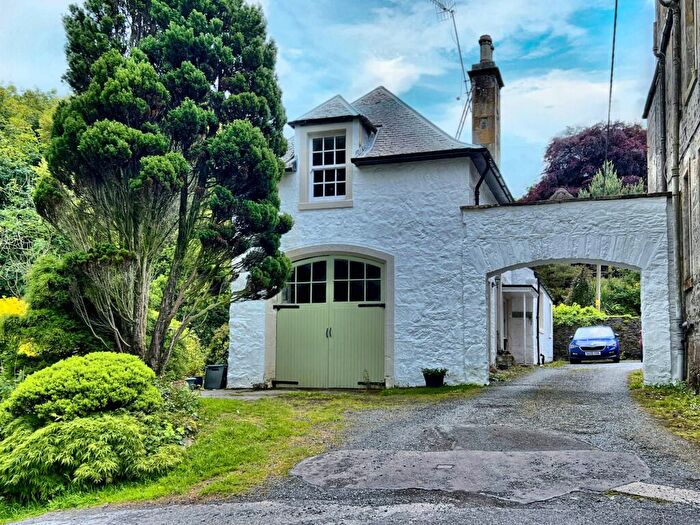
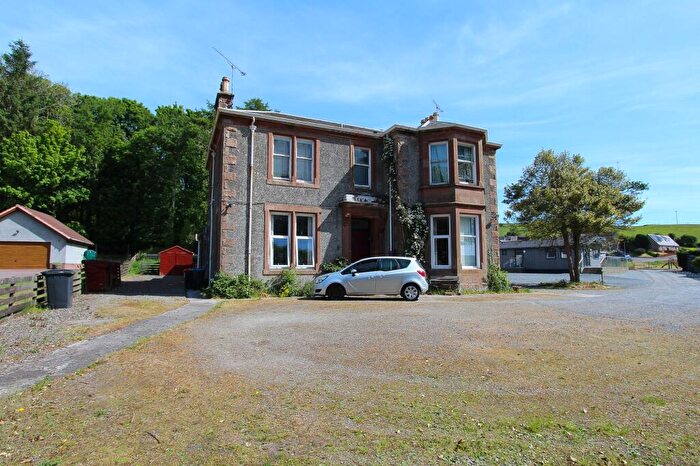
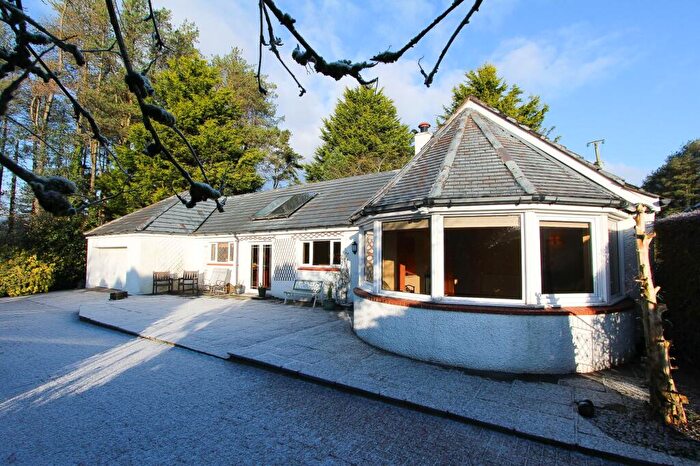
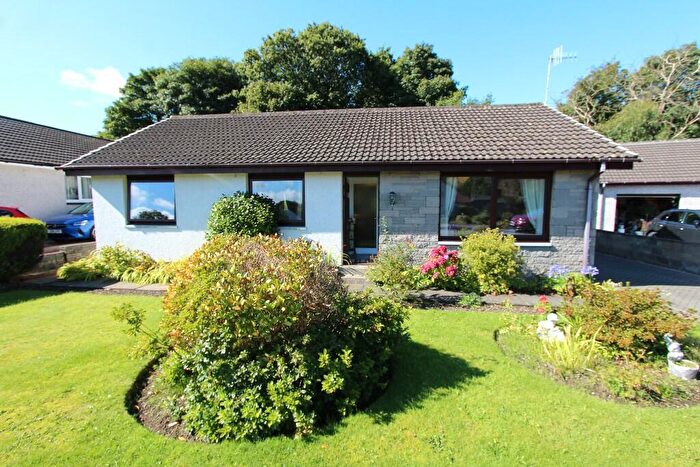
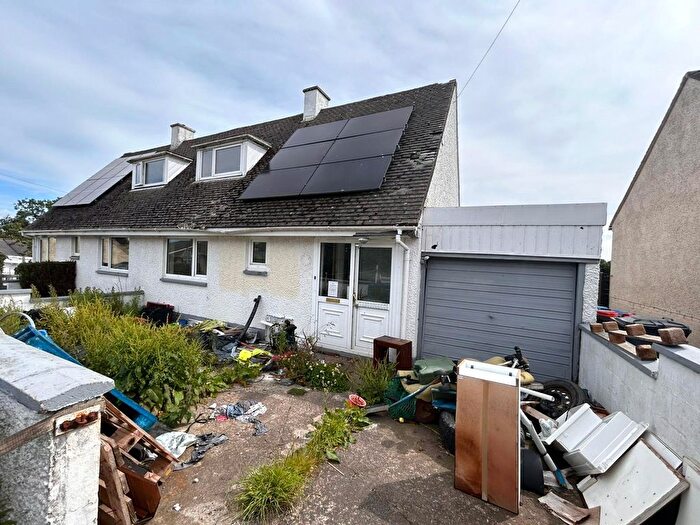
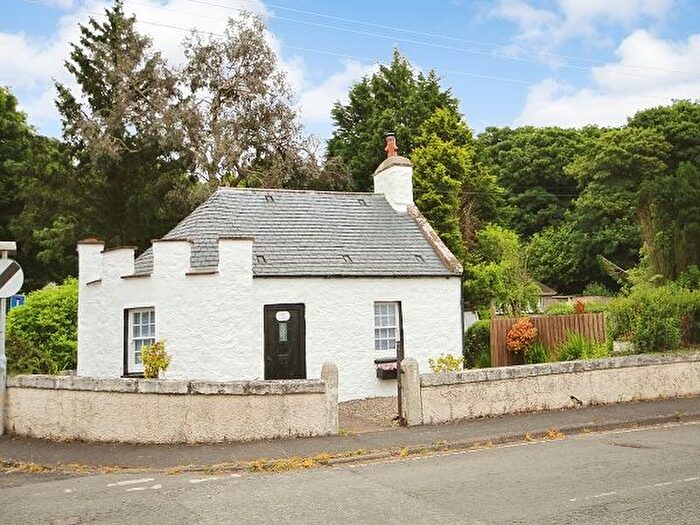
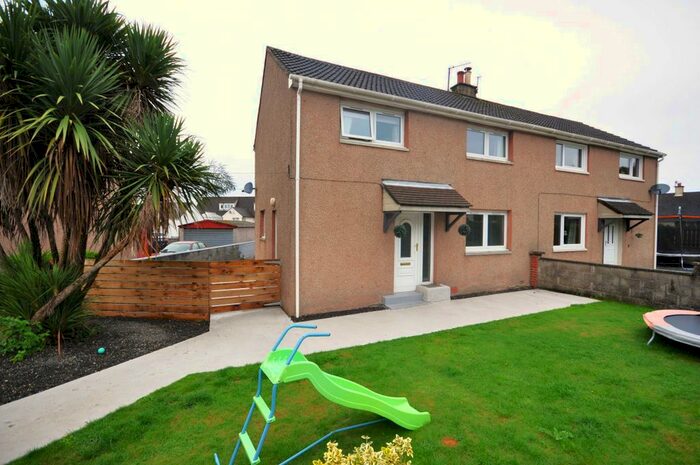
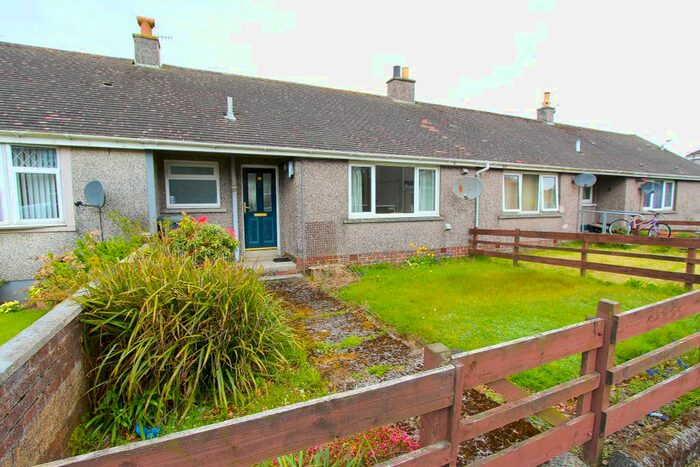
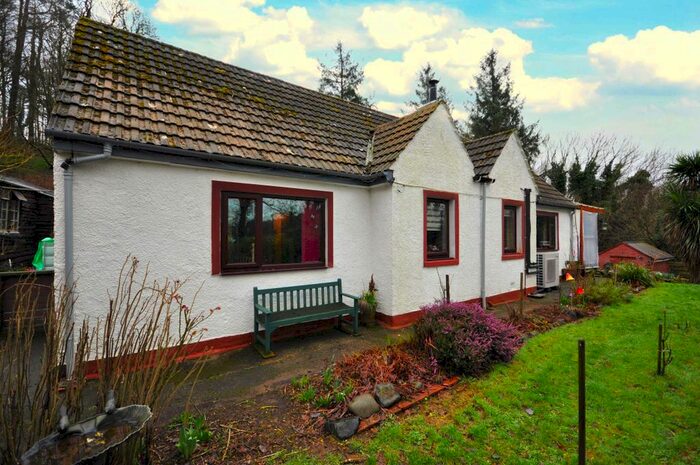
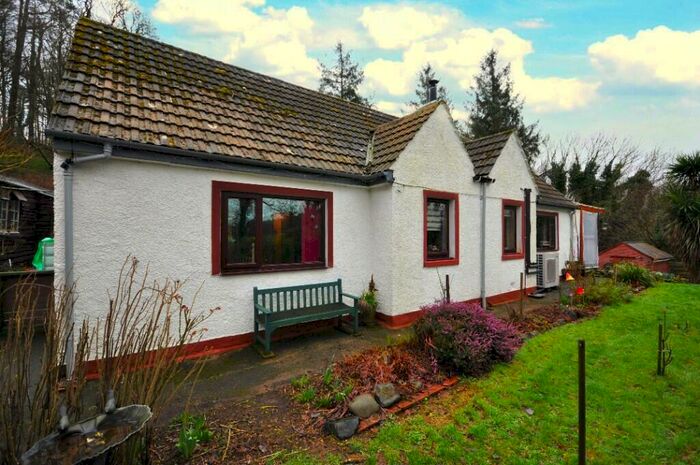
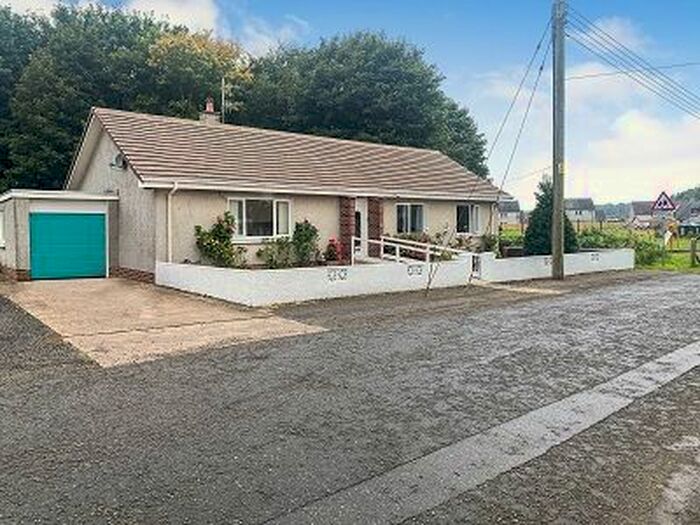
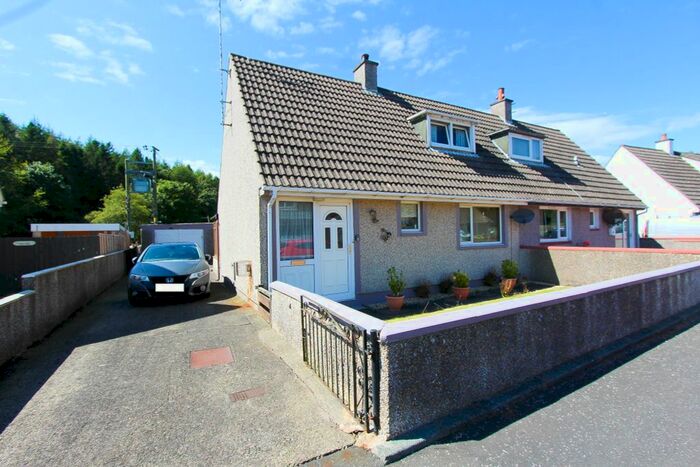
Properties for sale in Mid Galloway and Wigtown West
Previously listed properties in Mid Galloway and Wigtown West
Roads and Postcodes in Mid Galloway and Wigtown West
Navigate through our locations to find the location of your next house in Mid Galloway and Wigtown West, Stranraer for sale or to rent.
| Streets | Postcodes |
|---|---|
| Aird Crescent | DG9 8SA |
| Broadwood Road | DG9 8SB |
| Castle Kennedy Industrial Estate | DG9 8SG DG9 8SH |
| Douglas Road | DG9 8SD |
| Dounan Road | DG9 8PR |
| Hamilton Road | DG9 8SF |
| Lochinch Crescent | DG9 8SW |
| Macgill Road | DG9 8SE |
| Magillie Drive | DG9 8SR |
| Millglen Road | DG9 8PS |
| Orchard Road | DG9 8PP |
| Park Road | DG9 8PT |
| Whitepark View | DG9 8SP |
| DG9 8NB DG9 8NL DG9 8NR DG9 8NW DG9 8NX DG9 8NY DG9 8NZ DG9 8PA DG9 8PB DG9 8PD DG9 8PF DG9 8PG DG9 8PH DG9 8PJ DG9 8PL DG9 8PQ DG9 8PW DG9 8PX DG9 8PY DG9 8PZ DG9 8QA DG9 8QB DG9 8RQ DG9 8RS DG9 8RT DG9 8RU DG9 8RX DG9 8RY DG9 8SJ DG9 8SL DG9 8SN DG9 8SQ DG9 9ES |
Transport near Mid Galloway and Wigtown West
- FAQ
- Price Paid By Year
Frequently asked questions about Mid Galloway and Wigtown West
What is the average price for a property for sale in Mid Galloway and Wigtown West?
The average price for a property for sale in Mid Galloway and Wigtown West is £151,087. This amount is 0.24% higher than the average price in Stranraer. There are 68 property listings for sale in Mid Galloway and Wigtown West.
Which train stations are available in or near Mid Galloway and Wigtown West?
Some of the train stations available in or near Mid Galloway and Wigtown West are Stranraer, Barrhill and Girvan.
Property Price Paid in Mid Galloway and Wigtown West by Year
The average sold property price by year was:
| Year | Average Sold Price | Price Change |
Sold Properties
|
|---|---|---|---|
| 2023 | £115,000 | -33% |
1 Property |
| 2022 | £153,210 | -29% |
17 Properties |
| 2021 | £198,000 | 44% |
12 Properties |
| 2020 | £111,750 | 14% |
10 Properties |
| 2019 | £96,045 | 4% |
11 Properties |
| 2018 | £92,607 | -10% |
6 Properties |
| 2017 | £102,200 | 38% |
12 Properties |
| 2016 | £63,520 | -52% |
5 Properties |
| 2015 | £96,550 | -57% |
10 Properties |
| 2014 | £151,963 | 7% |
14 Properties |
| 2013 | £141,778 | 27% |
7 Properties |
| 2012 | £103,864 | -42% |
7 Properties |
| 2011 | £147,678 | 2% |
7 Properties |
| 2010 | £144,171 | 46% |
7 Properties |
| 2009 | £78,500 | -85% |
6 Properties |
| 2008 | £145,535 | 31% |
7 Properties |
| 2007 | £100,646 | 19% |
11 Properties |
| 2006 | £81,418 | -26% |
22 Properties |
| 2005 | £102,290 | 47% |
17 Properties |
| 2004 | £54,143 | -39% |
16 Properties |
| 2003 | £75,288 | 56% |
19 Properties |
| 2002 | £33,038 | 40% |
20 Properties |
| 2001 | £19,987 | - |
1 Property |

