
Houses for sale & to rent in Maryfield, Dundee
House Prices in Maryfield
Properties in Maryfield have an average house price of £153k and had 477 Property Transactions within the last 3 years¹.
Maryfield is an area in Dundee, Dundee City with 8,688 households², where the most expensive property was sold for £449k.
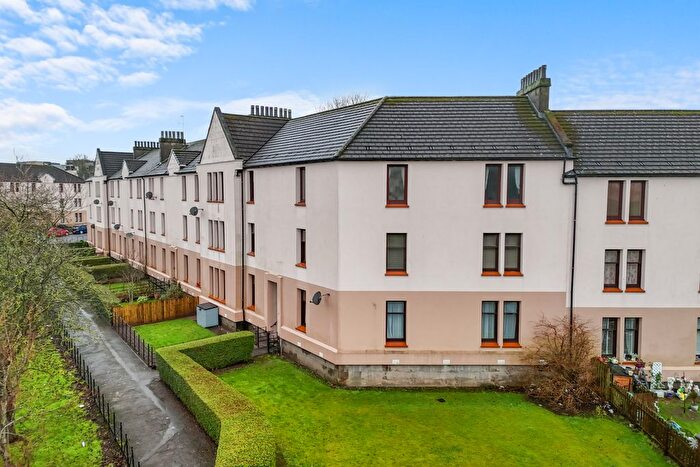
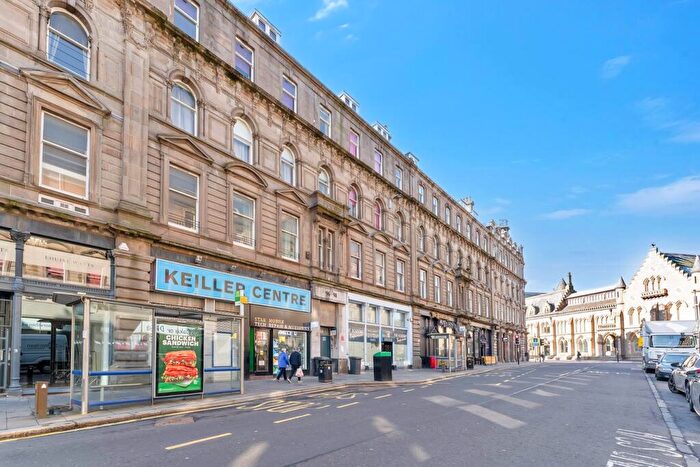
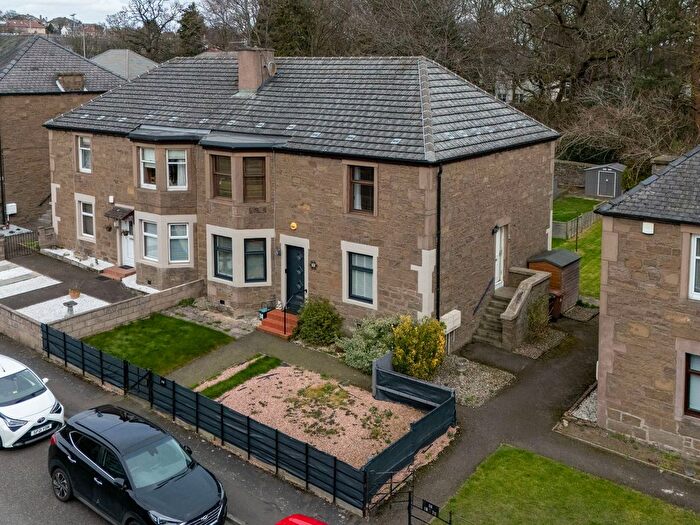
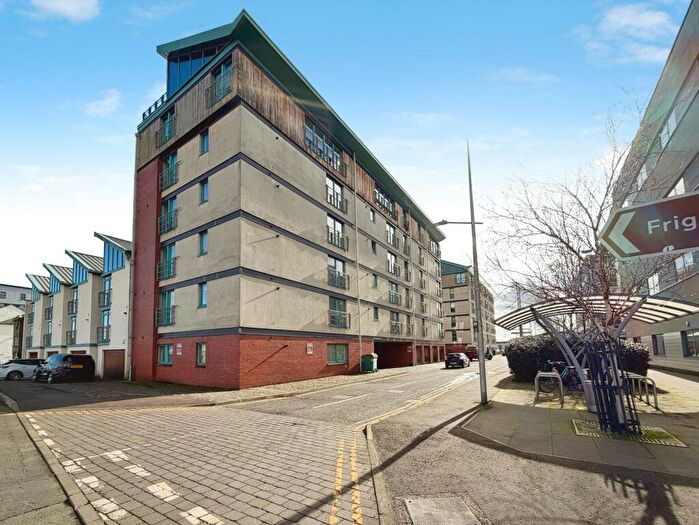
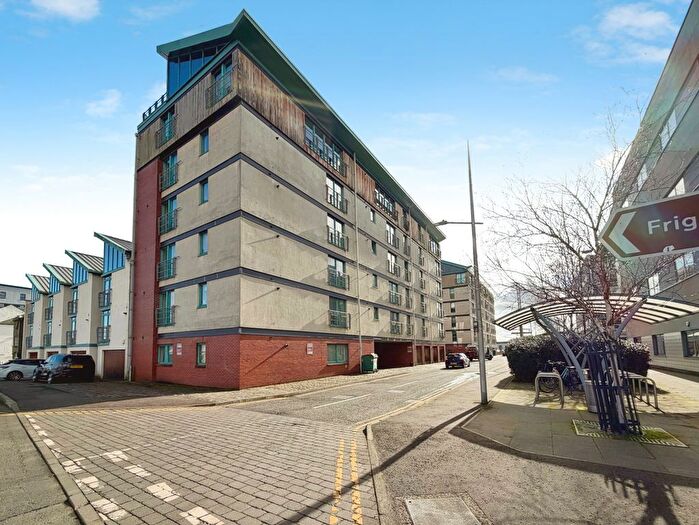
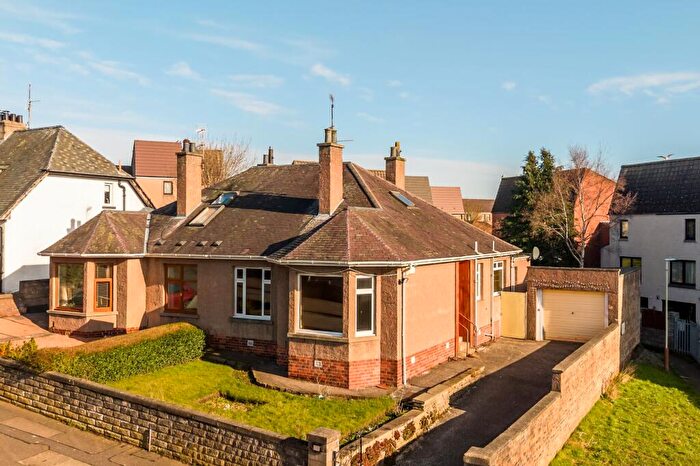
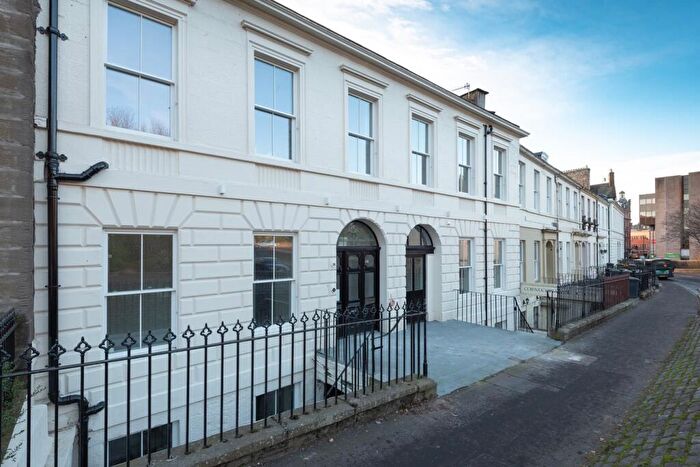
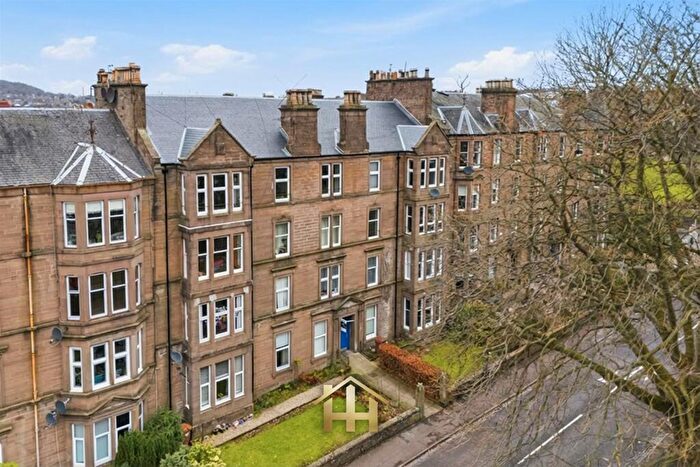
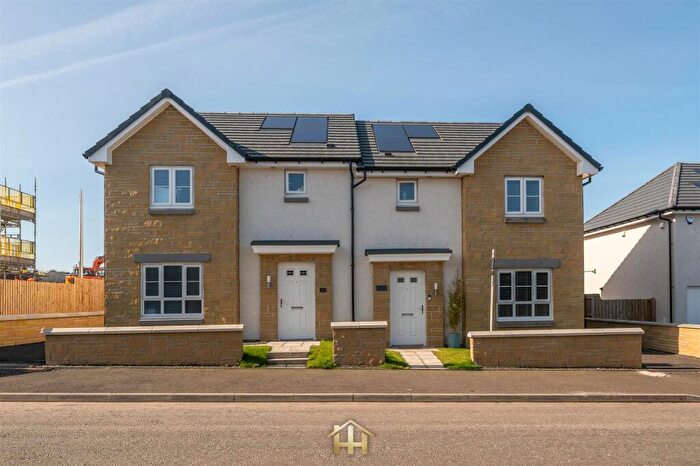
Properties for sale in Maryfield

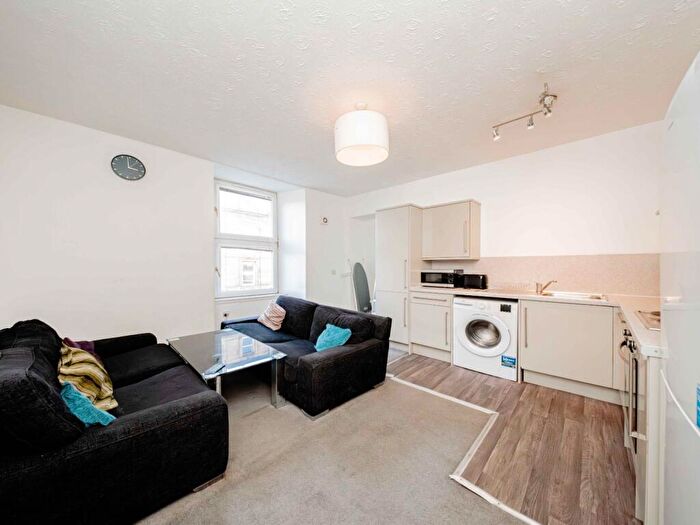
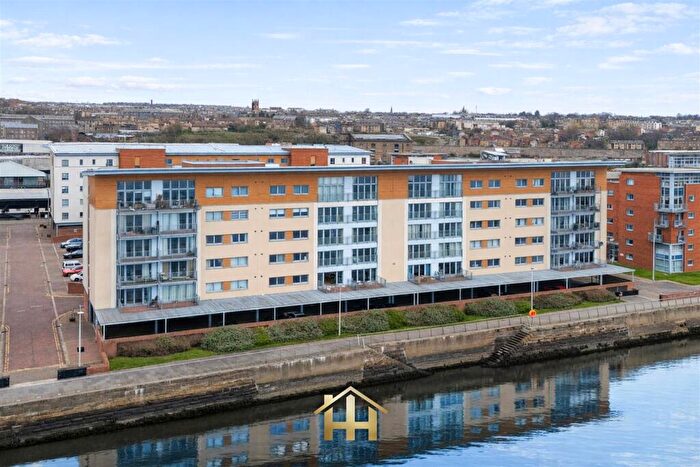
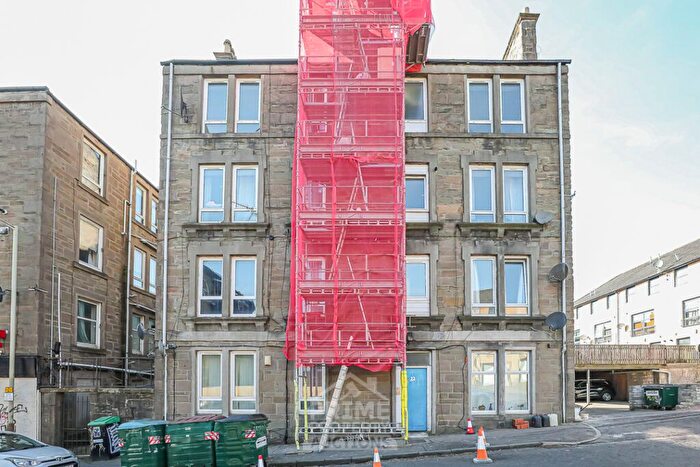

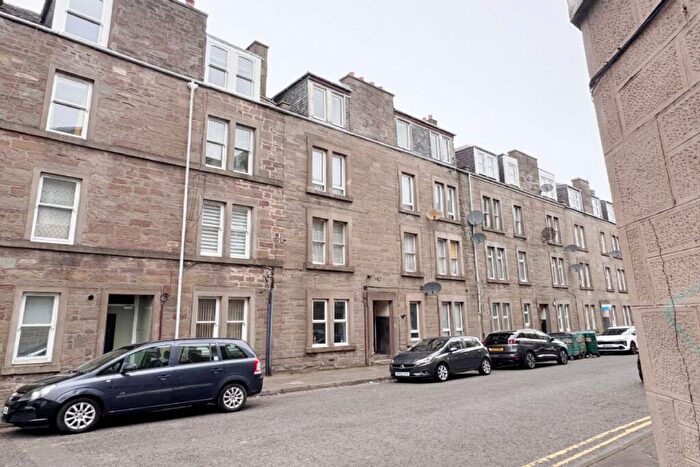
![]()
If you are looking to sell your house, let it out, or receive a property valuation, an expert can help you.
Click the button below to get started.


Roads and Postcodes in Maryfield
Navigate through our locations to find the location of your next house in Maryfield, Dundee for sale or to rent.
Transport near Maryfield

- FAQ
- Price Paid By Year
Frequently asked questions about Maryfield
What is the average price for a property for sale in Maryfield?
The average price for a property for sale in Maryfield is £153,013. This amount is 9% lower than the average price in Dundee. There are 1,159 property listings for sale in Maryfield.
What streets have the most expensive properties for sale in Maryfield?
The streets with the most expensive properties for sale in Maryfield are Duff Street at an average of £348,000, Shamrock Street at an average of £337,500 and Bingham Terrace at an average of £334,440.
What streets have the most affordable properties for sale in Maryfield?
The streets with the most affordable properties for sale in Maryfield are Dundonald Street at an average of £22,000, Balmore Street at an average of £39,995 and Mcgill Street at an average of £55,250.
Which train stations are available in or near Maryfield?
Some of the train stations available in or near Maryfield are Dundee, Broughty Ferry and Invergowrie.
Property Price Paid in Maryfield by Year
The average sold property price by year was:
| Year | Average Sold Price | Price Change |
Sold Properties
|
|---|---|---|---|
| 2025 | £155,130 | -3% |
130 Properties |
| 2024 | £160,462 | 9% |
148 Properties |
| 2023 | £146,090 | 13% |
199 Properties |
| 2022 | £127,105 | 1% |
453 Properties |
| 2021 | £125,621 | 3% |
461 Properties |
| 2020 | £121,759 | 5% |
318 Properties |
| 2019 | £115,581 | 3% |
340 Properties |
| 2018 | £112,670 | 5% |
425 Properties |
| 2017 | £107,248 | -13% |
376 Properties |
| 2016 | £121,591 | 12% |
410 Properties |
| 2015 | £106,715 | -7% |
386 Properties |
| 2014 | £114,332 | 5% |
313 Properties |
| 2013 | £108,128 | 8% |
380 Properties |
| 2012 | £99,140 | -5% |
285 Properties |
| 2011 | £104,396 | -4% |
228 Properties |
| 2010 | £109,071 | -7% |
298 Properties |
| 2009 | £117,183 | -5% |
341 Properties |
| 2008 | £122,941 | -6% |
540 Properties |
| 2007 | £130,756 | 13% |
567 Properties |
| 2006 | £113,198 | -1617,2% |
674 Properties |
| 2005 | £1,943,881 | 96% |
652 Properties |
| 2004 | £84,018 | 18% |
729 Properties |
| 2003 | £68,822 | -4% |
671 Properties |
| 2002 | £71,451 | 17% |
623 Properties |
| 2001 | £59,294 | - |
35 Properties |