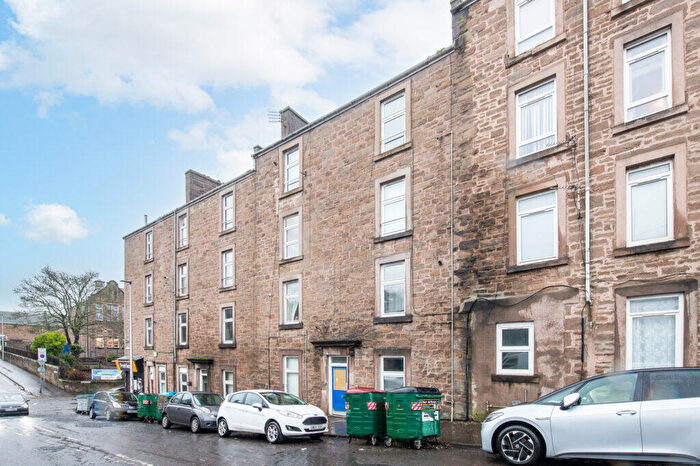
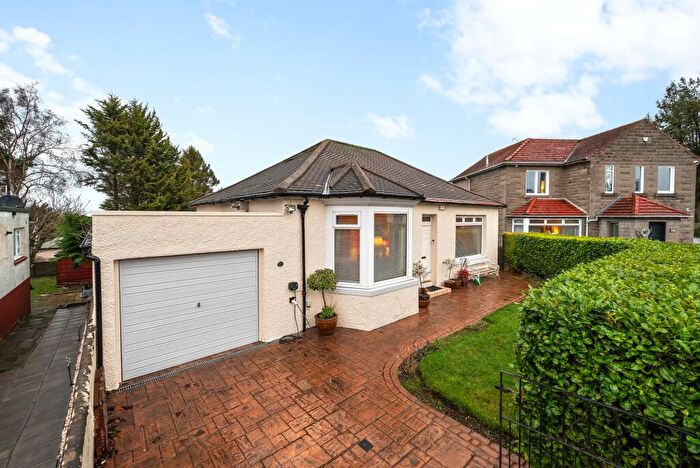
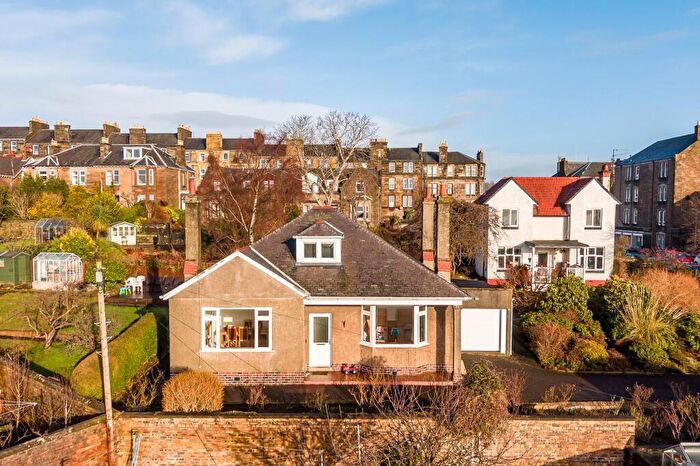
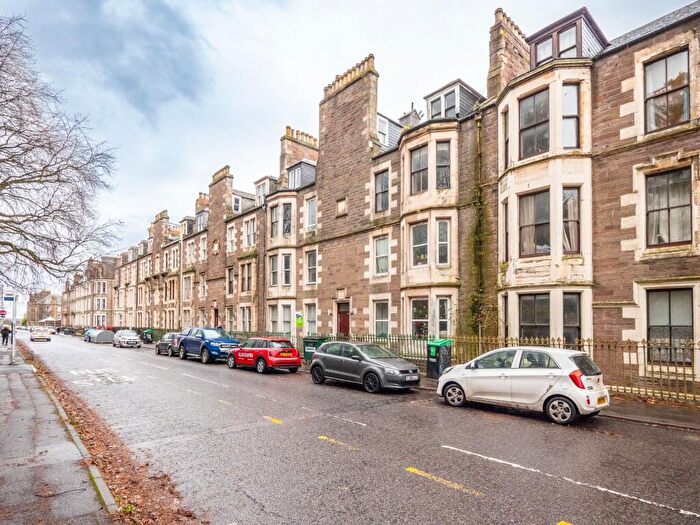
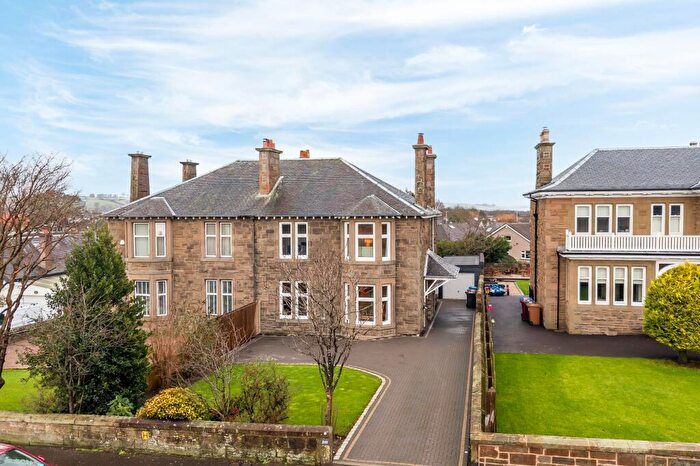
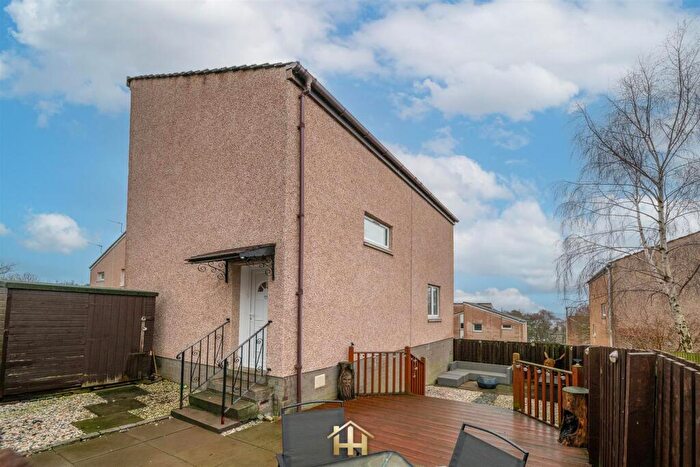
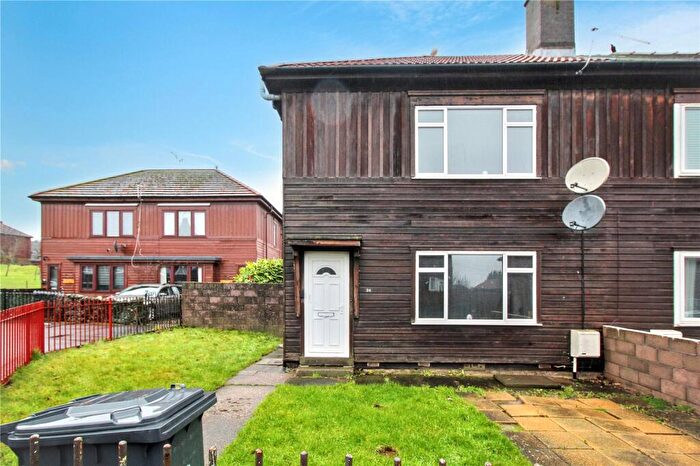
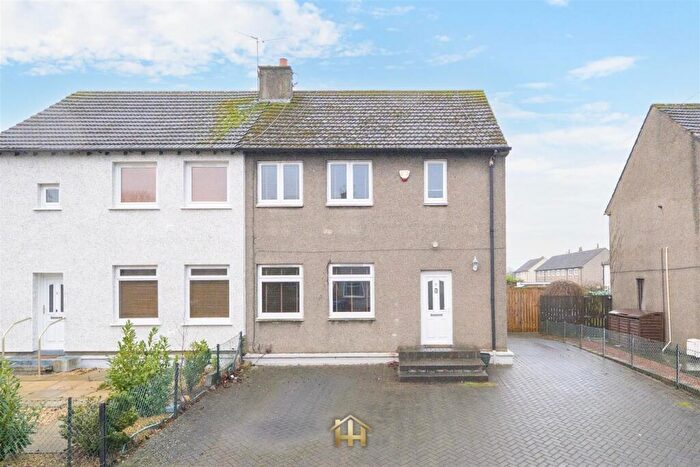
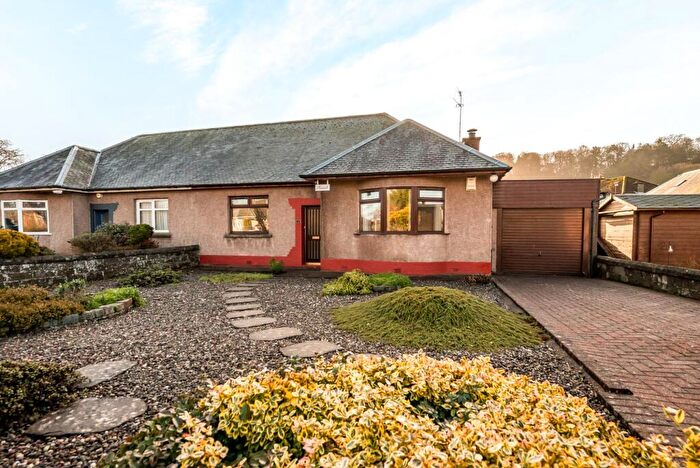
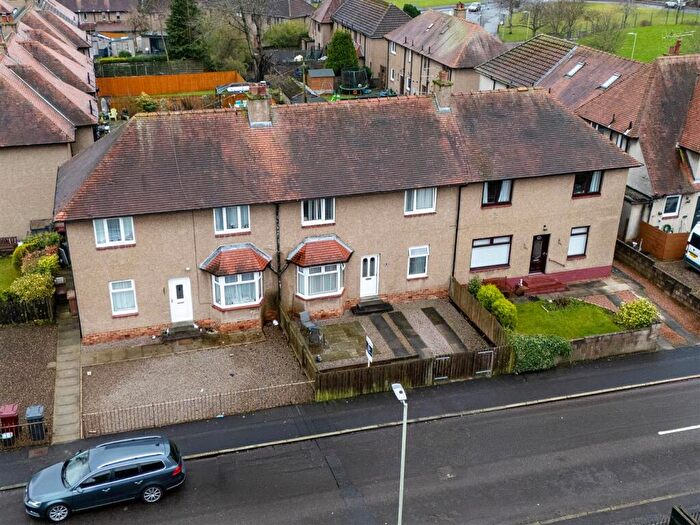
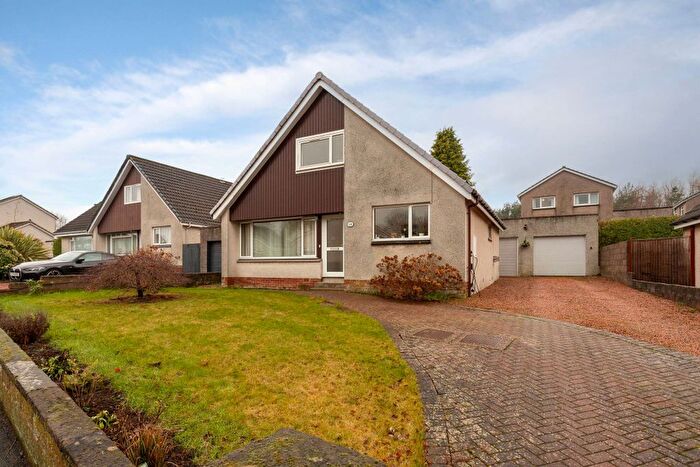
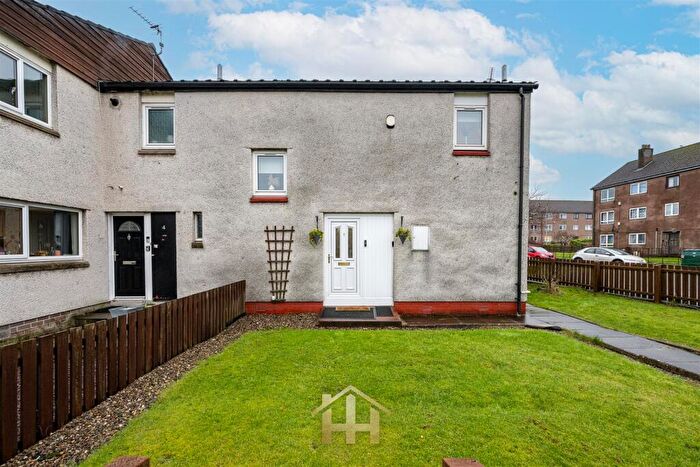
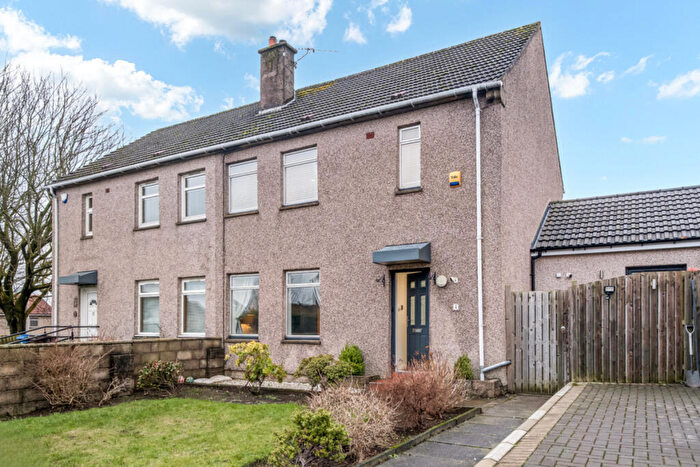
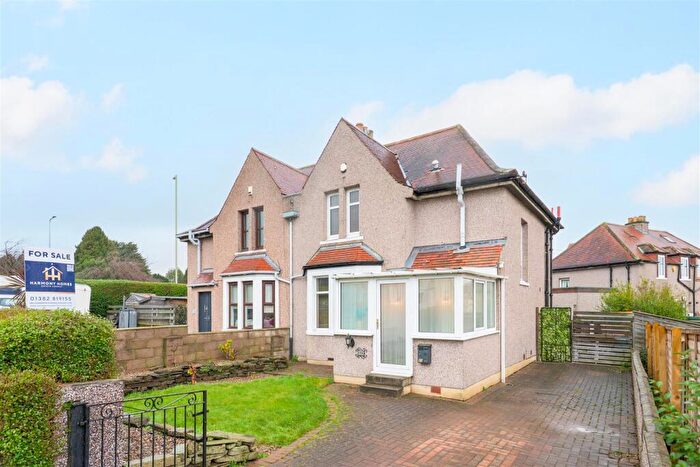
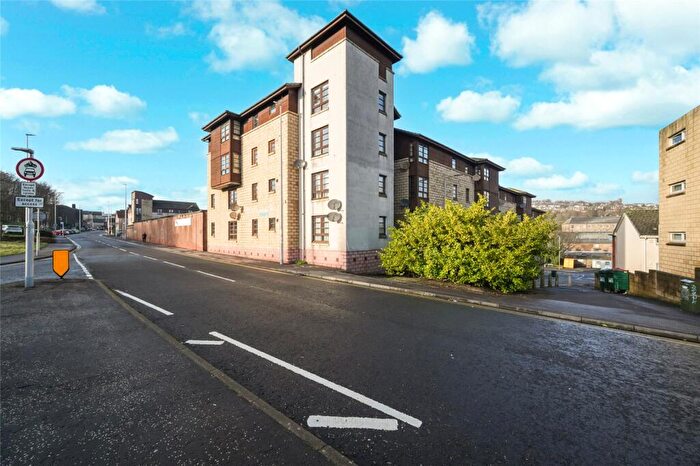
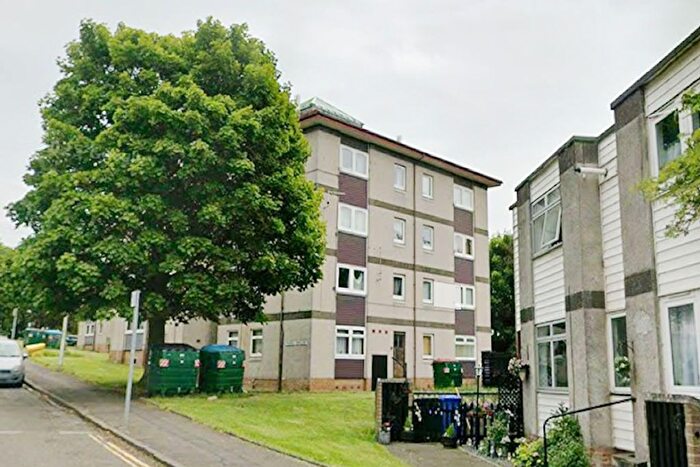
Houses for sale & to rent in Dundee, Dundee City
House Prices in Dundee
Properties in Dundee have an average house price of £167,990.00 and had 3,294 Property Transactions within the last 3 years.¹
Dundee is an area in Dundee City with 68,928 households², where the most expensive property was sold for £810,000.00.
Properties for sale in Dundee
Neighbourhoods in Dundee
Navigate through our locations to find the location of your next house in Dundee, Dundee City for sale or to rent.
Transport in Dundee
Please see below transportation links in this area:
- FAQ
- Price Paid By Year
Frequently asked questions about Dundee
What is the average price for a property for sale in Dundee?
The average price for a property for sale in Dundee is £167,990. There are 3,296 property listings for sale in Dundee.
What locations have the most expensive properties for sale in Dundee?
The locations with the most expensive properties for sale in Dundee are The Ferry at an average of £251,568, West End at an average of £197,785 and Strathmartine at an average of £164,021.
What locations have the most affordable properties for sale in Dundee?
The locations with the most affordable properties for sale in Dundee are Coldside at an average of £129,989, East End at an average of £131,417 and Lochee at an average of £147,566.
Which train stations are available in or near Dundee?
Some of the train stations available in or near Dundee are Dundee, Broughty Ferry and Invergowrie.
Property Price Paid in Dundee by Year
The average sold property price by year was:
| Year | Average Sold Price | Price Change |
Sold Properties
|
|---|---|---|---|
| 2025 | £175,774 | 3% |
897 Properties |
| 2024 | £169,867 | 5% |
1,119 Properties |
| 2023 | £160,883 | 1% |
1,278 Properties |
| 2022 | £159,313 | 2% |
2,804 Properties |
| 2021 | £156,530 | 3% |
3,111 Properties |
| 2020 | £151,724 | 5% |
2,295 Properties |
| 2019 | £144,190 | 3% |
2,667 Properties |
| 2018 | £139,671 | 2% |
2,636 Properties |
| 2017 | £136,434 | 2% |
2,585 Properties |
| 2016 | £134,351 | 3% |
2,714 Properties |
| 2015 | £130,778 | 4% |
2,431 Properties |
| 2014 | £126,083 | -0,2% |
2,223 Properties |
| 2013 | £126,289 | -2% |
2,133 Properties |
| 2012 | £128,438 | 4% |
1,909 Properties |
| 2011 | £122,844 | -1% |
1,706 Properties |
| 2010 | £123,658 | -1% |
1,979 Properties |
| 2009 | £125,399 | 1% |
1,986 Properties |
| 2008 | £124,705 | -6% |
2,853 Properties |
| 2007 | £132,618 | 16% |
3,684 Properties |
| 2006 | £111,226 | -262% |
3,994 Properties |
| 2005 | £402,110 | 79% |
3,924 Properties |
| 2004 | £84,786 | 17% |
3,701 Properties |
| 2003 | £70,258 | 11% |
3,796 Properties |
| 2002 | £62,639 | 10% |
3,989 Properties |
| 2001 | £56,531 | - |
308 Properties |

