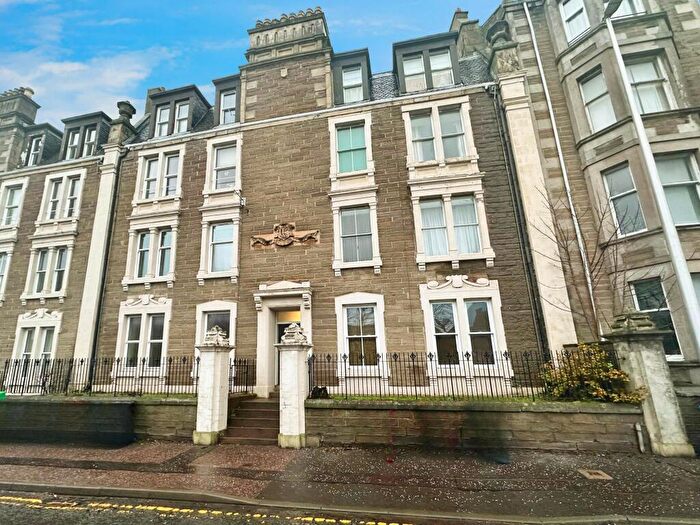
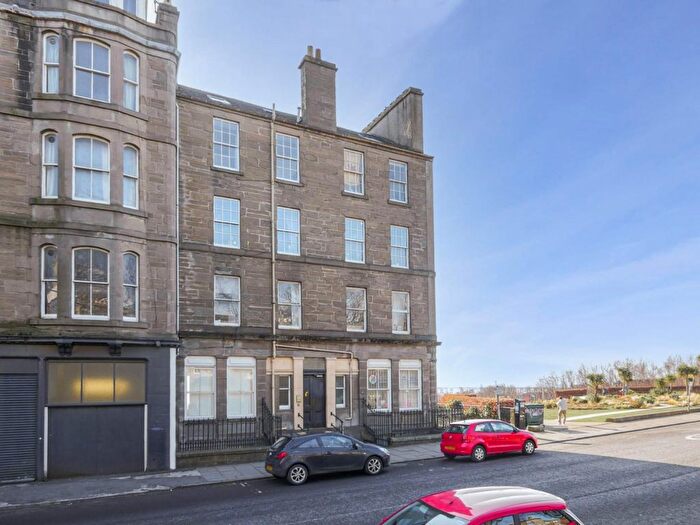
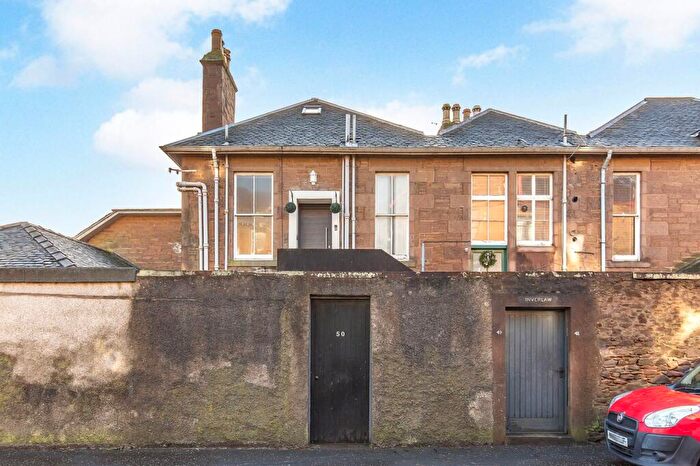
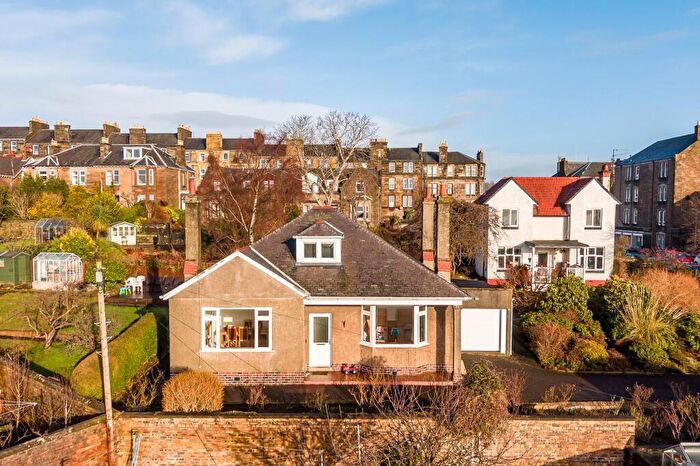
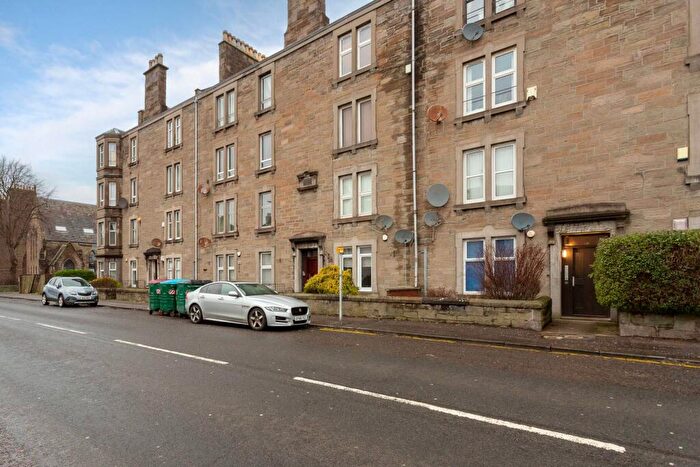
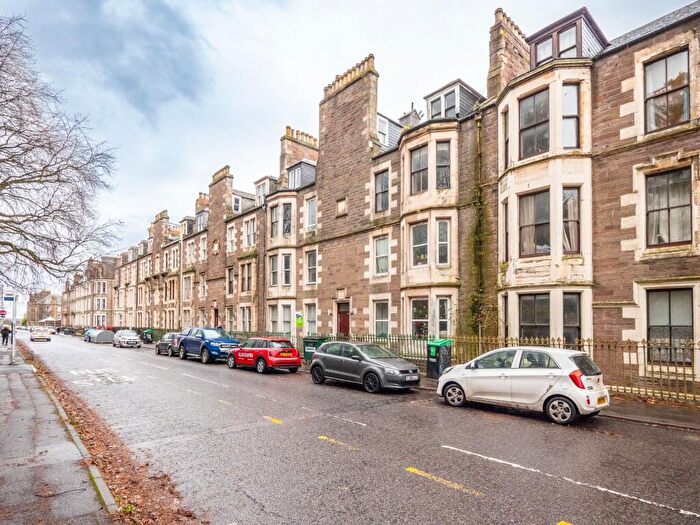
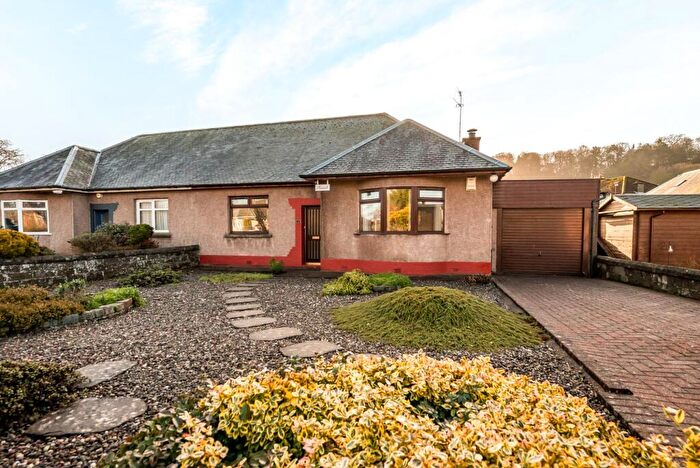
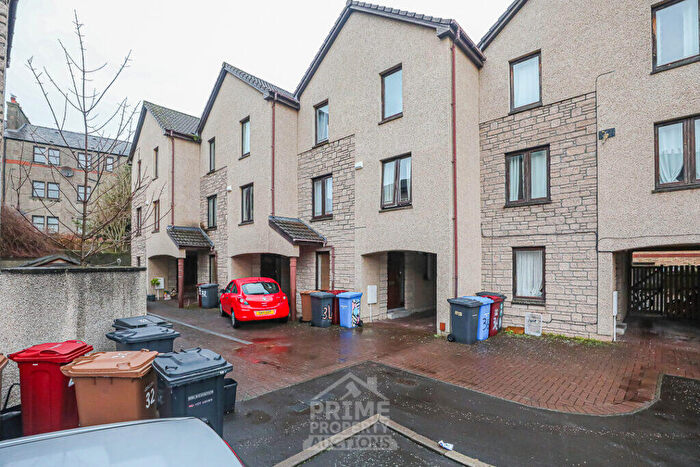
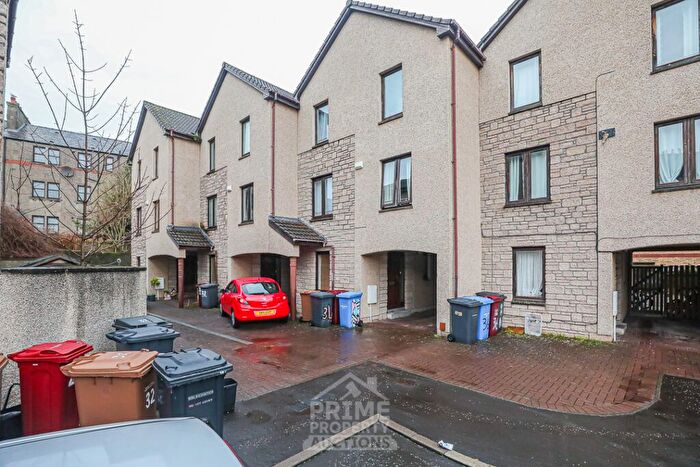
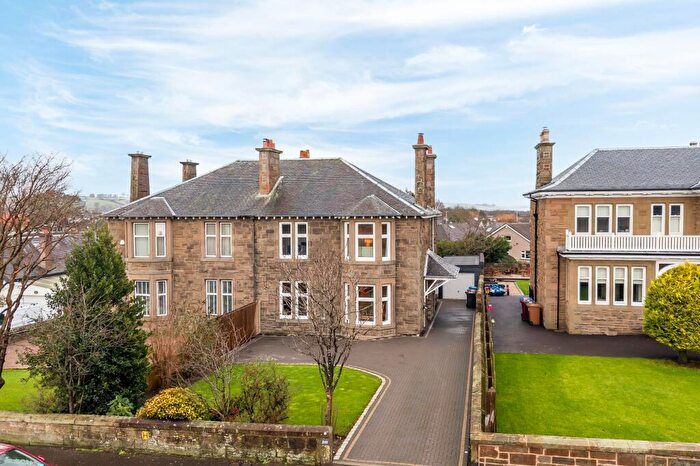
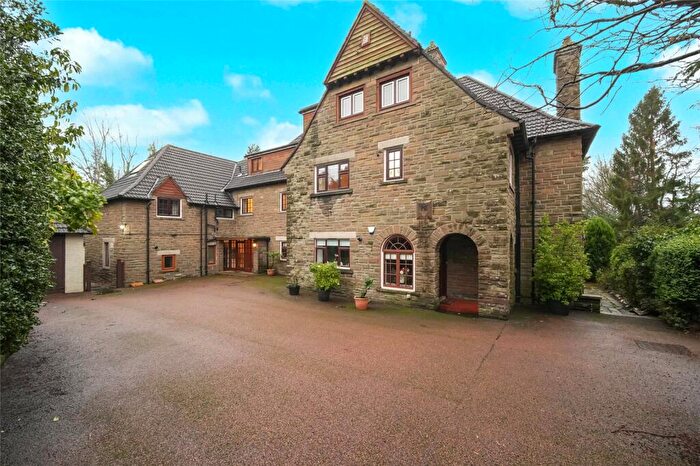
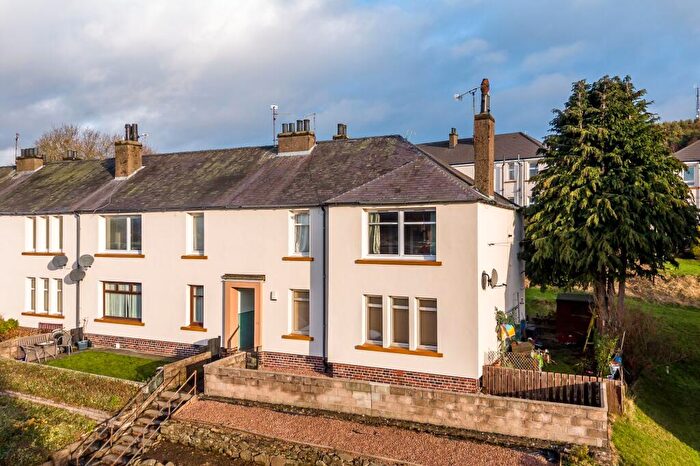
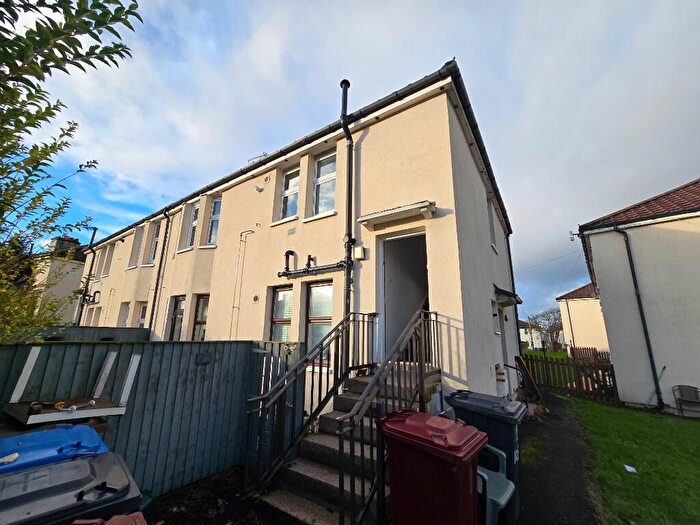
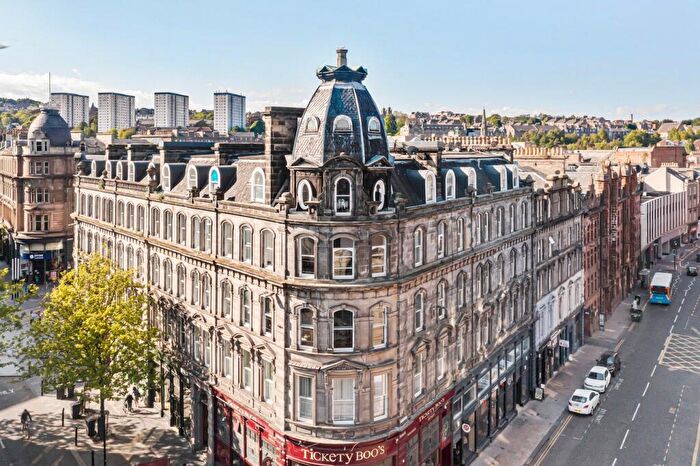
Houses for sale & to rent in West End, Dundee
House Prices in West End
Properties in West End have an average house price of £197,785.00 and had 419 Property Transactions within the last 3 years¹.
West End is an area in Dundee, Dundee City with 9,158 households², where the most expensive property was sold for £570,000.00.
Properties for sale in West End
Roads and Postcodes in West End
Navigate through our locations to find the location of your next house in West End, Dundee for sale or to rent.
Transport near West End
- FAQ
- Price Paid By Year
Frequently asked questions about West End
What is the average price for a property for sale in West End?
The average price for a property for sale in West End is £197,785. This amount is 18% higher than the average price in Dundee. There are 856 property listings for sale in West End.
What streets have the most expensive properties for sale in West End?
The streets with the most expensive properties for sale in West End are Beechwood Terrace at an average of £485,000, Kelso Street at an average of £480,521 and Glamis Road at an average of £458,333.
What streets have the most affordable properties for sale in West End?
The streets with the most affordable properties for sale in West End are Lochee Road at an average of £62,500, Greenbank Place at an average of £74,500 and Milnbank Road at an average of £76,647.
Which train stations are available in or near West End?
Some of the train stations available in or near West End are Dundee, Invergowrie and Broughty Ferry.
Property Price Paid in West End by Year
The average sold property price by year was:
| Year | Average Sold Price | Price Change |
Sold Properties
|
|---|---|---|---|
| 2025 | £197,759 | -1% |
99 Properties |
| 2024 | £199,341 | 1% |
139 Properties |
| 2023 | £196,604 | 17% |
181 Properties |
| 2022 | £162,961 | -0,5% |
400 Properties |
| 2021 | £163,723 | 1% |
434 Properties |
| 2020 | £162,205 | -2% |
291 Properties |
| 2019 | £164,997 | 9% |
430 Properties |
| 2018 | £150,366 | -0,3% |
399 Properties |
| 2017 | £150,840 | -5% |
419 Properties |
| 2016 | £158,236 | 10% |
426 Properties |
| 2015 | £141,676 | 4% |
401 Properties |
| 2014 | £136,378 | -6% |
352 Properties |
| 2013 | £145,027 | -3% |
320 Properties |
| 2012 | £148,776 | 11% |
316 Properties |
| 2011 | £132,923 | -0,1% |
280 Properties |
| 2010 | £133,107 | -7% |
329 Properties |
| 2009 | £142,187 | -1% |
316 Properties |
| 2008 | £143,873 | -5% |
368 Properties |
| 2007 | £151,355 | 14% |
544 Properties |
| 2006 | £130,417 | 7% |
646 Properties |
| 2005 | £121,202 | 17% |
684 Properties |
| 2004 | £101,054 | 23% |
539 Properties |
| 2003 | £77,394 | 12% |
622 Properties |
| 2002 | £68,335 | -5% |
664 Properties |
| 2001 | £71,823 | - |
43 Properties |

