
Houses for sale & to rent in Clarkston, Netherlee and Williamwood, Glasgow
House Prices in Clarkston, Netherlee and Williamwood
Properties in Clarkston, Netherlee and Williamwood have an average house price of £322,784.00 and had 412 Property Transactions within the last 3 years¹.
Clarkston, Netherlee and Williamwood is an area in Glasgow, East Renfrewshire with 8,329 households², where the most expensive property was sold for £1,130,000.00.
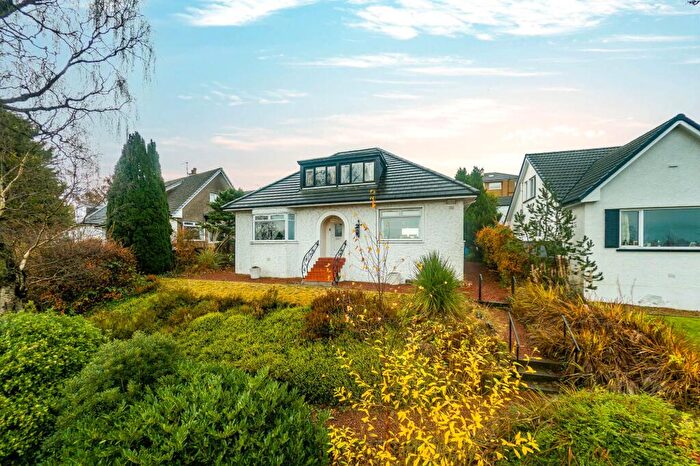
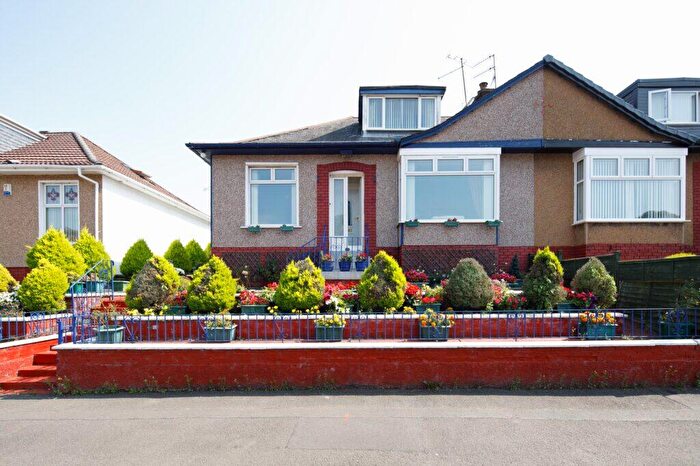
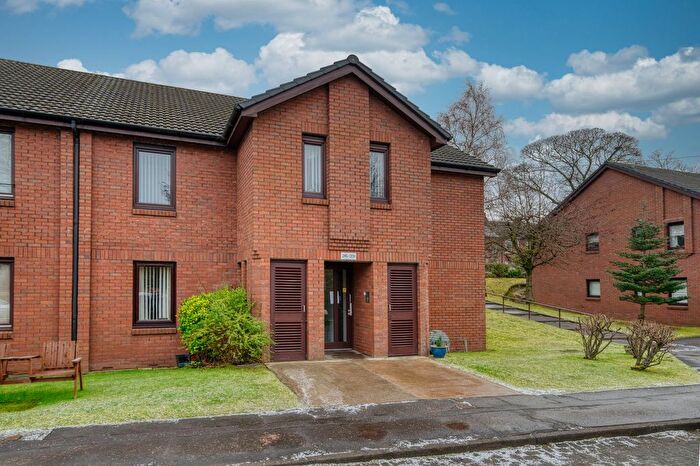
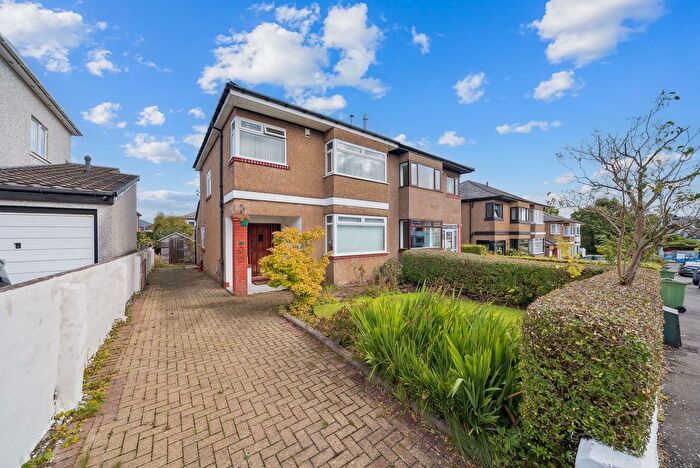
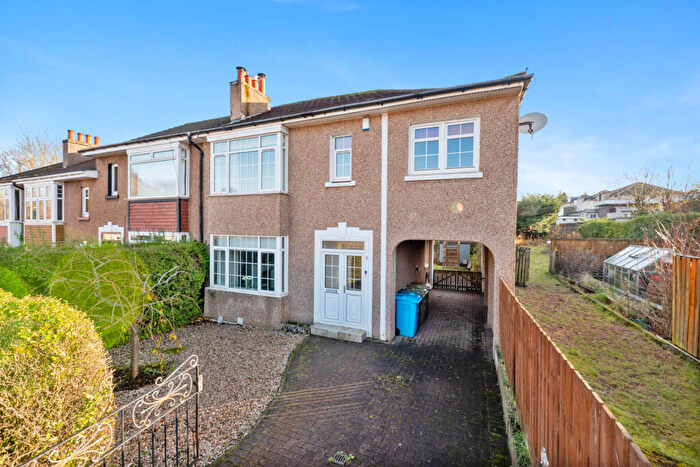
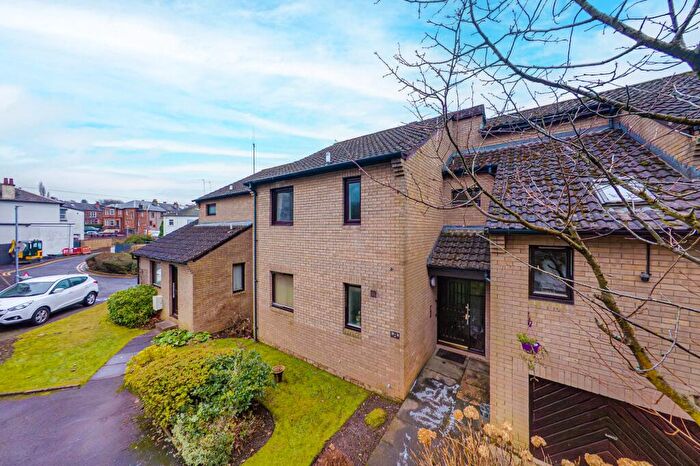
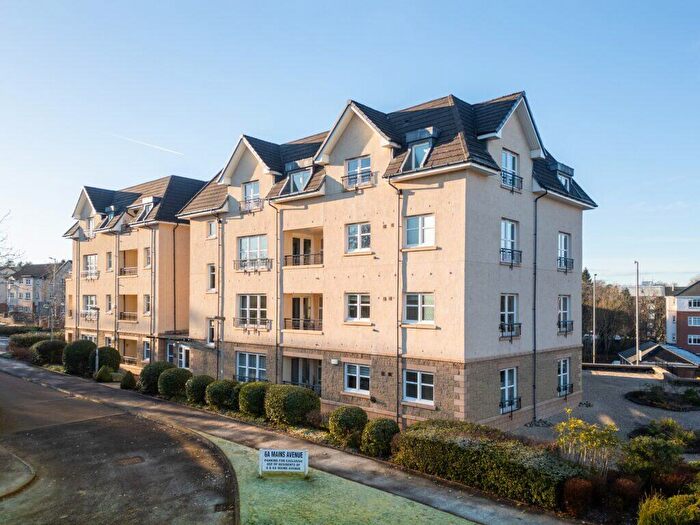
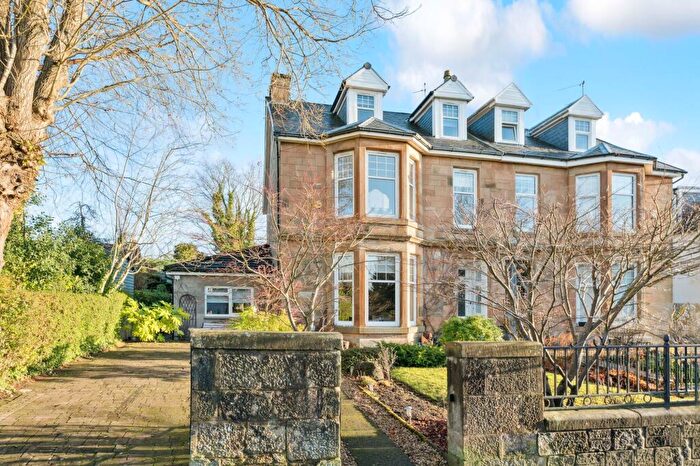
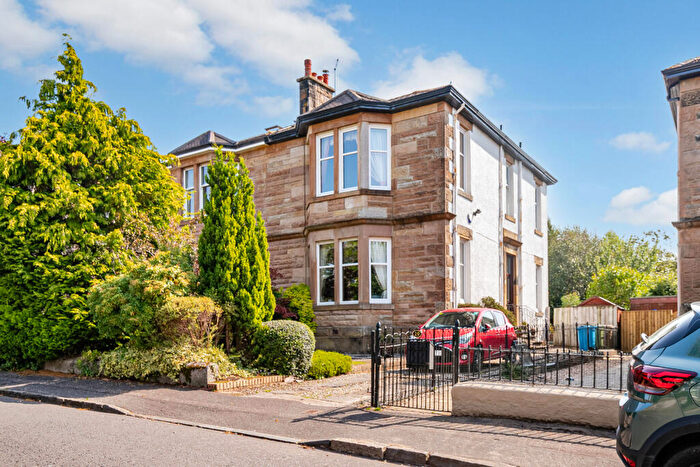
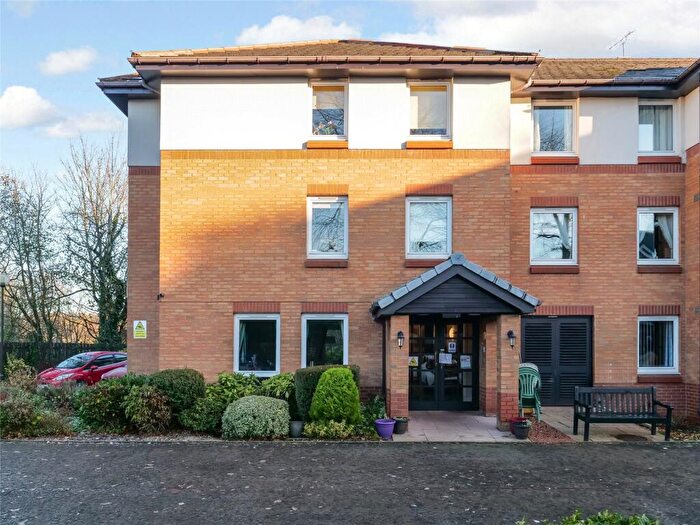
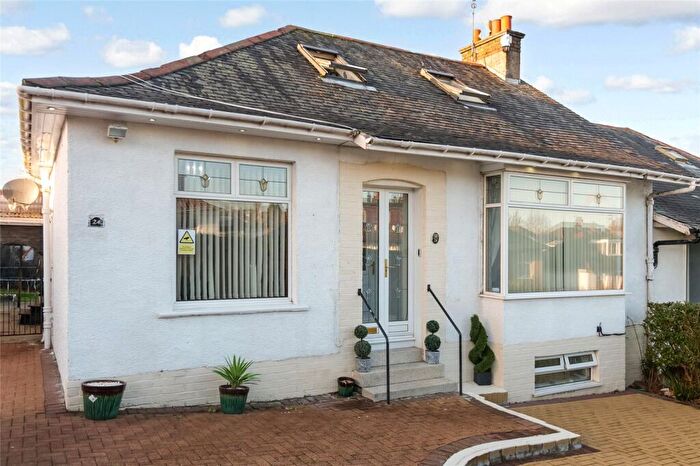
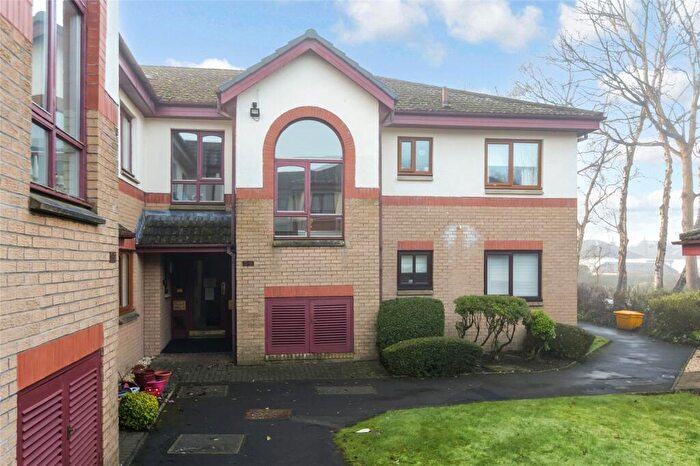
Properties for sale in Clarkston, Netherlee and Williamwood
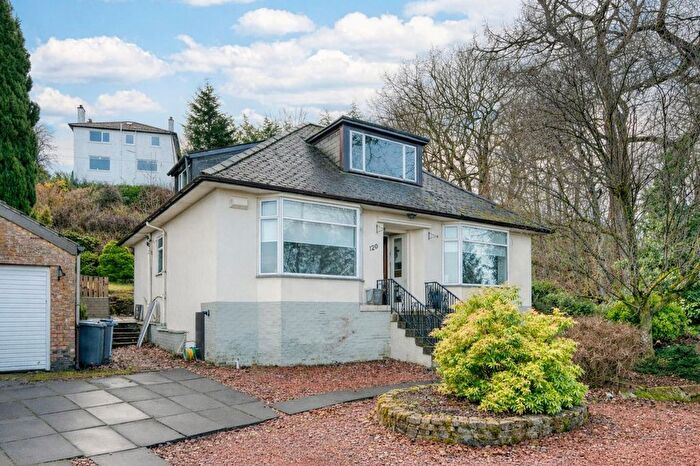
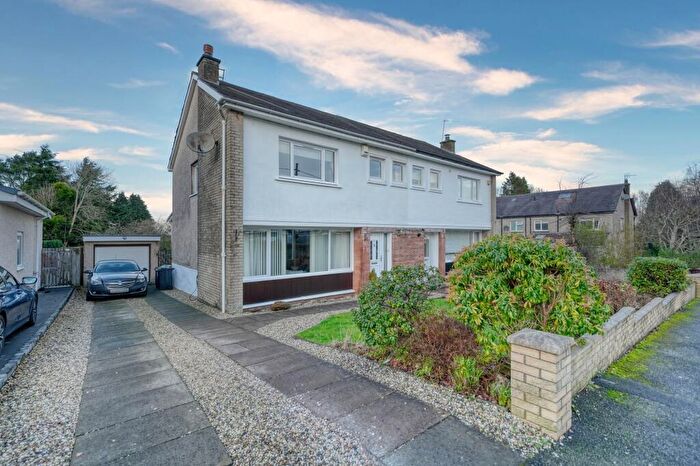
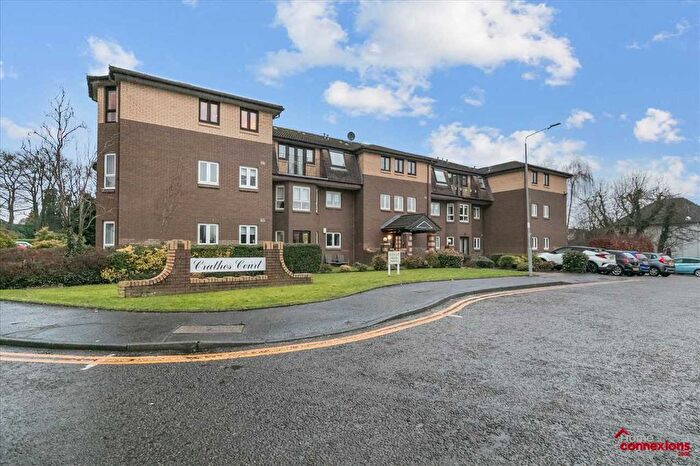
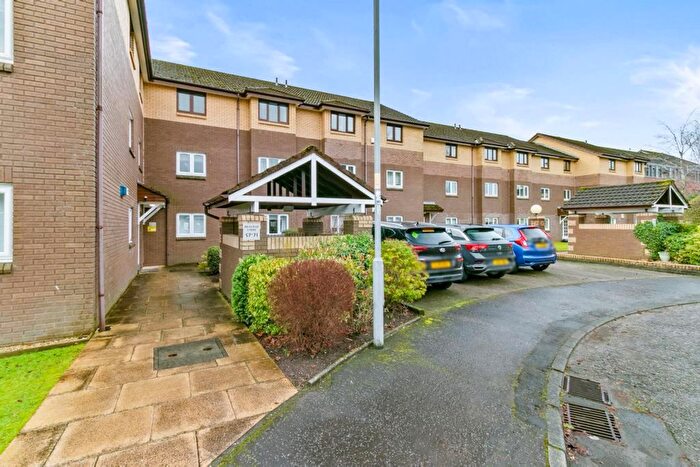
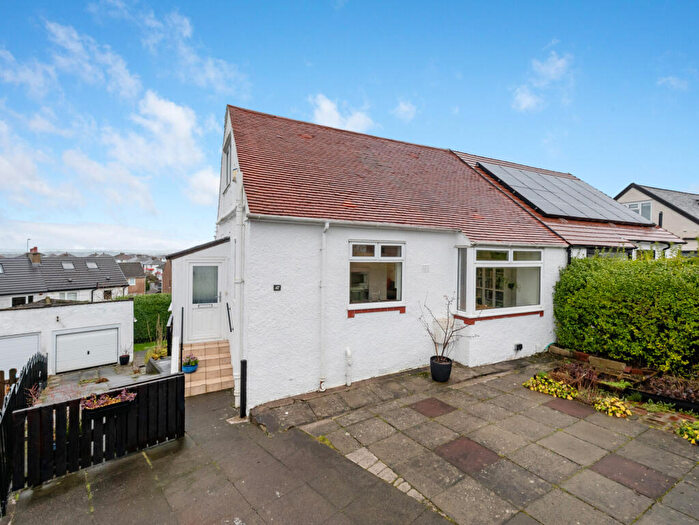
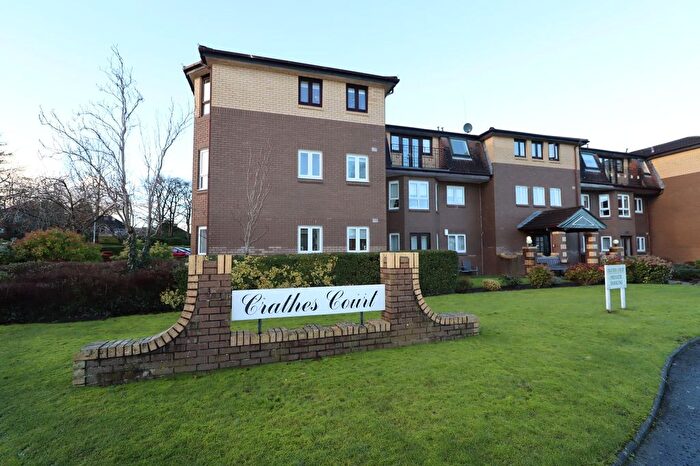
![]()
If you are looking to sell your house, let it out, or receive a property valuation, an expert can help you.
Click the button below to get started.
Roads and Postcodes in Clarkston, Netherlee and Williamwood
Navigate through our locations to find the location of your next house in Clarkston, Netherlee and Williamwood, Glasgow for sale or to rent.
Transport near Clarkston, Netherlee and Williamwood
-
 Clarkston Station
 -
Williamwood Station
-
Busby Station
-
Giffnock Station
-
Whitecraigs Station
-
Muirend Station
-
Thorntonhall Station
-
Thornliebank Station
-
Cathcart Station
-
Langside Station
- FAQ
- Price Paid By Year
Frequently asked questions about Clarkston, Netherlee and Williamwood
What is the average price for a property for sale in Clarkston, Netherlee and Williamwood?
The average price for a property for sale in Clarkston, Netherlee and Williamwood is £322,784. This amount is 5% higher than the average price in Glasgow. There are 1,654 property listings for sale in Clarkston, Netherlee and Williamwood.
Which train stations are available in or near Clarkston, Netherlee and Williamwood?
Some of the train stations available in or near Clarkston, Netherlee and Williamwood are Clarkston, Williamwood and Busby.
Property Price Paid in Clarkston, Netherlee and Williamwood by Year
The average sold property price by year was:
| Year | Average Sold Price | Price Change |
Sold Properties
|
|---|---|---|---|
| 2023 | £327,947 | 2% |
62 Properties |
| 2022 | £321,869 | 8% |
350 Properties |
| 2021 | £295,639 | 12% |
335 Properties |
| 2020 | £258,734 | 1% |
297 Properties |
| 2019 | £257,254 | 5% |
328 Properties |
| 2018 | £245,595 | 0,4% |
330 Properties |
| 2017 | £244,566 | 11% |
340 Properties |
| 2016 | £216,709 | -2% |
347 Properties |
| 2015 | £221,086 | -4% |
389 Properties |
| 2014 | £229,334 | 8% |
417 Properties |
| 2013 | £209,974 | 0,3% |
388 Properties |
| 2012 | £209,305 | -1% |
308 Properties |
| 2011 | £210,388 | 3% |
279 Properties |
| 2010 | £203,504 | 2% |
283 Properties |
| 2009 | £198,996 | 2% |
299 Properties |
| 2008 | £195,701 | -25% |
302 Properties |
| 2007 | £243,713 | 25% |
332 Properties |
| 2006 | £183,689 | -4% |
433 Properties |
| 2005 | £191,332 | 7% |
436 Properties |
| 2004 | £178,029 | 26% |
397 Properties |
| 2003 | £130,881 | 18% |
404 Properties |
| 2002 | £107,025 | 2% |
444 Properties |
| 2001 | £105,059 | - |
39 Properties |