
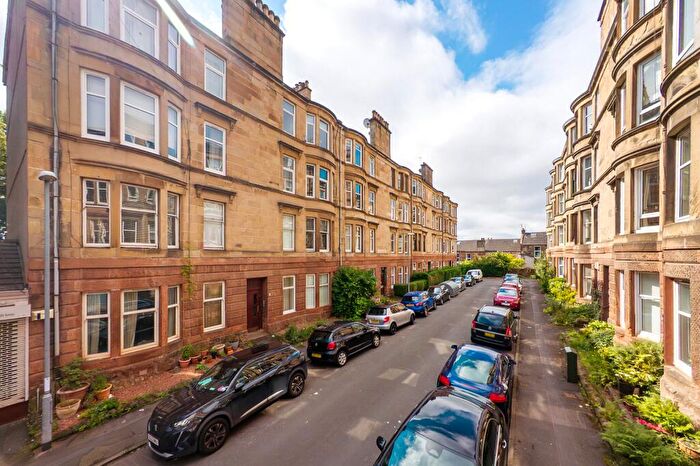
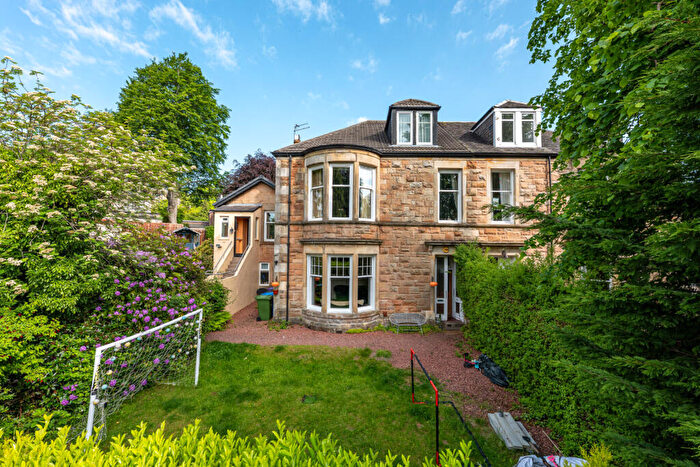
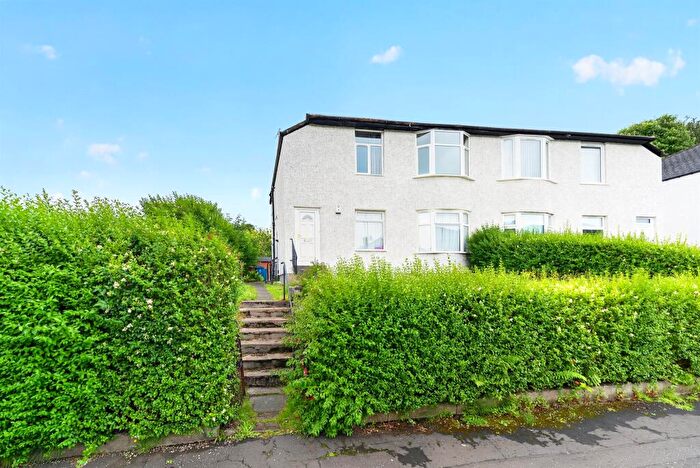
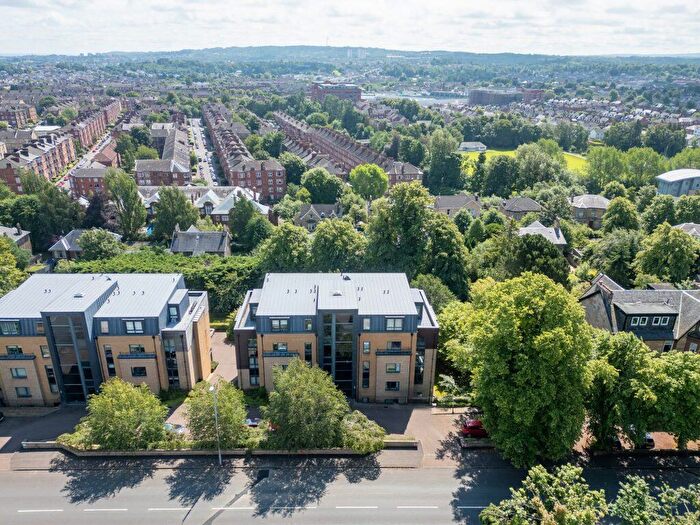
Houses for sale in Langside, Glasgow
House Prices in Langside
Properties in Langside have an average house price of £217k and had 496 Property Transactions within the last 3 years¹.
Langside is an area in Glasgow, Glasgow City with 15,105 households², where the most expensive property was sold for £732k.
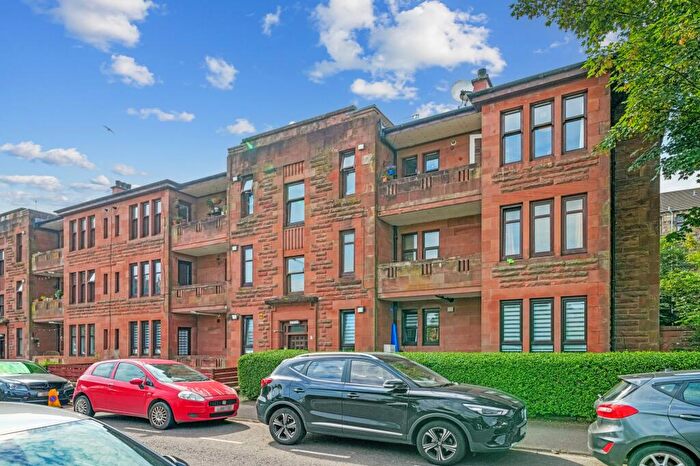
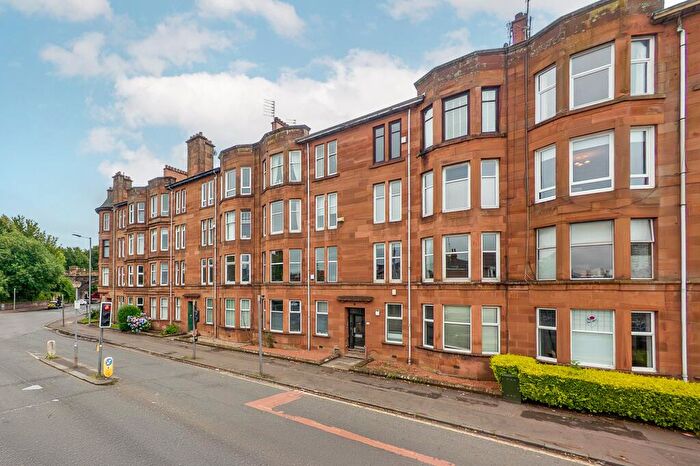
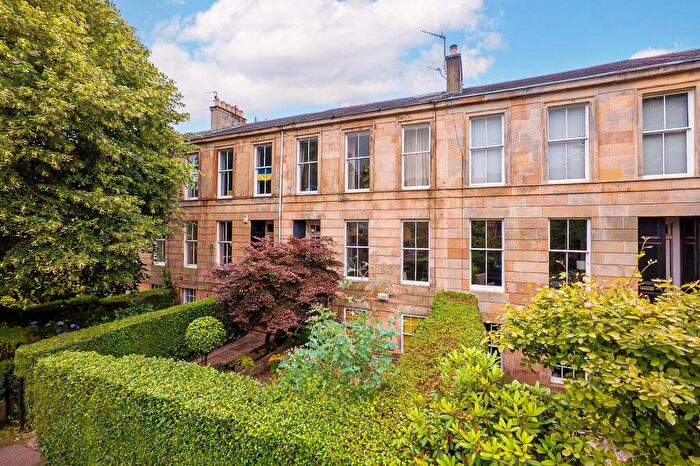
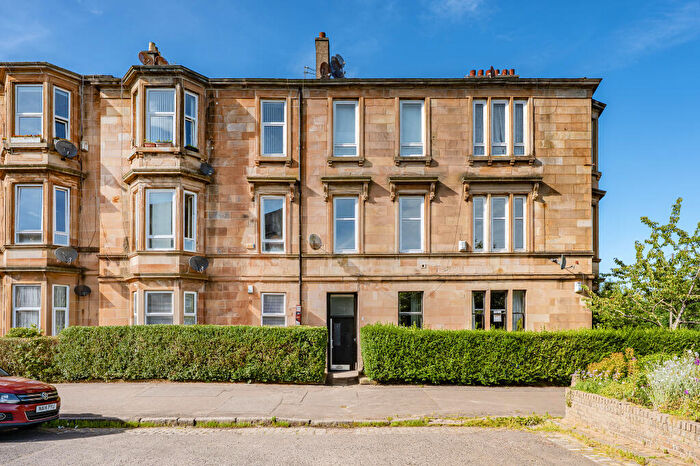
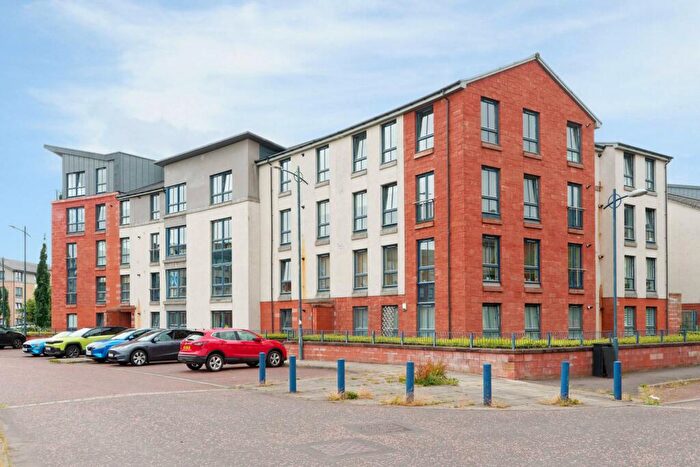
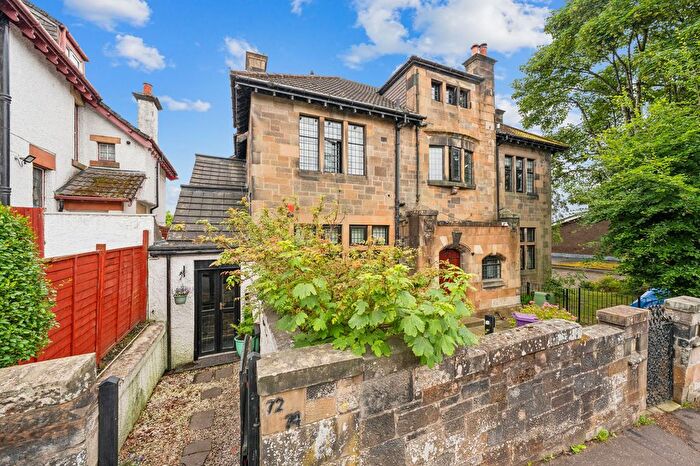
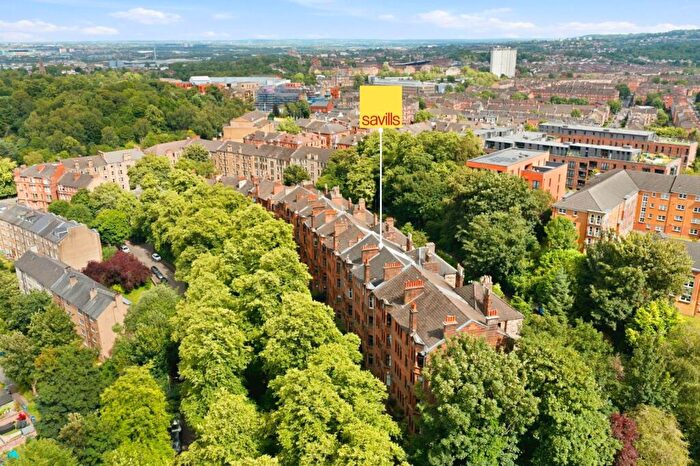
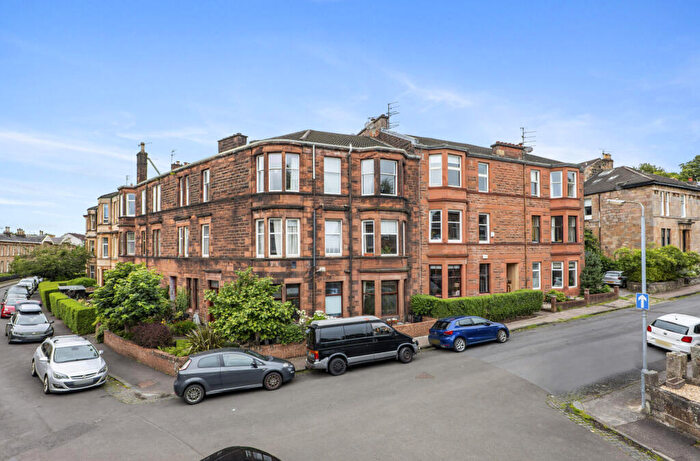
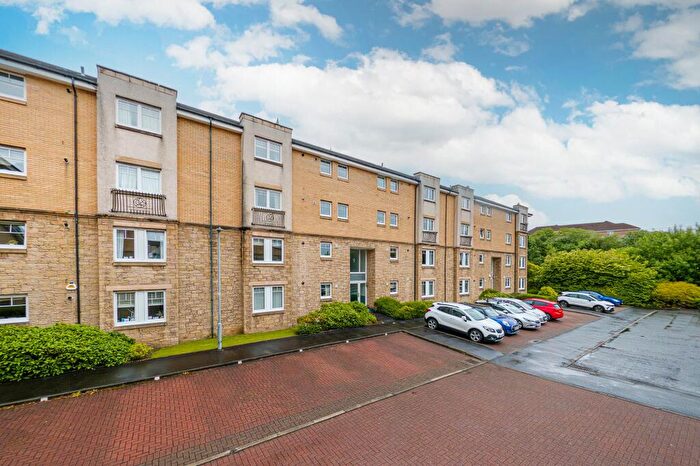
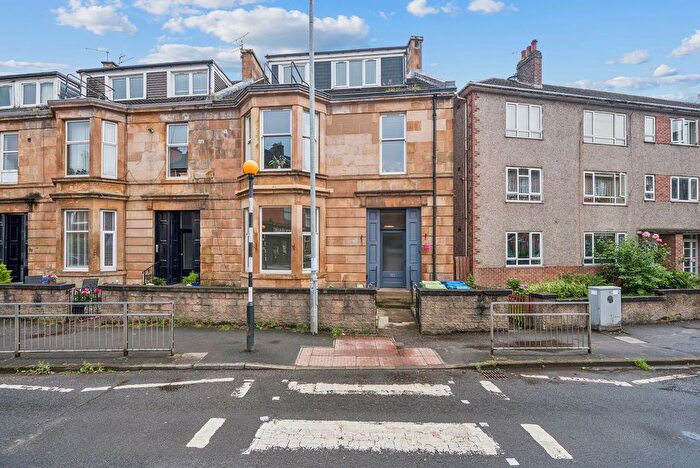
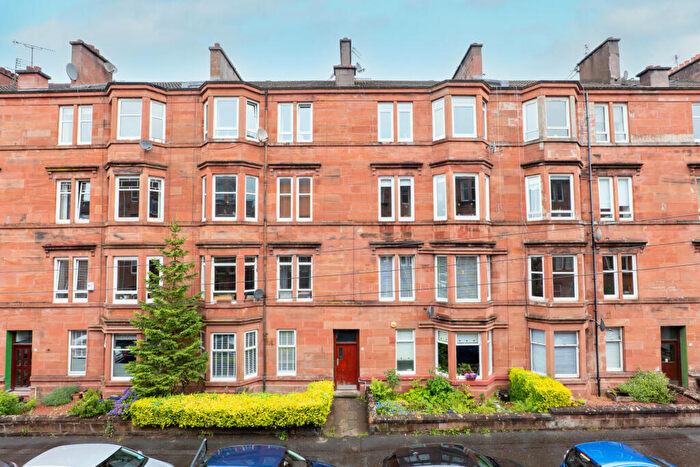
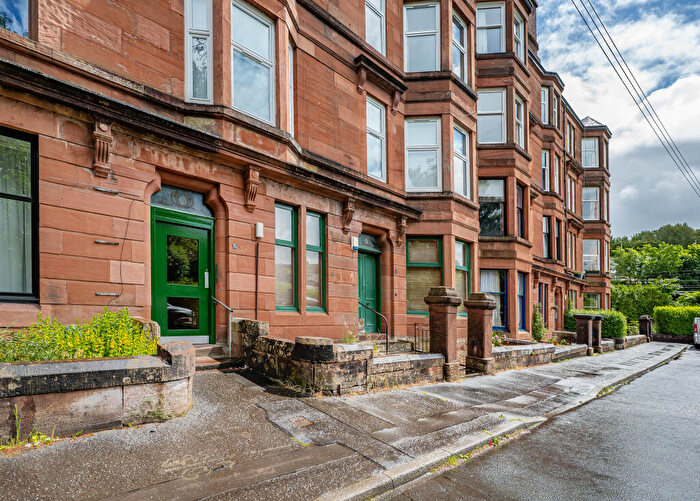
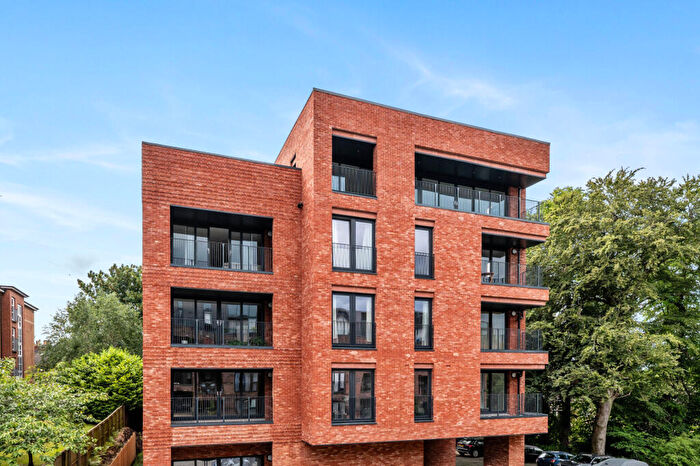
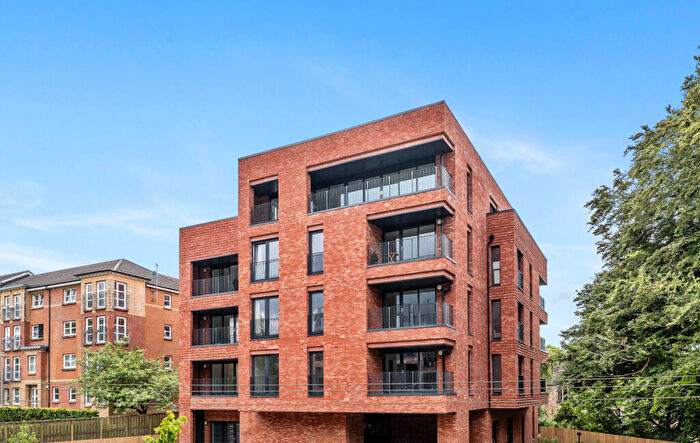
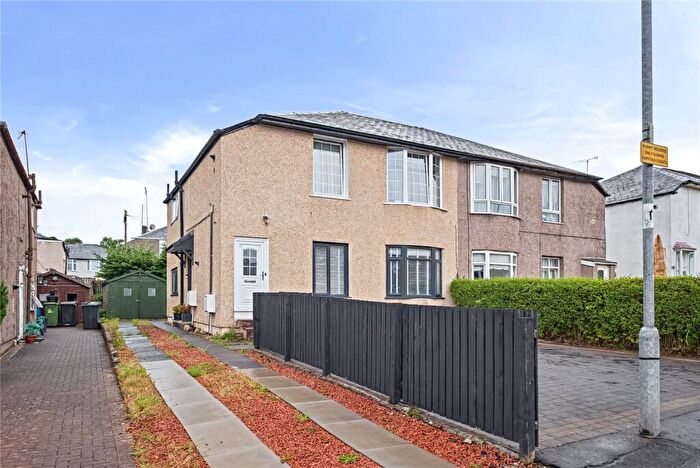
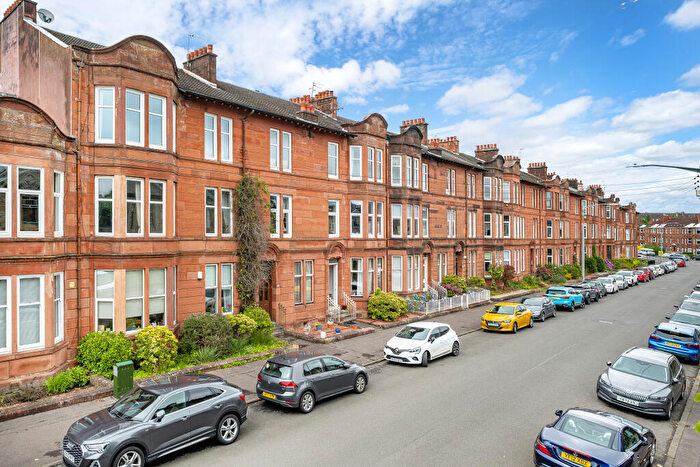
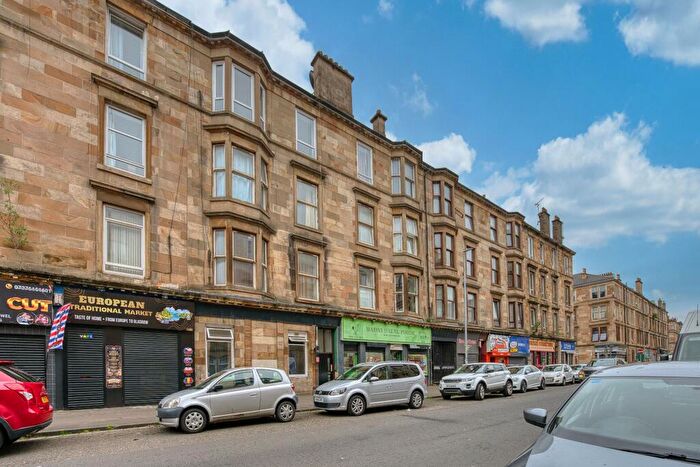
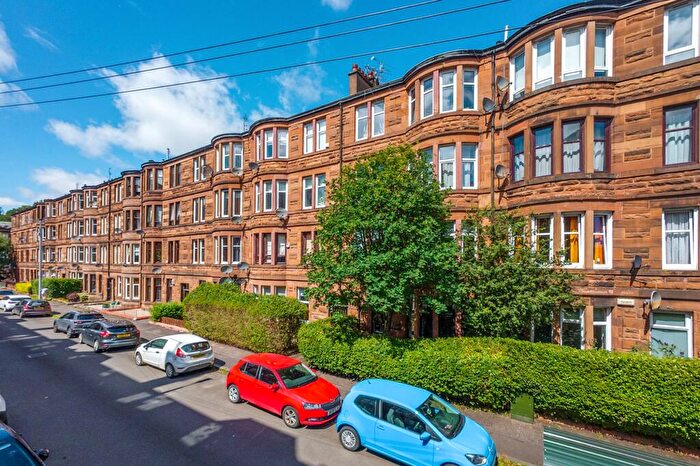
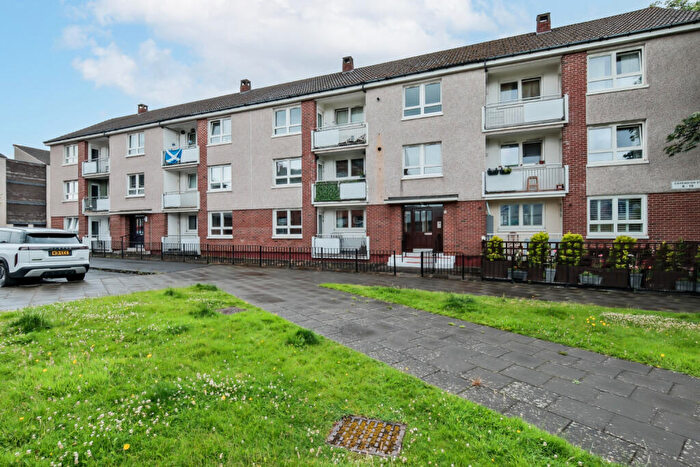
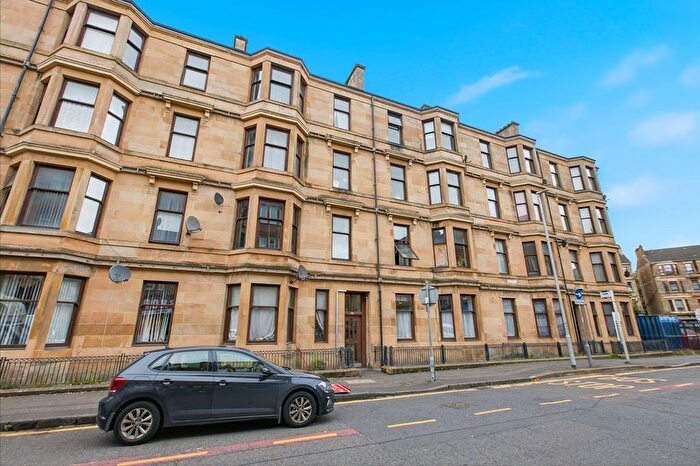
Properties for sale in Langside
![]()
If you are looking to sell your house, let it out, or receive a property valuation, an expert can help you.
Click the button below to get started.
Roads and Postcodes in Langside
Navigate through our locations to find the location of your next house in Langside, Glasgow for sale or to rent.
Property price trends in Langside
According to the latest Registers of Scotland data, the average home in Langside sold for £238,803 in 2025. That figure comes from a substantial record of 20,845 sales logged over the past 24 years.
Prices have continued to climb over the last three years. Compared with 2022, when the typical sale came in around £193,076, that's a rise of roughly 23.7%.
Looking back five years, average prices are up about 41.9% since 2020, a gain of around £70,534 in cash terms.
Zoom out to the past decade for the fuller picture. Back in 2015, homes here averaged £121,310, so the typical sold price has climbed about 96.9% since then, roughly 7% a year. Stretch the view to fifteen years and that annual pace eases back to about 4.8%.
Frequently asked questions about Langside
What is the average price for a property for sale in Langside?
The average price for a property for sale in Langside is £216,858. This amount is 1% higher than the average price in Glasgow. There are 6,242 property listings for sale in Langside.
What streets have the most expensive properties for sale in Langside?
The streets with the most expensive properties for sale in Langside are May Terrace at an average of £713,000, Blairhall Avenue at an average of £623,500 and Cathkin Road at an average of £557,775.
What streets have the most affordable properties for sale in Langside?
The streets with the most affordable properties for sale in Langside are Kingsbridge Crescent at an average of £99,621, Castlemilk Road at an average of £103,184 and Kerrylamont Avenue at an average of £106,000.
Which train stations are available in or near Langside?
Some of the train stations available in or near Langside are Mount Florida, Cathcart and Crosshill.
Property Price Paid in Langside by Year
The average sold property price by year was:
| Year | Average Sold Price | Price Change |
Sold Properties
|
|---|---|---|---|
| 2025 | £238,803 | 5% |
112 Properties |
| 2024 | £226,128 | 10% |
125 Properties |
| 2023 | £202,894 | 5% |
259 Properties |
| 2022 | £193,076 | 7% |
963 Properties |
| 2021 | £179,966 | 6% |
1,138 Properties |
| 2020 | £168,269 | 2% |
883 Properties |
| 2019 | £164,633 | 11% |
1,175 Properties |
| 2018 | £145,805 | 9% |
982 Properties |
| 2017 | £133,243 | 2% |
983 Properties |
| 2016 | £130,495 | 7% |
956 Properties |
