
Houses for sale & to rent in Glasgow, East Renfrewshire
House Prices in Glasgow
Properties in Glasgow have an average house price of £316k and had 2,135 Property Transactions within the last 3 years.¹
Glasgow is an area in East Renfrewshire with 37,189 households², where the most expensive property was sold for £1.95M.
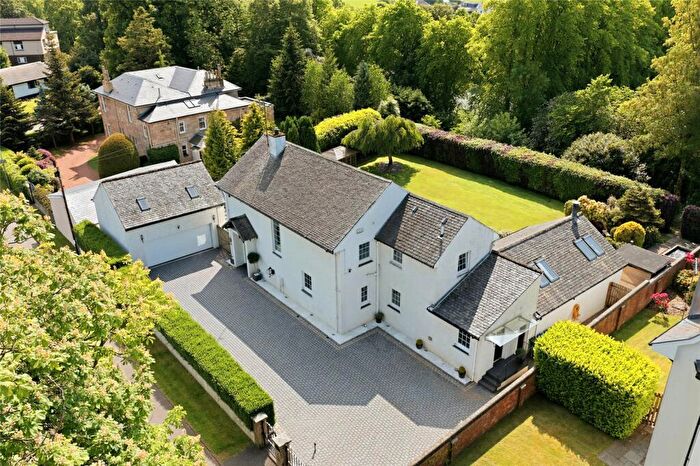
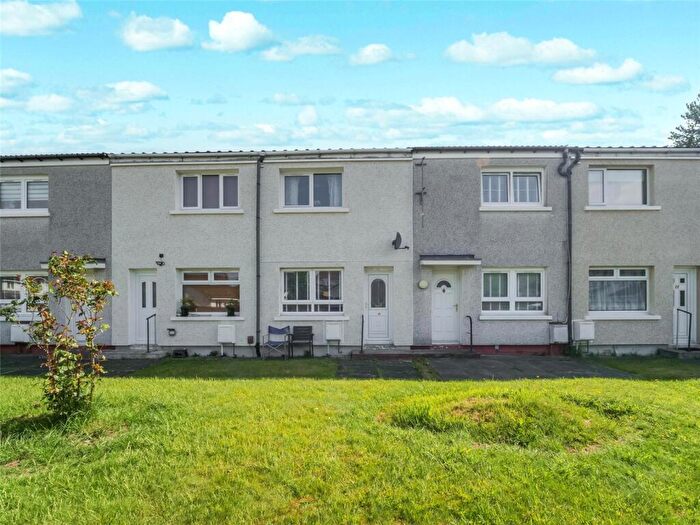
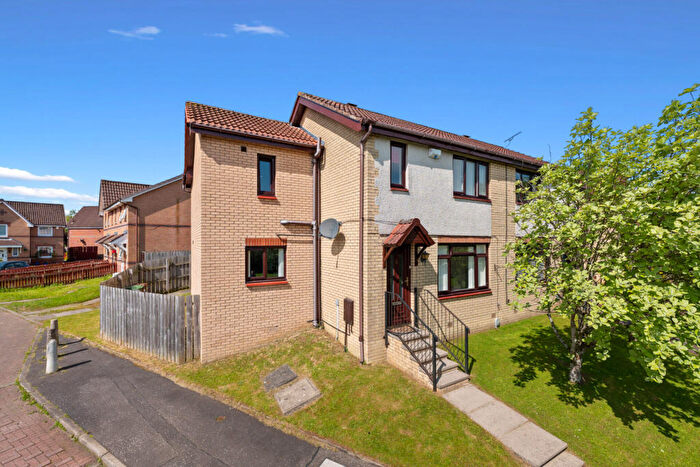
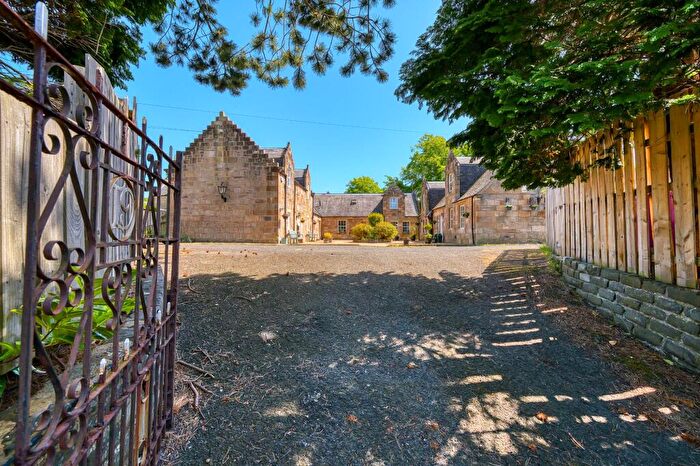
Properties for sale in Glasgow
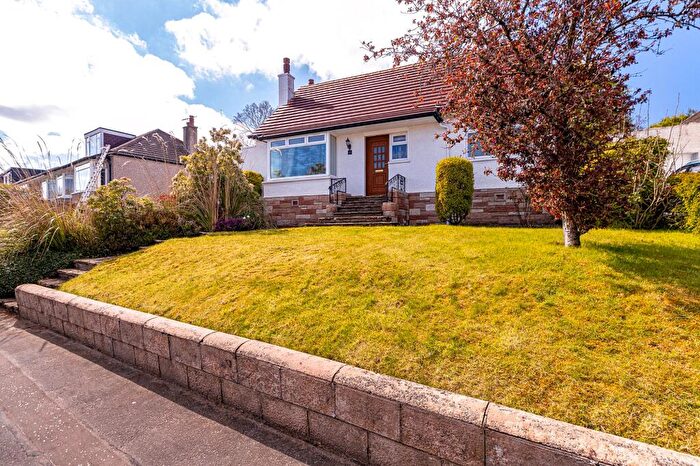
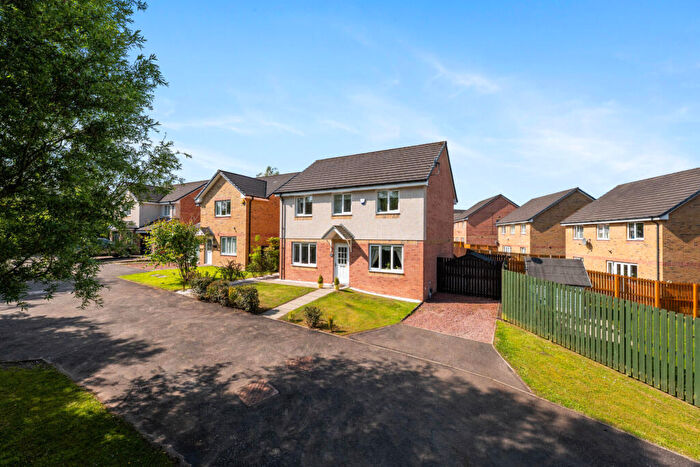
![]()
If you are looking to sell your house, let it out, or receive a property valuation, an expert can help you.
Click the button below to get started.
Neighbourhoods in Glasgow
Navigate through our locations to find the location of your next house in Glasgow, East Renfrewshire for sale or to rent.
Transport in Glasgow
Please see below transportation links in this area:
-
 Patterton Station
 -
Whitecraigs Station
-
Williamwood Station
-
Priesthill and Darnley Station
-
Kennishead Station
-
Thornliebank Station
-
Giffnock Station
-
Nitshill Station
-
Clarkston Station
-
Busby Station
- FAQ
- Price Paid By Year
Frequently asked questions about Glasgow
What is the average price for a property for sale in Glasgow?
The average price for a property for sale in Glasgow is £315,833. This amount is 0.33% lower than the average price in East Renfrewshire. There are more than 10,000 property listings for sale in Glasgow.
What locations have the most expensive properties for sale in Glasgow?
The locations with the most expensive properties for sale in Glasgow are Newton Mearns South and Eaglesham at an average of £381,838, Giffnock and Thornliebank at an average of £365,805 and Clarkston, Netherlee and Williamwood at an average of £322,416.
What locations have the most affordable properties for sale in Glasgow?
The locations with the most affordable properties for sale in Glasgow are Barrhead, Liboside and Uplawmoor at an average of £189,947 and Newton Mearns North and Neilston at an average of £293,642.
Which train stations are available in or near Glasgow?
Some of the train stations available in or near Glasgow are Patterton, Whitecraigs and Williamwood.
Property Price Paid in Glasgow by Year
The average sold property price by year was:
| Year | Average Sold Price | Price Change |
Sold Properties
|
|---|---|---|---|
| 2025 | £332,183 | 6% |
664 Properties |
| 2024 | £311,611 | 2% |
676 Properties |
| 2023 | £305,767 | -1% |
795 Properties |
| 2022 | £307,556 | 6% |
1,782 Properties |
| 2021 | £288,446 | 5% |
1,955 Properties |
| 2020 | £274,472 | 7% |
1,524 Properties |
| 2019 | £255,233 | -3% |
1,761 Properties |
| 2018 | £263,727 | 4% |
1,723 Properties |
| 2017 | £253,222 | 2% |
1,776 Properties |
| 2016 | £247,327 | 6% |
1,781 Properties |
| 2015 | £231,894 | -0,1% |
1,896 Properties |
| 2014 | £232,181 | 6% |
1,682 Properties |
| 2013 | £217,647 | 2% |
1,637 Properties |
| 2012 | £213,584 | 2% |
1,353 Properties |
| 2011 | £209,273 | 1% |
1,182 Properties |
| 2010 | £208,167 | 0,1% |
1,212 Properties |
| 2009 | £208,013 | -1% |
1,221 Properties |
| 2008 | £209,185 | -4% |
1,421 Properties |
| 2007 | £218,201 | 11% |
1,948 Properties |
| 2006 | £194,272 | 3% |
2,096 Properties |
| 2005 | £188,207 | 10% |
1,960 Properties |
| 2004 | £169,155 | 19% |
1,881 Properties |
| 2003 | £136,205 | 5% |
1,893 Properties |
| 2002 | £129,349 | 14% |
2,069 Properties |
| 2001 | £110,690 | - |
169 Properties |