
Houses for sale in East Renfrewshire, Scotland
House Prices in East Renfrewshire
Properties in East Renfrewshire have
an average house price of
£317k
and had 2,255 Property Transactions
within the last 3 years.¹
East Renfrewshire is a location in
Scotland with
37,189 households², where the most expensive property was sold for £1.95M.
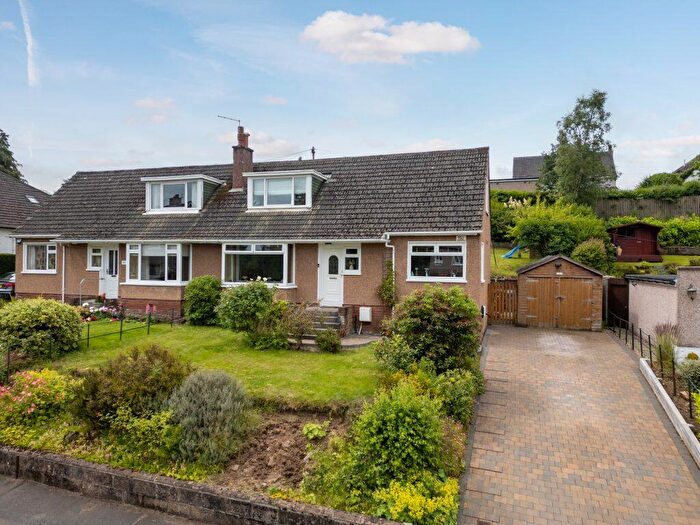
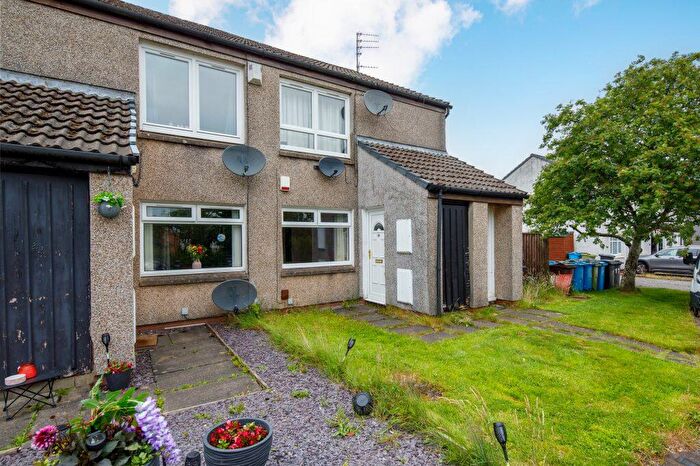
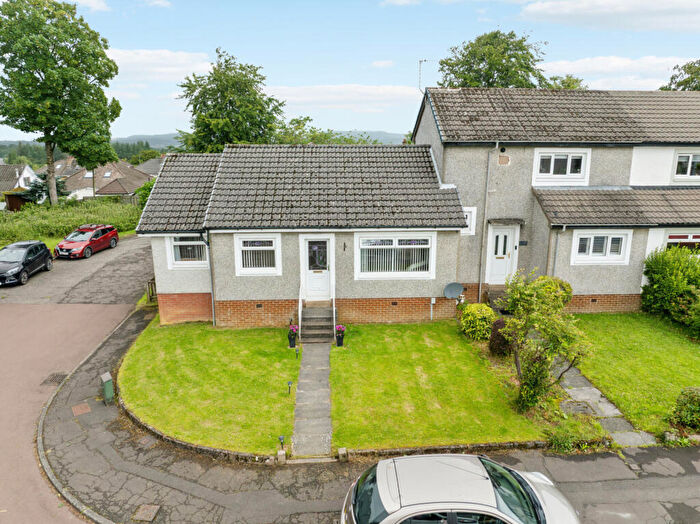
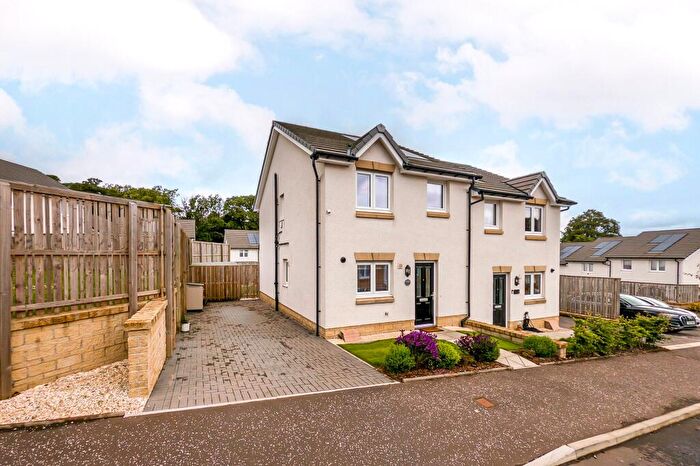
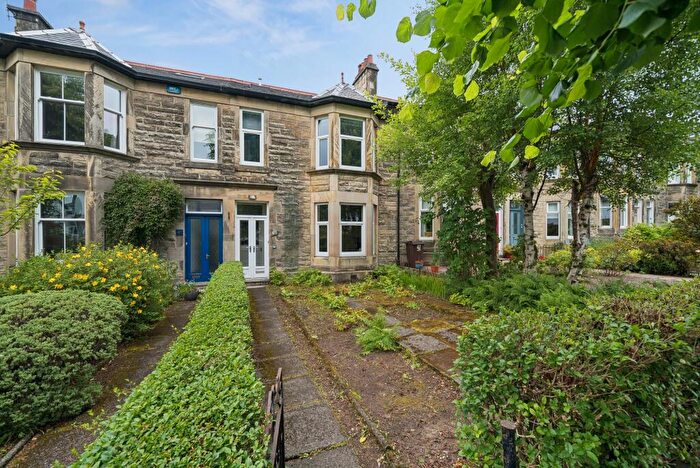
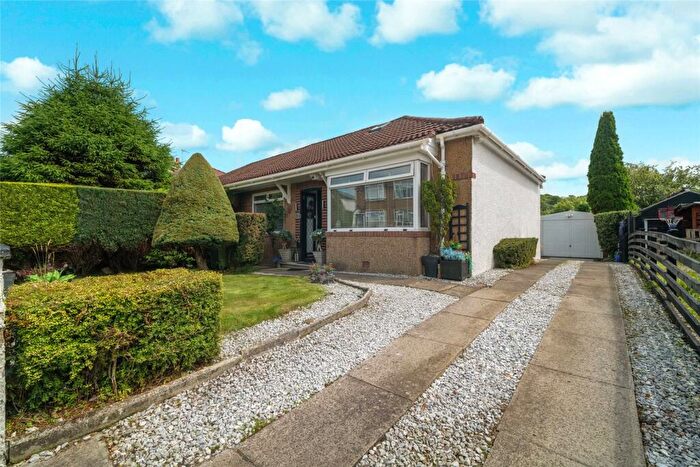
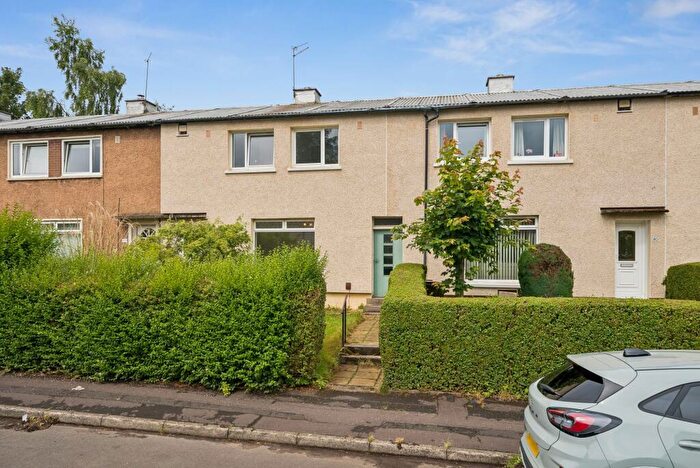
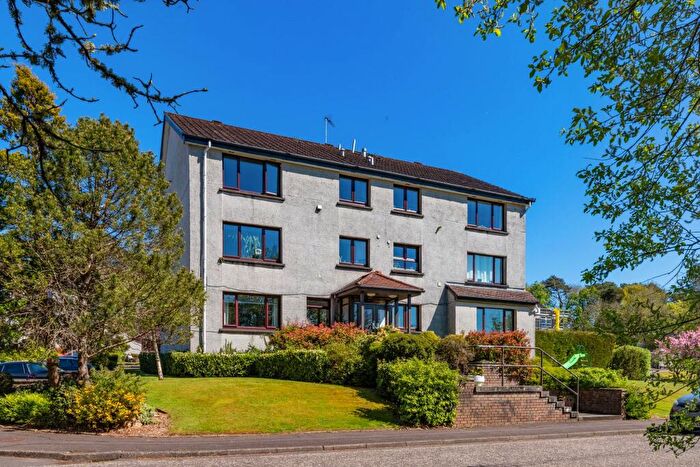
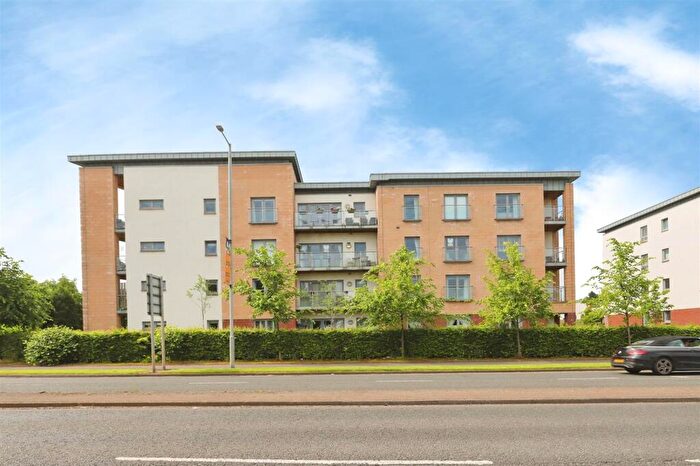
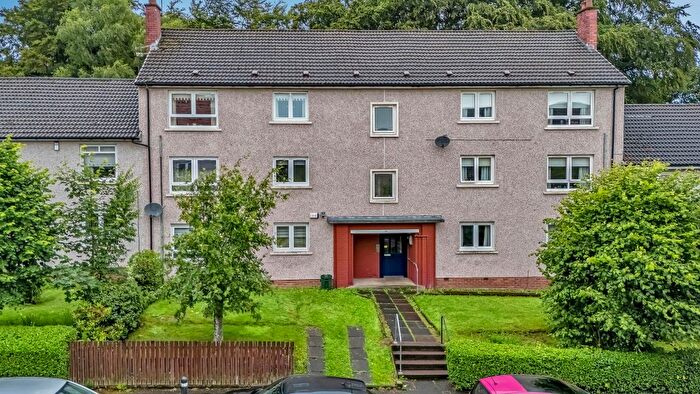
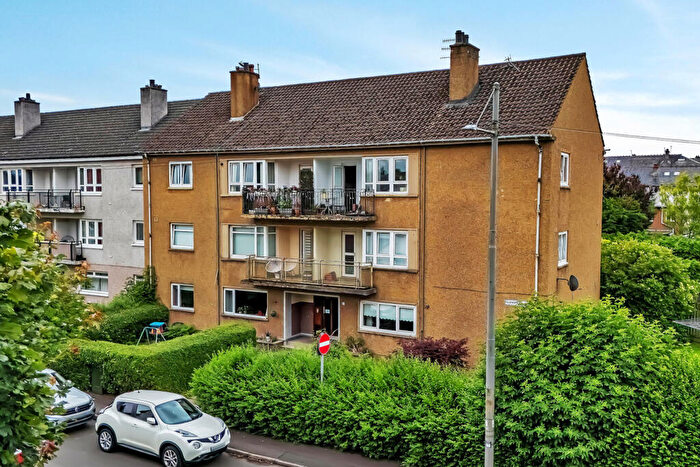
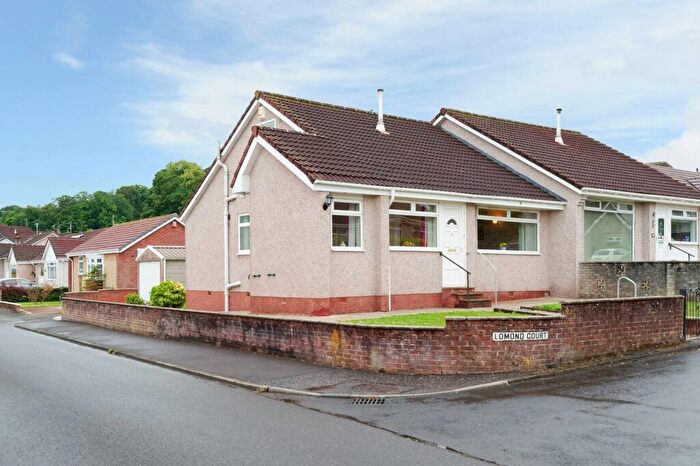
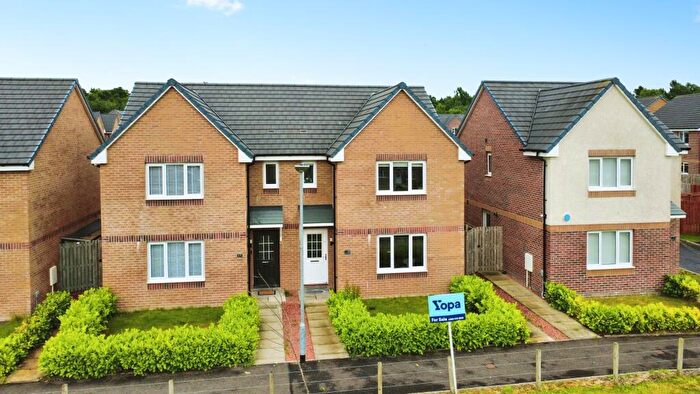
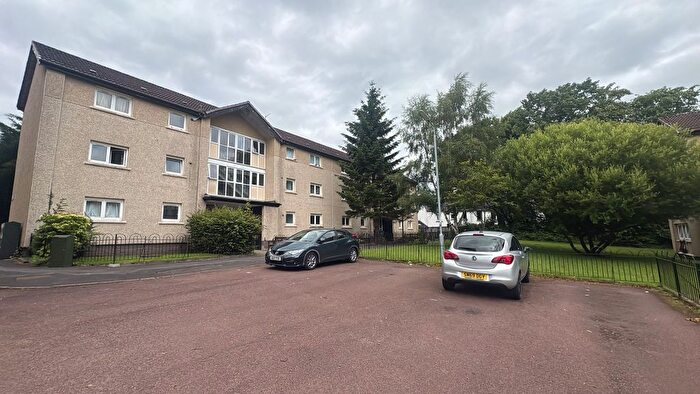
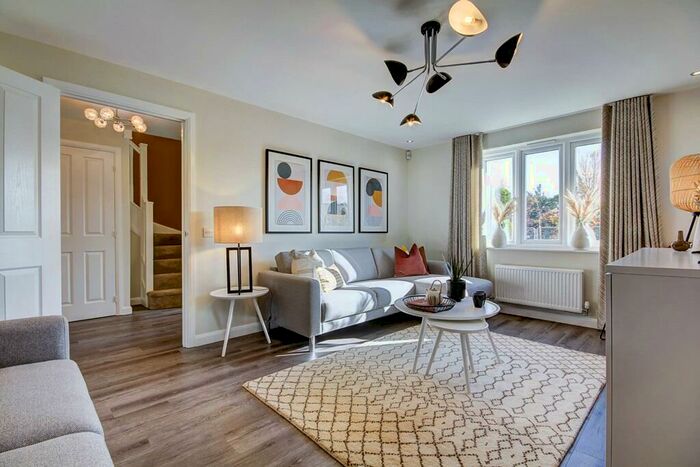
Properties for sale in East Renfrewshire

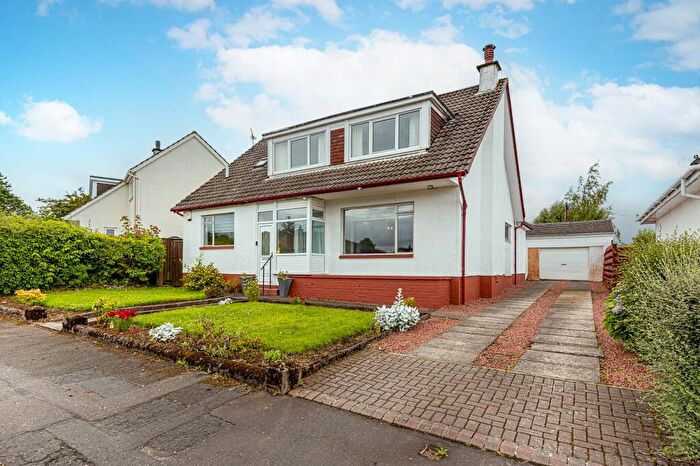
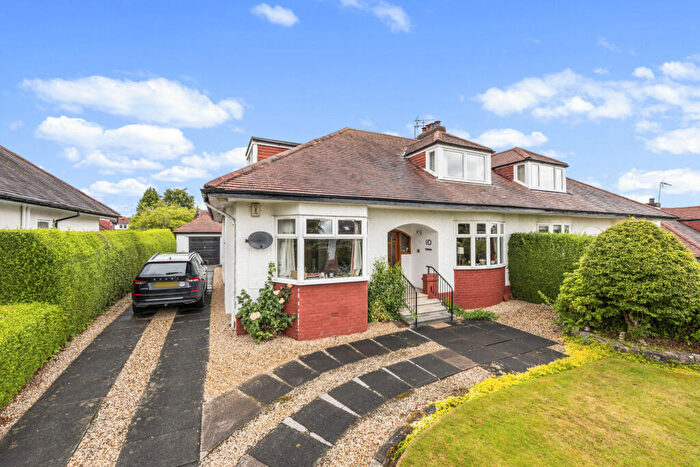

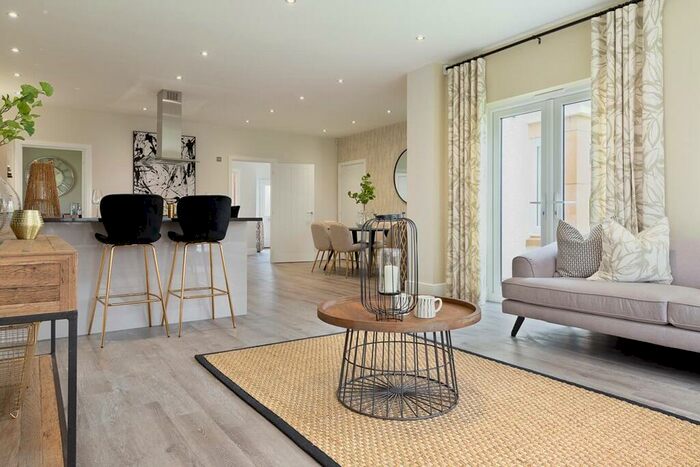
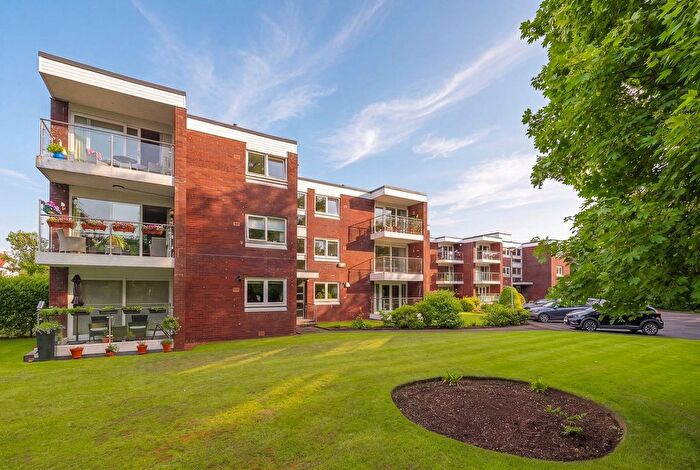
![]()
If you are looking to sell your house, let it out, or receive a property valuation, an expert can help you.
Click the button below to get started.


Towns in East Renfrewshire
Navigate through our locations to find the location of your next house in East Renfrewshire, Scotland for sale or to rent.
Property price trends in East Renfrewshire
According to the latest Registers of Scotland data, the average home in East Renfrewshire sold for £334,942 in 2026. That figure comes from a substantial record of 38,177 sales logged over the past 25 years.
Prices have continued to climb over the last three years. Compared with 2023, when the typical sale came in around £305,767, that's a rise of roughly 9.5%.
Looking back five years, average prices are up about 16.1% since 2021, a gain of around £46,496 in cash terms.
Zoom out to the past decade for the fuller picture. Back in 2016, homes here averaged £247,327, so the typical sold price has climbed about 35.4% since then, roughly 3.1% a year. Stretch the view to fifteen years and that annual pace holds at about 3.2%.
Frequently asked questions about East Renfrewshire
What is the average price for a property for sale in East Renfrewshire?
The average price for a property for sale in East Renfrewshire is £316,850. This amount is 57% higher than the average price in Scotland. There are more than 10,000 property listings for sale in East Renfrewshire.
Which train stations are available in or near East Renfrewshire?
Some of the train stations available in or near East Renfrewshire are Patterton, Whitecraigs and Williamwood.
Property Price Paid in East Renfrewshire by Year
The average sold property price by year was:
| Year | Average Sold Price | Price Change |
Sold Properties
|
|---|---|---|---|
| 2026 | £334,942 | 1% |
120 Properties |
| 2025 | £332,183 | 6% |
664 Properties |
| 2024 | £311,611 | 2% |
676 Properties |
| 2023 | £305,767 | -1% |
795 Properties |
| 2022 | £307,556 | 6% |
1,782 Properties |
| 2021 | £288,446 | 5% |
1,955 Properties |
| 2020 | £274,472 | 7% |
1,524 Properties |
| 2019 | £255,233 | -3% |
1,761 Properties |
| 2018 | £263,727 | 4% |
1,723 Properties |
| 2017 | £253,222 | 2% |
1,776 Properties |
Transport in East Renfrewshire
Please see below transportation links in this area:
