
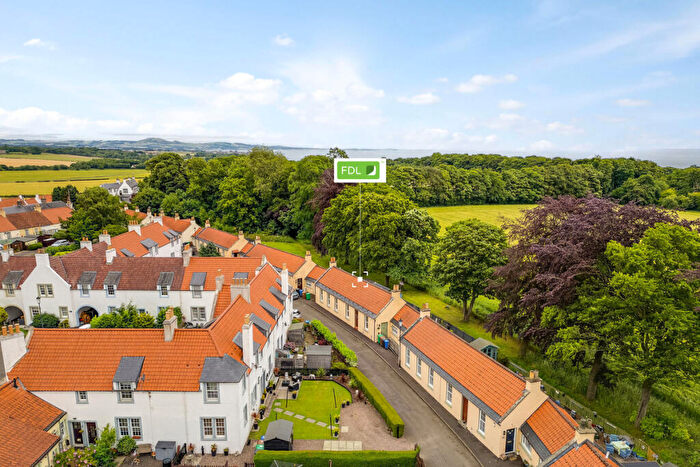
Houses for sale in Cupar, Fife
House Prices in Cupar
Properties in Cupar have an average house price of £202k and had 634 Property Transactions within the last 3 years.¹
Cupar is an area in Fife with 12,495 households², where the most expensive property was sold for £875k.
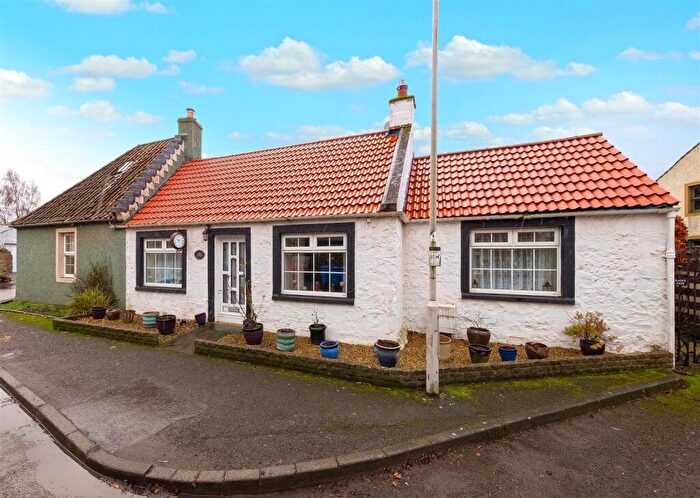
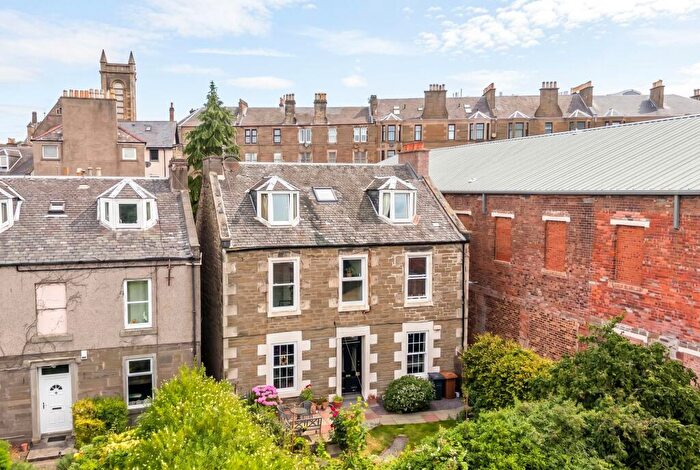
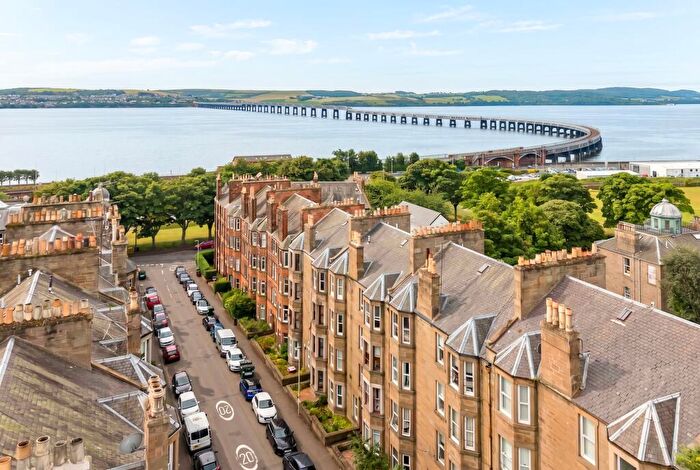
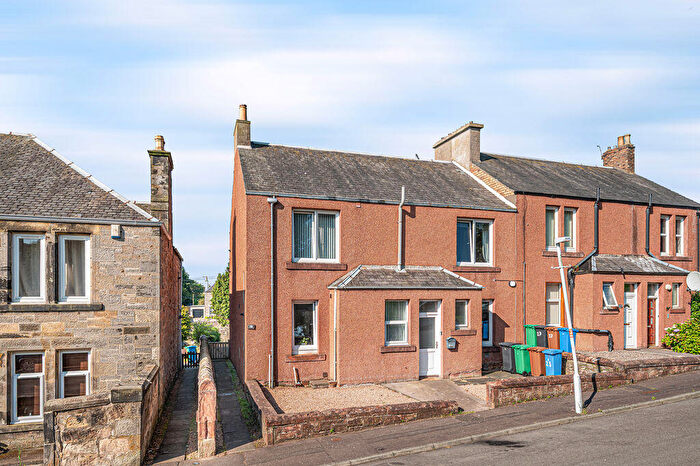
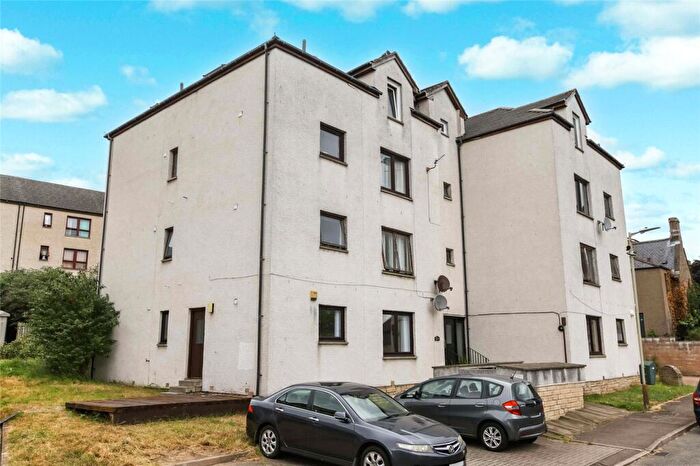
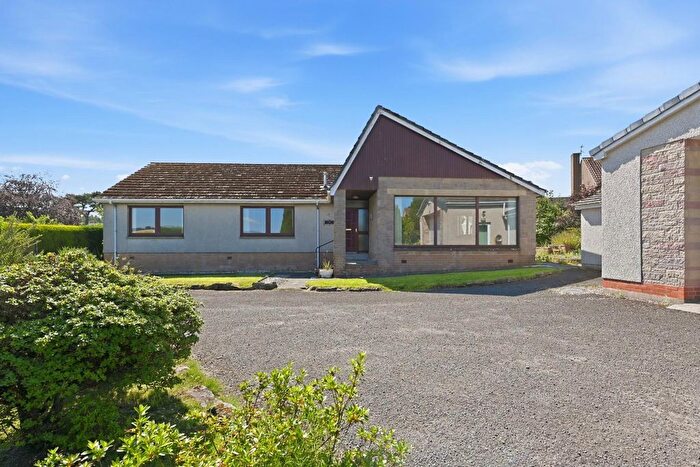
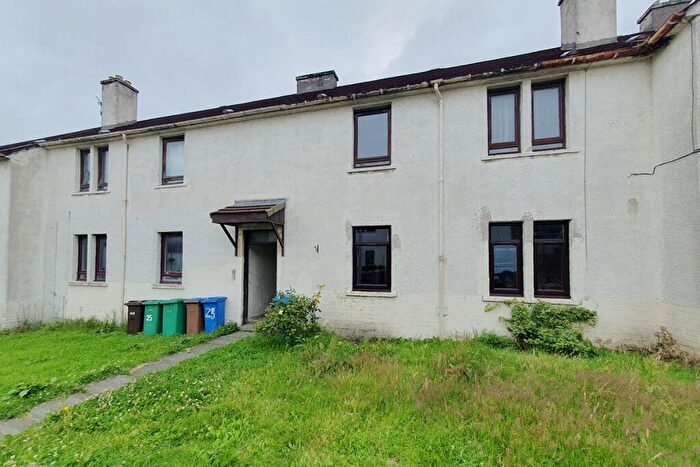
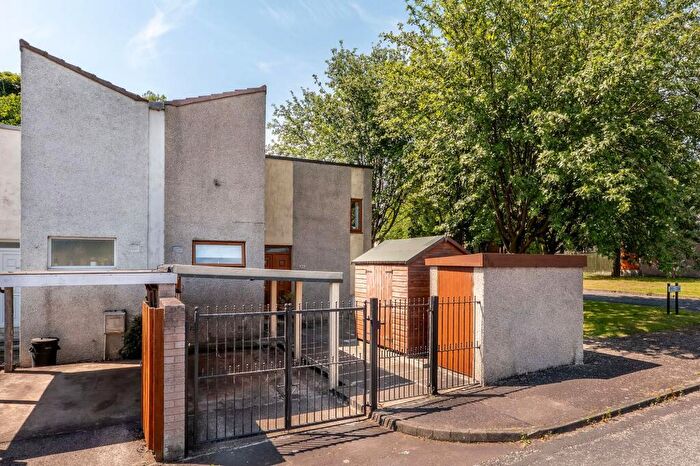
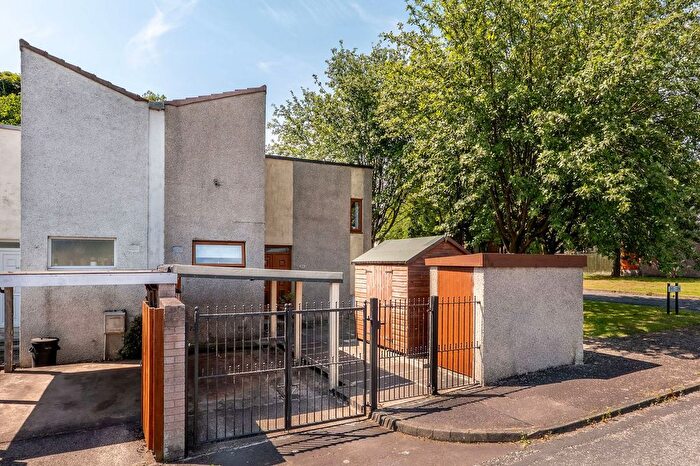
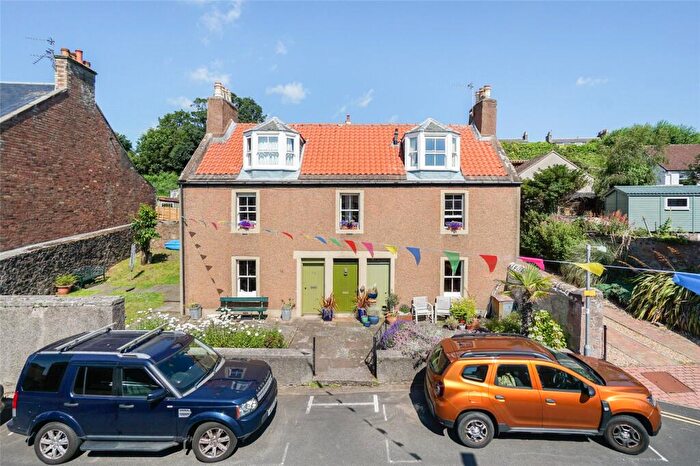
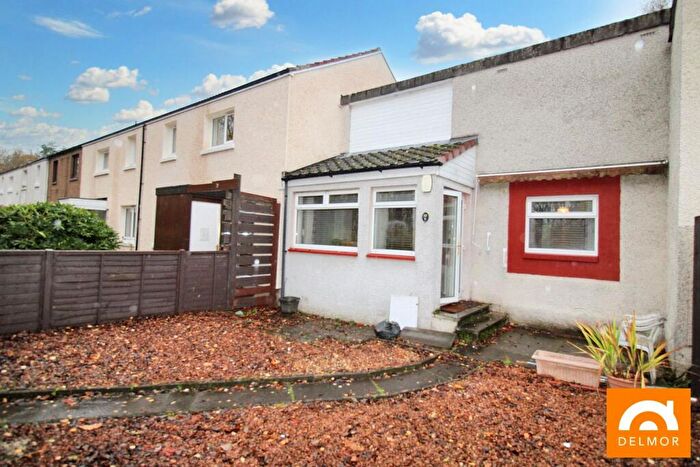
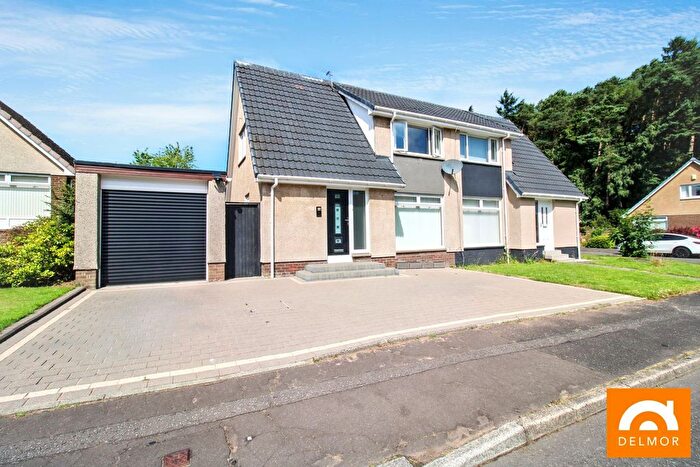
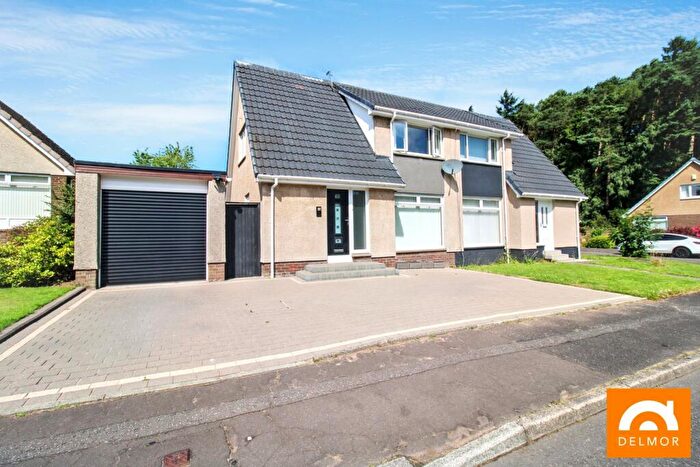
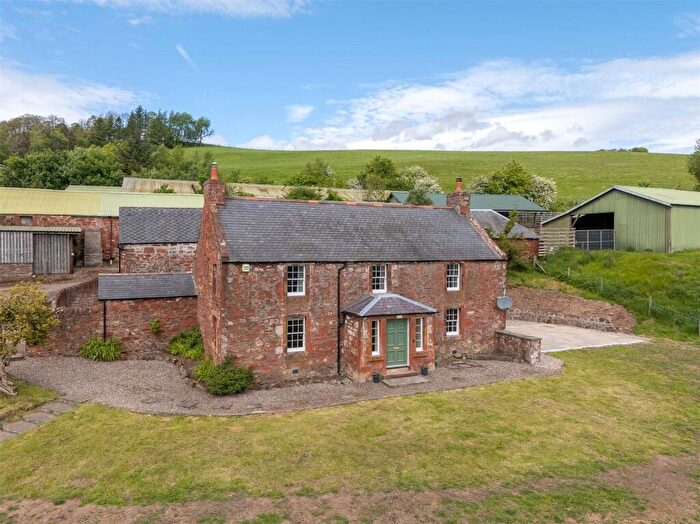
Properties for sale in Cupar
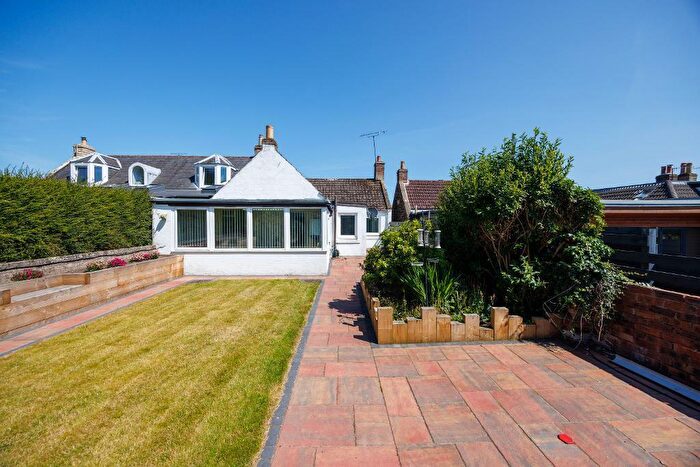
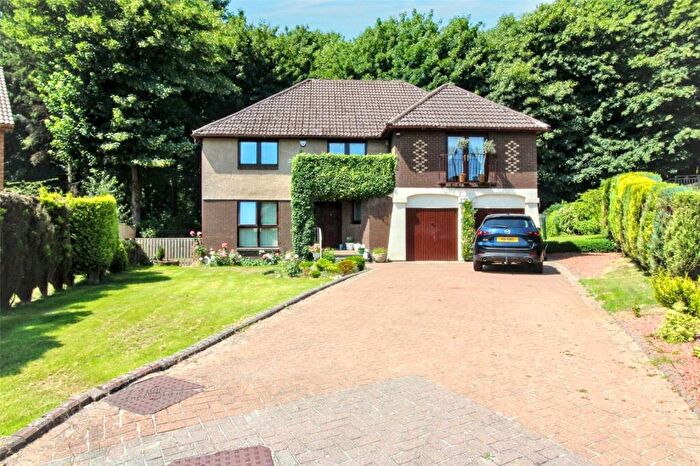
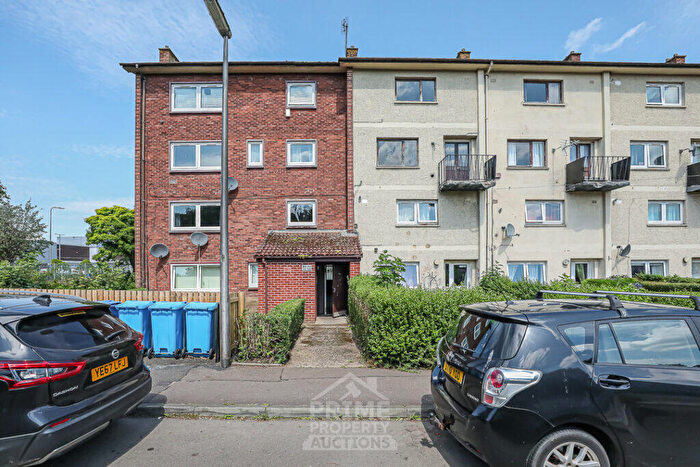
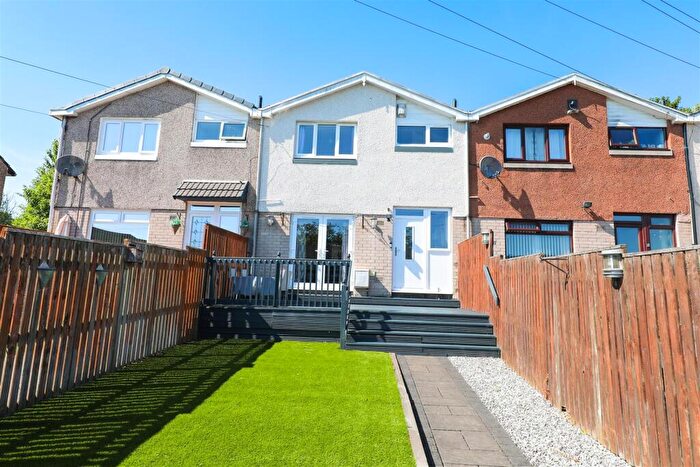
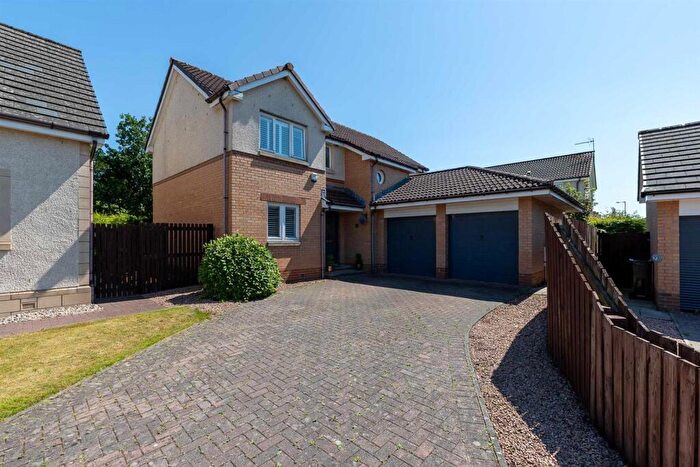
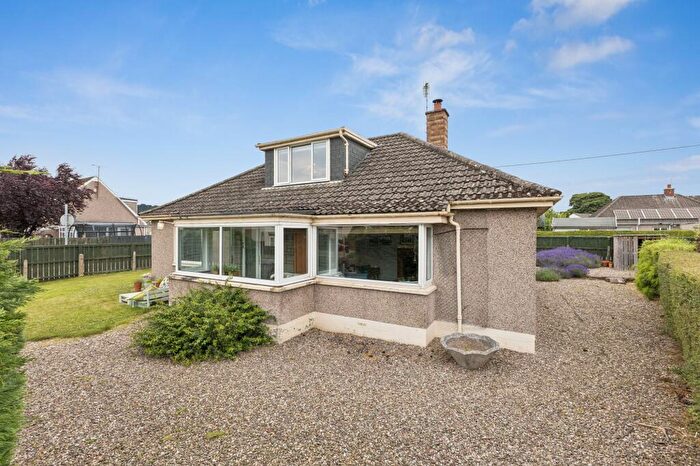
![]()
If you are looking to sell your house, let it out, or receive a property valuation, an expert can help you.
Click the button below to get started.
Neighbourhoods in Cupar
Navigate through our locations to find the location of your next house in Cupar, Fife for sale or to rent.
Property price trends in Cupar
According to the latest Registers of Scotland data, the average home in Cupar sold for £214,456 in 2025. That figure comes from a substantial record of 11,837 sales logged over the past 24 years.
Prices have fallen back over the last three years. Compared with 2022, when the typical sale came in around £229,067, that's a fall of roughly 6.4%.
Looking back five years, average prices are up about 9.2% since 2020, a gain of around £18,099 in cash terms.
Zoom out to the past decade for the fuller picture. Back in 2015, homes here averaged £159,808, so the typical sold price has climbed about 34.2% since then, roughly 3% a year. Stretch the view to fifteen years and that annual pace eases back to about 1.6%.
Frequently asked questions about Cupar
What is the average price for a property for sale in Cupar?
The average price for a property for sale in Cupar is £202,403. This amount is 10% higher than the average price in Fife. There are more than 10,000 property listings for sale in Cupar.
What locations have the most expensive properties for sale in Cupar?
The location with the most expensive properties for sale in Cupar is Cupar at an average of £204,832.
What locations have the most affordable properties for sale in Cupar?
The location with the most affordable properties for sale in Cupar is Howe of Fife and Tay Coast at an average of £199,262.
Which train stations are available in or near Cupar?
Some of the train stations available in or near Cupar are Springfield, Ladybank and Cupar.
Property Price Paid in Cupar by Year
The average sold property price by year was:
| Year | Average Sold Price | Price Change |
Sold Properties
|
|---|---|---|---|
| 2025 | £214,456 | 11% |
199 Properties |
| 2024 | £191,860 | -5% |
201 Properties |
| 2023 | £201,209 | -14% |
234 Properties |
| 2022 | £229,067 | 8% |
471 Properties |
| 2021 | £210,969 | 7% |
585 Properties |
| 2020 | £196,357 | 0,4% |
465 Properties |
| 2019 | £195,546 | 8% |
491 Properties |
| 2018 | £180,507 | 3% |
540 Properties |
| 2017 | £175,416 | -3% |
525 Properties |
| 2016 | £180,378 | 11% |
530 Properties |
Transport in Cupar
Please see below transportation links in this area:
