
Houses for sale & to rent in KY12 0TL, Wallace Place, Dunfermline North, Dunfermline
House Prices in KY12 0TL, Wallace Place, Dunfermline North
Properties in KY12 0TL have no sales history available within the last 3 years. KY12 0TL is a postcode in Wallace Place located in Dunfermline North, an area in Dunfermline, Fife, with 10 households².
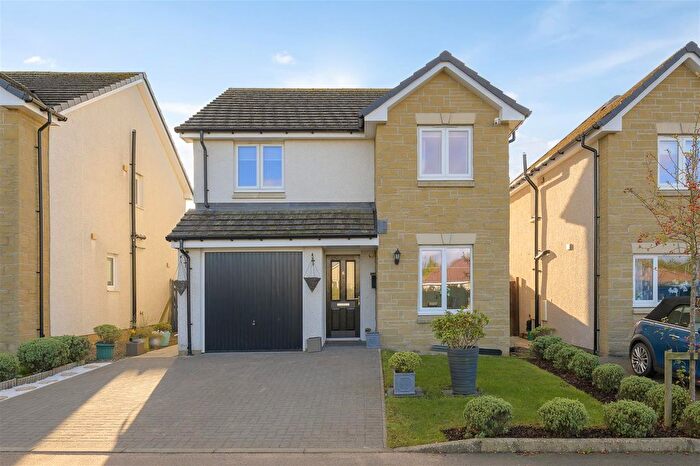
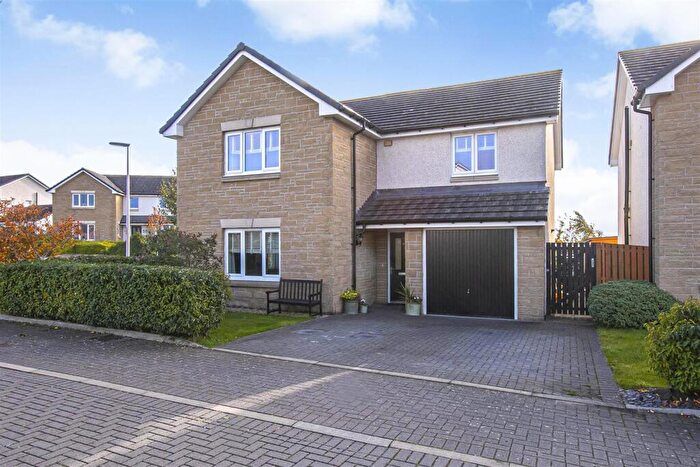
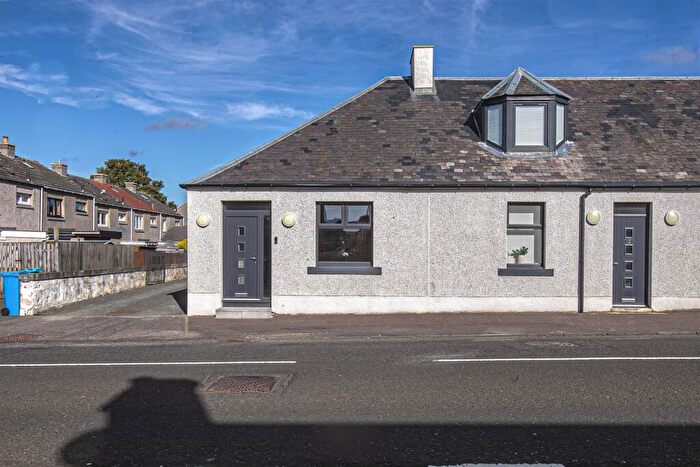
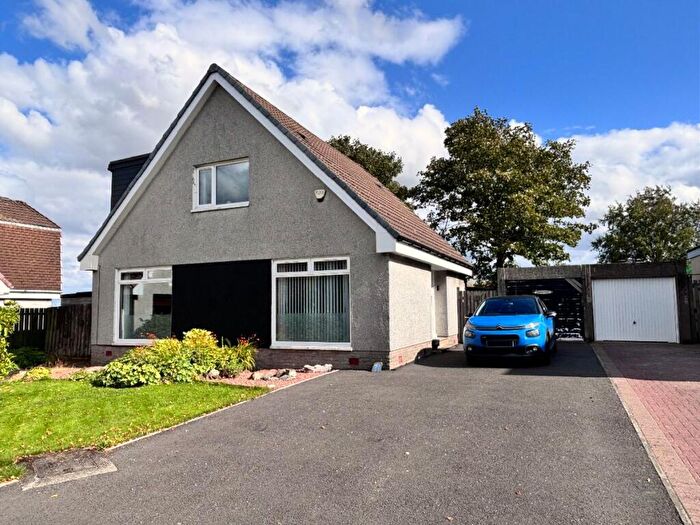
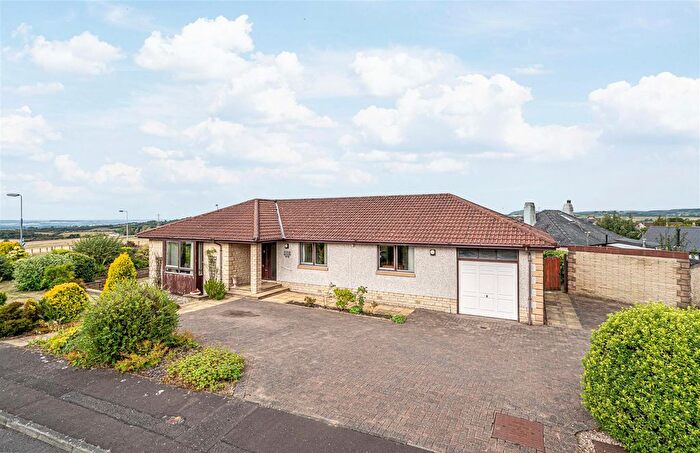
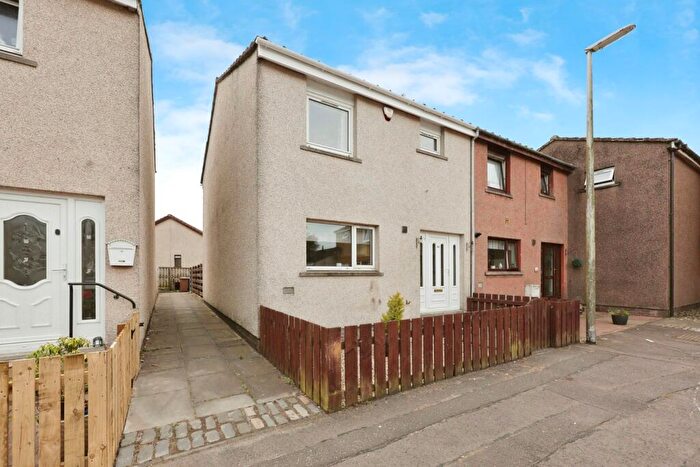
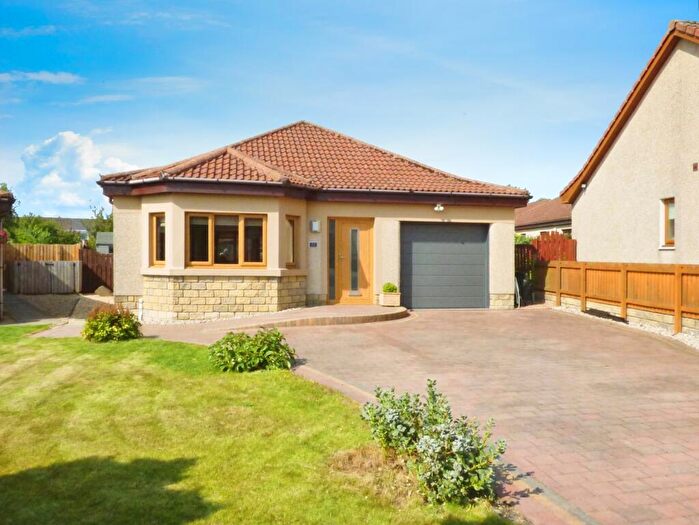
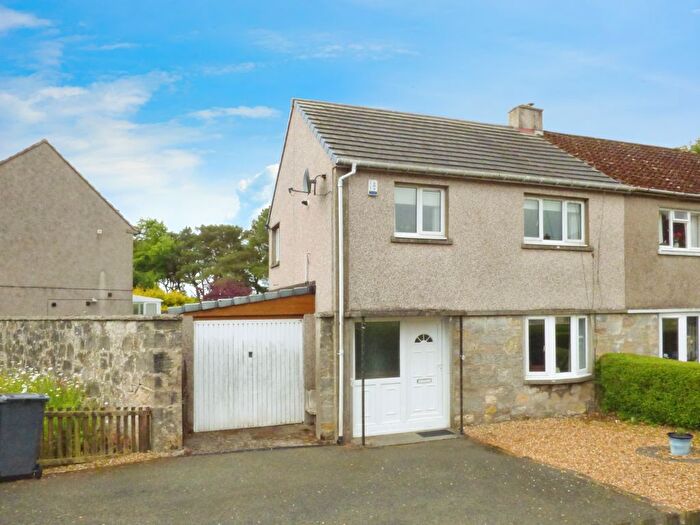
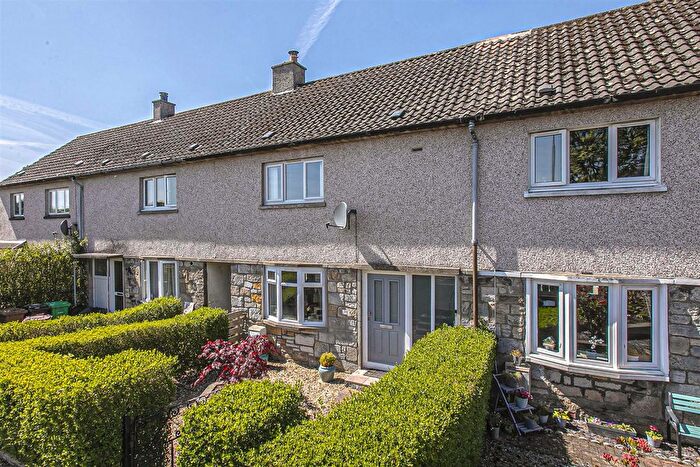
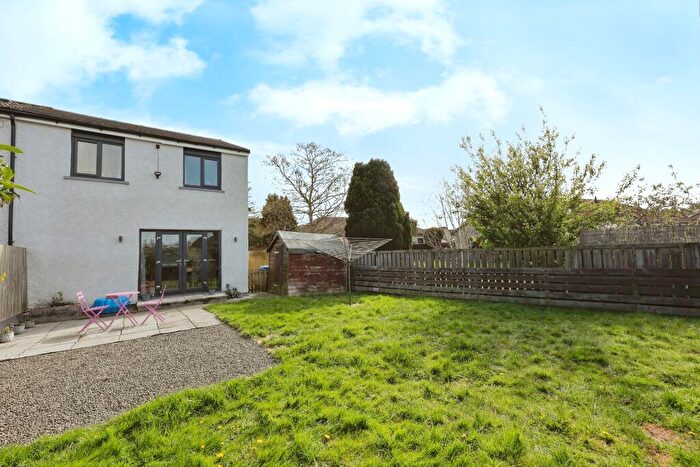
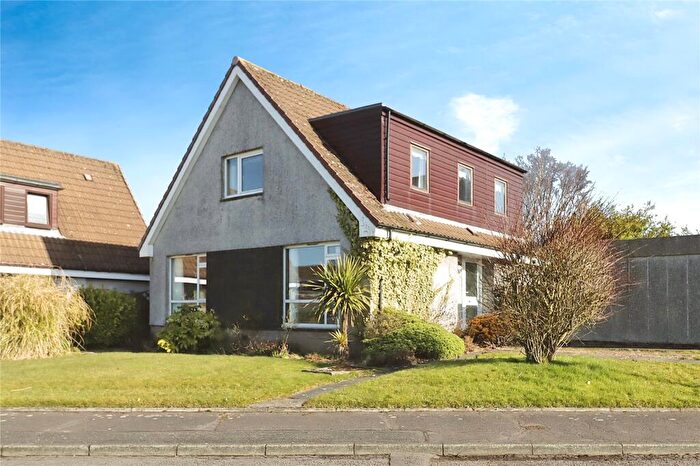
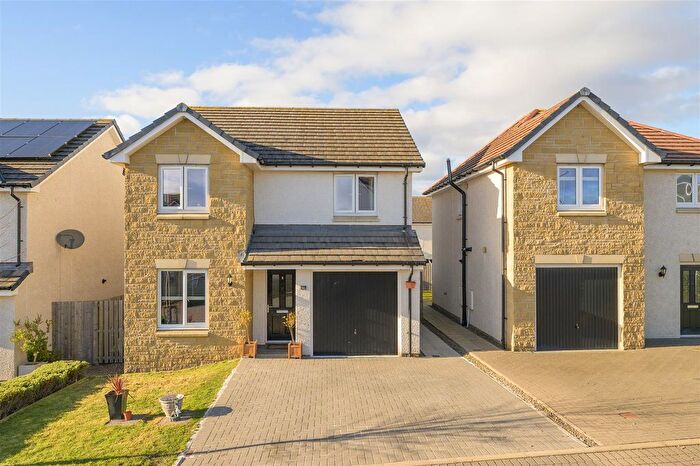
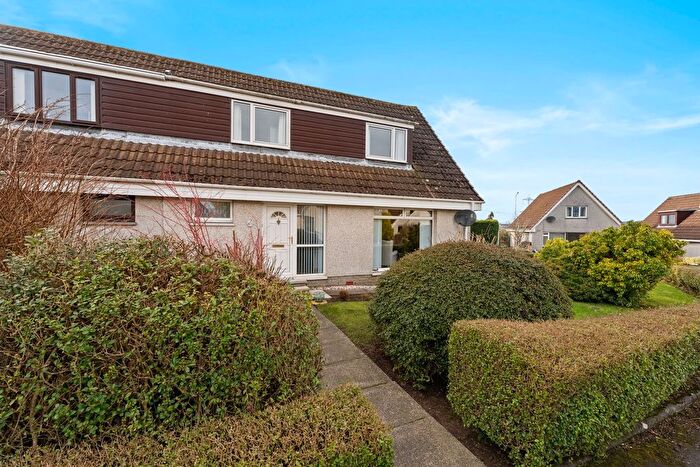
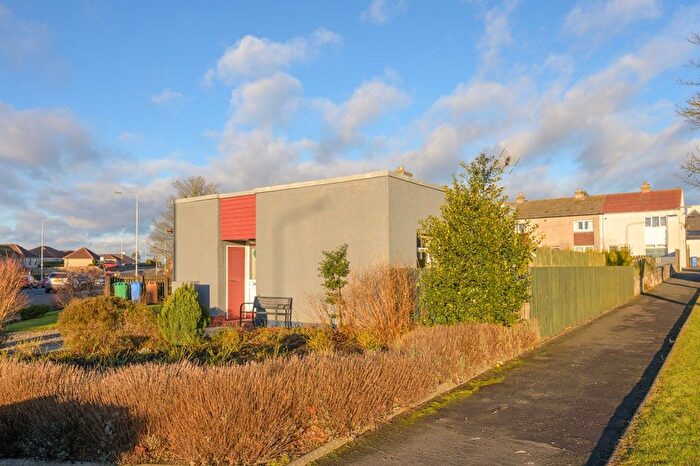
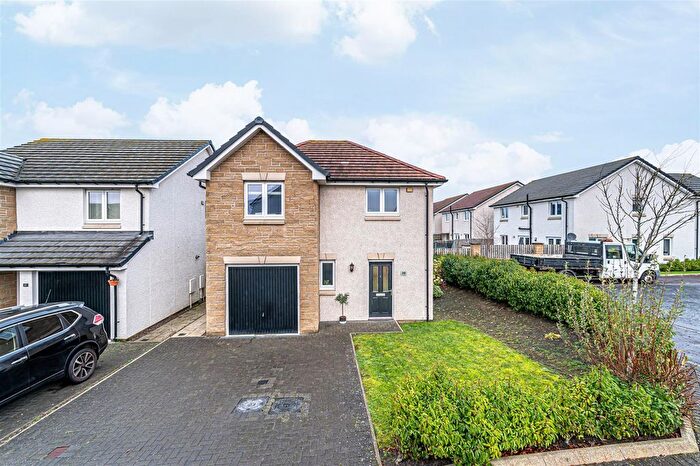
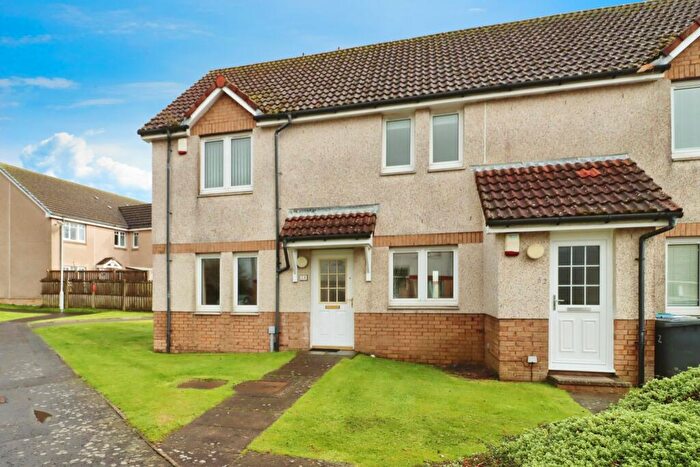
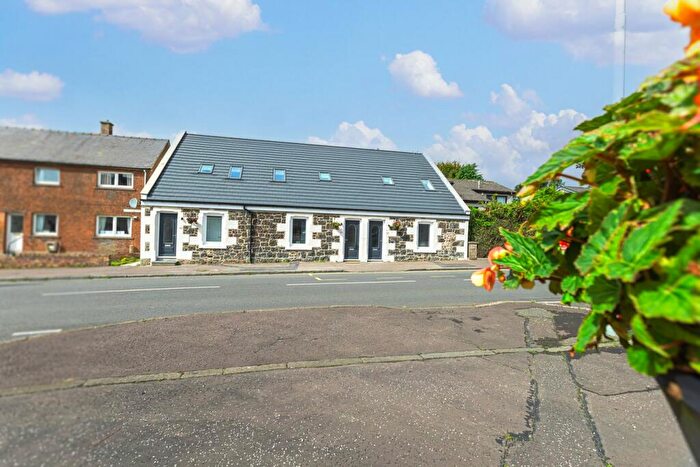
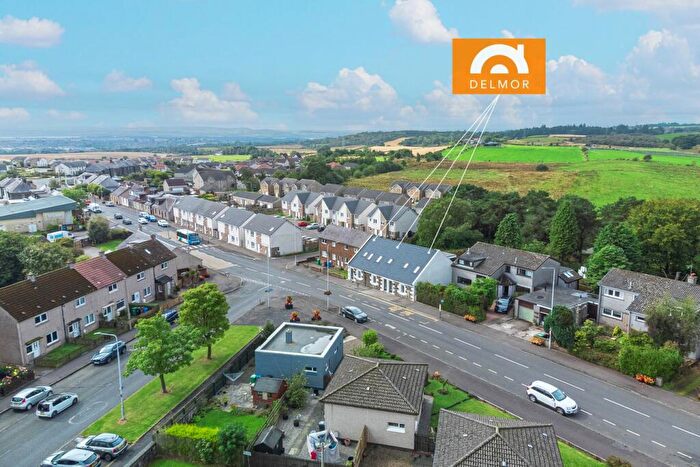
Properties for sale near KY12 0TL, Wallace Place
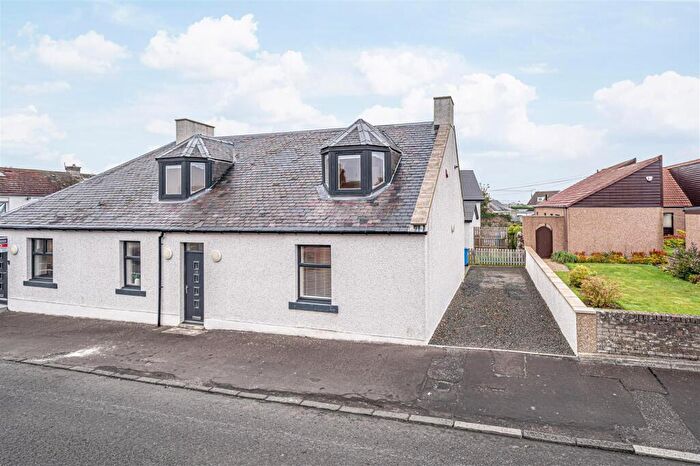
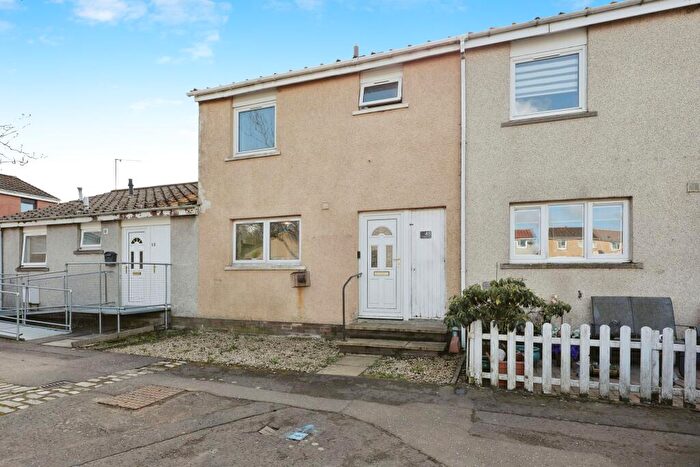
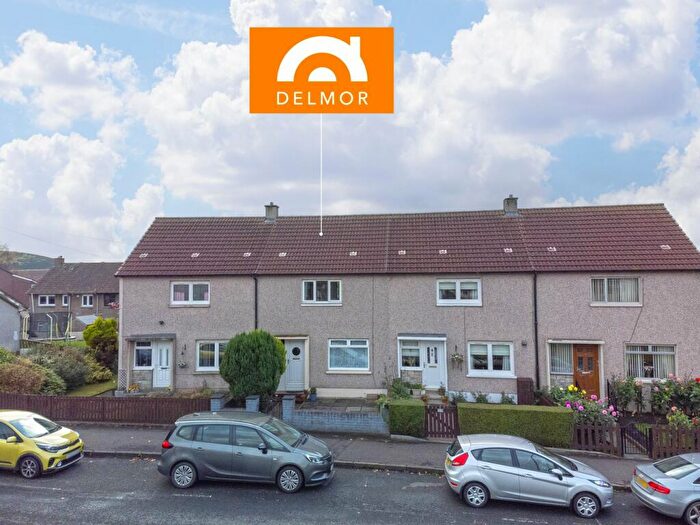
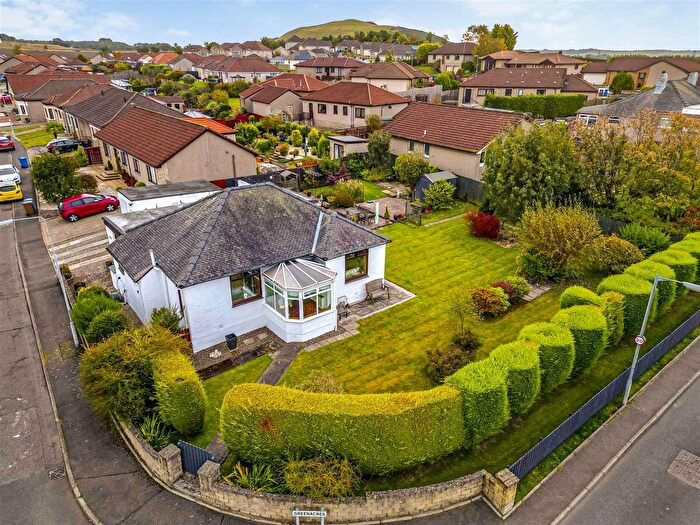
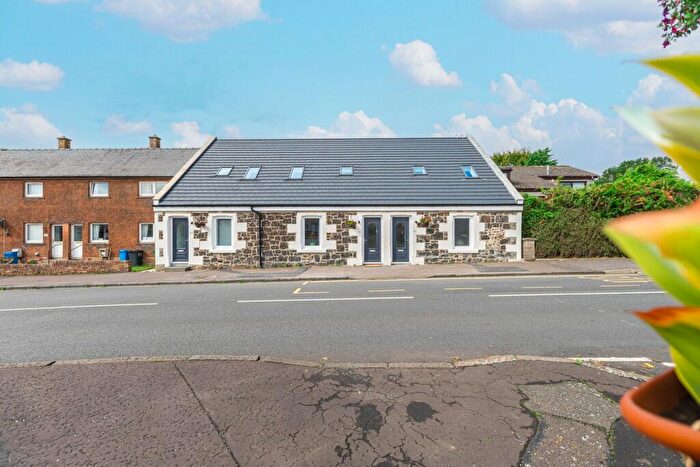
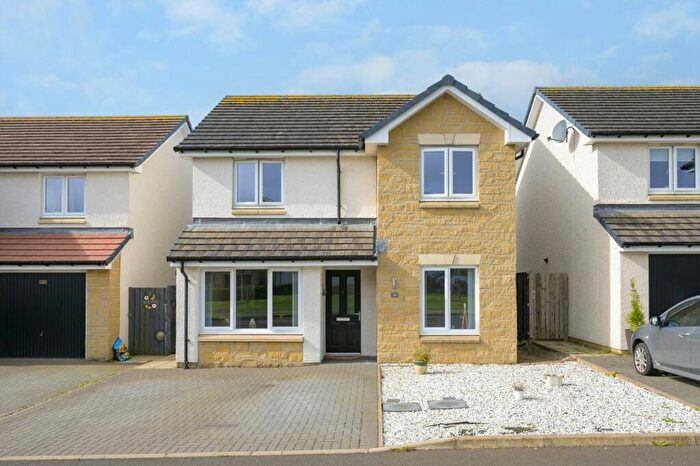
Previously listed properties near KY12 0TL, Wallace Place
![]()
If you are looking to sell your house, let it out, or receive a property valuation, an expert can help you.
Click the button below to get started.
Price Paid in Wallace Place, KY12 0TL, Dunfermline North
1a Wallace Place, KY12 0TL, Dunfermline North Dunfermline
Property 1a has been sold 3 times. The last time it was sold was in 26/04/2021 and the sold price was £260,000.00.
This is a Property which was sold as an Established Building in 26/04/2021
| Date | Price | Classification |
|---|---|---|
| 26/04/2021 | £260,000.00 | Established Building |
| 20/01/2014 | £204,000.00 | Established Building |
| 14/04/2003 | £130,000.00 | Established Building |
9 Wallace Place, KY12 0TL, Dunfermline North Dunfermline
Property 9 has been sold 4 times. The last time it was sold was in 03/11/2020 and the sold price was £106,249.00.
This is a Property which was sold as an Established Building in 03/11/2020
| Date | Price | Classification |
|---|---|---|
| 03/11/2020 | £106,249.00 | Established Building |
| 01/05/2015 | £90,000.00 | Established Building |
| 12/02/2007 | £85,000.00 | Established Building |
| 20/06/2003 | £9,000.00 | Established Building |
5 Wallace Place, KY12 0TL, Dunfermline North Dunfermline
Property 5 has been sold 1 time. The last time it was sold was in 26/07/2006 and the sold price was £83,000.00.
This is a Property which was sold as an Established Building in 26/07/2006
| Date | Price | Classification |
|---|---|---|
| 26/07/2006 | £83,000.00 | Established Building |
Transport near KY12 0TL, Wallace Place

House price paid reports for KY12 0TL, Wallace Place
Click on the buttons below to see price paid reports by year or property price:
- Price Paid By Year
Property Price Paid in KY12 0TL, Wallace Place by Year
The average sold property price by year was:
| Year | Average Sold Price | Price Change |
Sold Properties
|
|---|---|---|---|
| 2021 | £260,000 | 59% |
1 Property |
| 2020 | £106,249 | 15% |
1 Property |
| 2015 | £90,000 | -127% |
1 Property |
| 2014 | £204,000 | 58% |
1 Property |
| 2007 | £85,000 | 2% |
1 Property |
| 2006 | £83,000 | 16% |
1 Property |
| 2003 | £69,500 | - |
2 Properties |