
Houses for sale & to rent in KY11 8DE, Dymond Grove, Dunfermline South, Dunfermline
House Prices in KY11 8DE, Dymond Grove, Dunfermline South
Properties in KY11 8DE have an average house price of £253k and had 2 Property Transactions within the last 3 years.¹ KY11 8DE is a postcode in Dymond Grove located in Dunfermline South, an area in Dunfermline, Fife, with 32 households², where the most expensive property was sold for £260k.
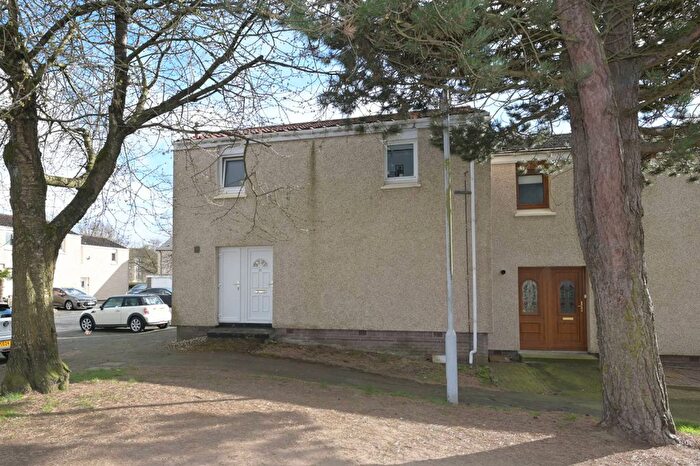
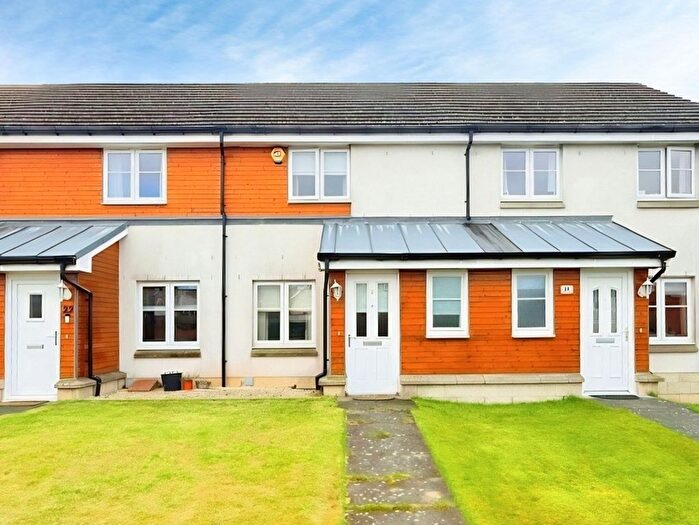
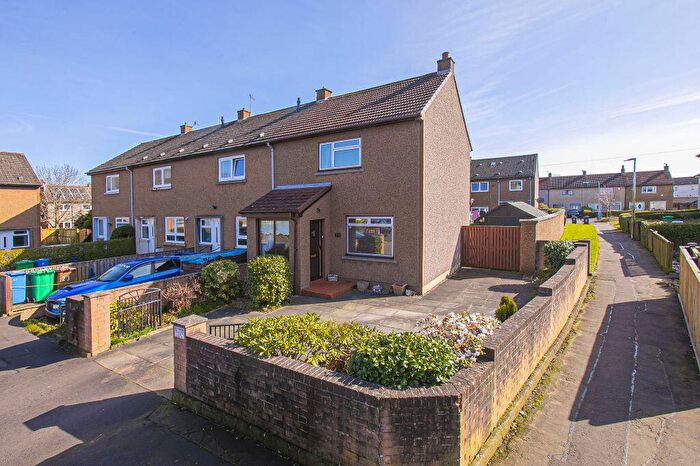
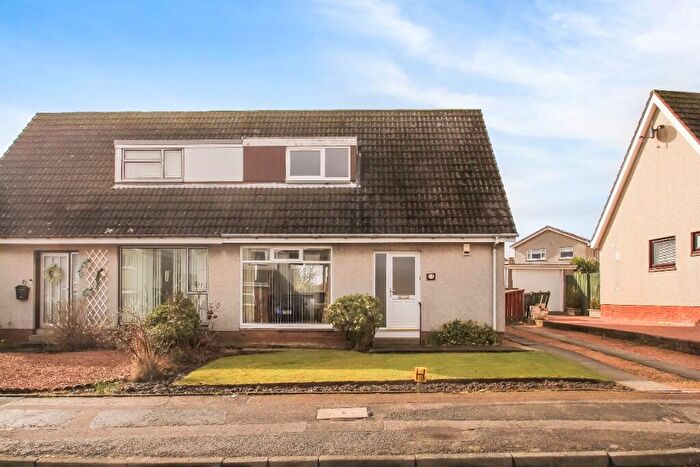
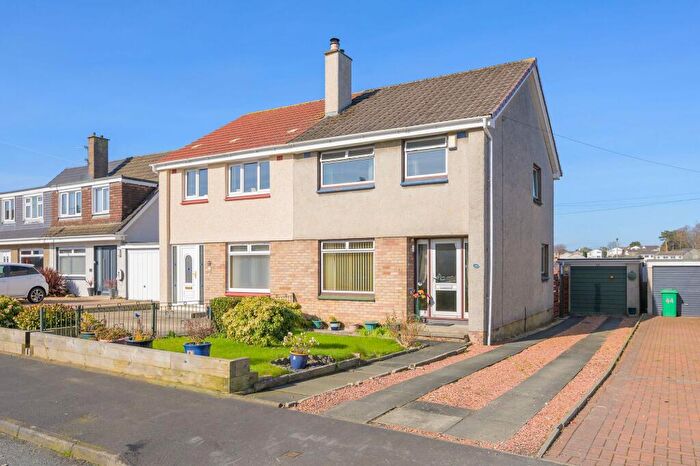
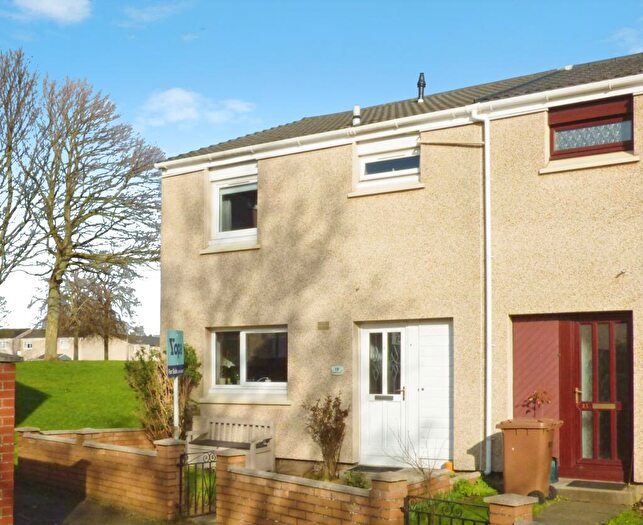
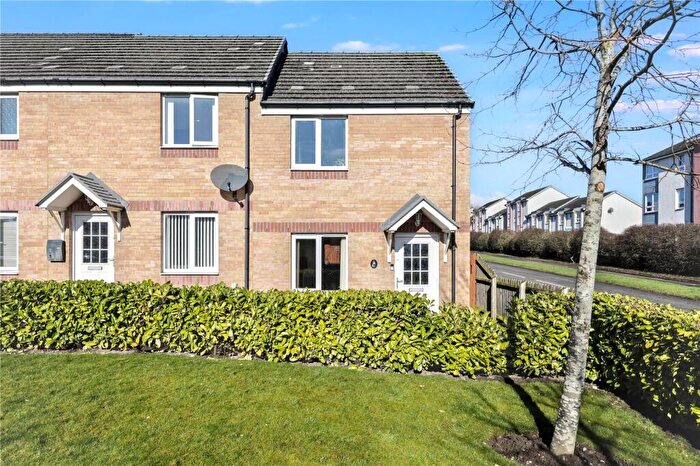
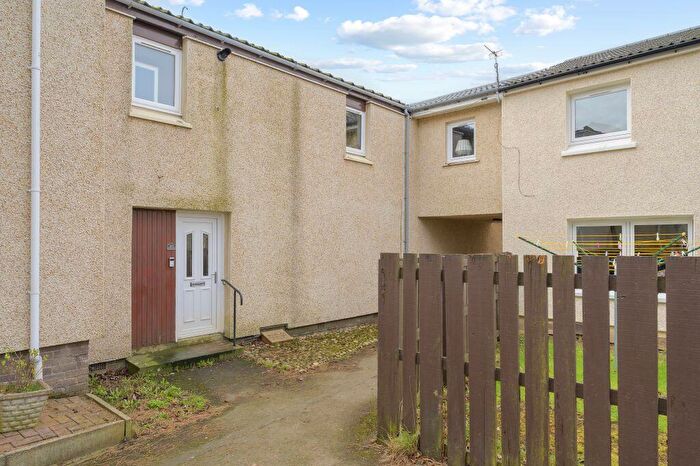
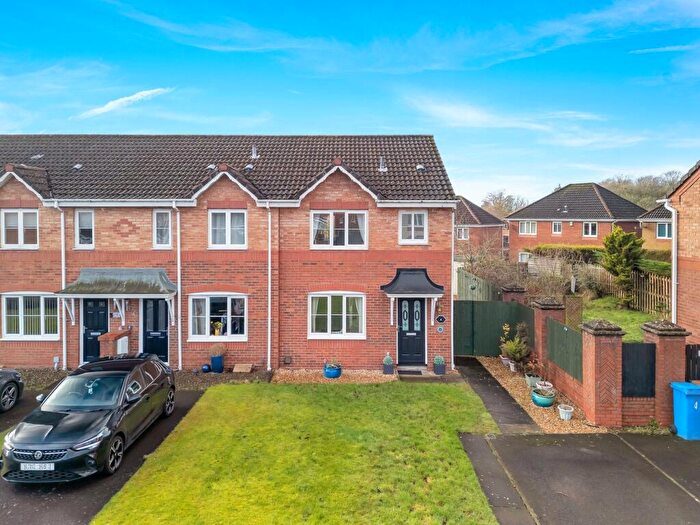
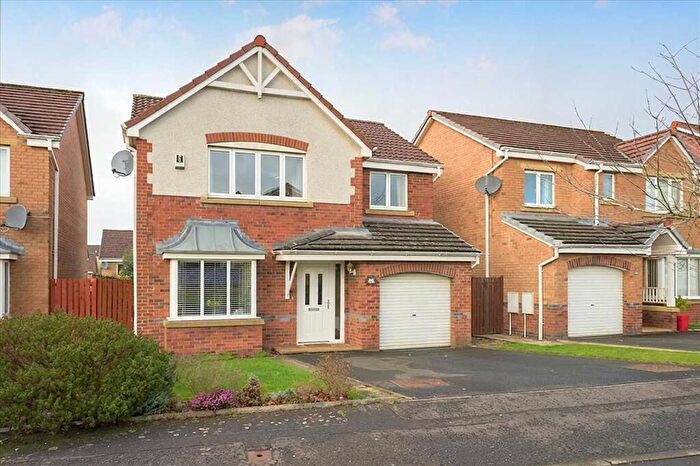
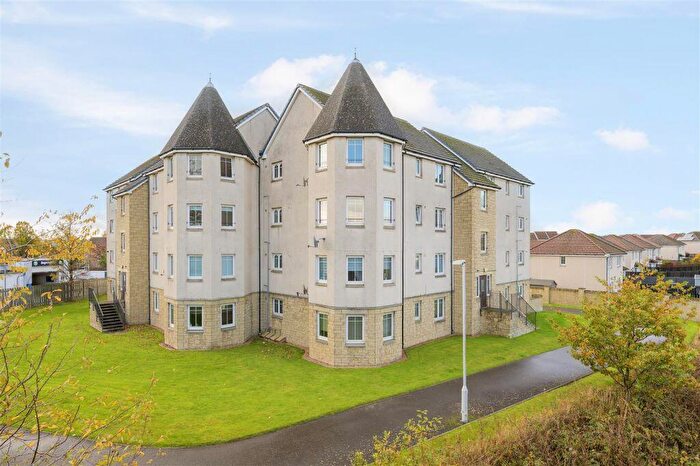
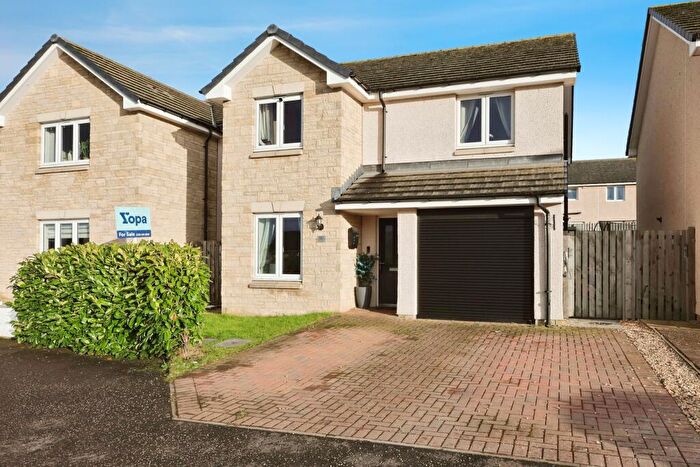
Properties for sale near KY11 8DE, Dymond Grove
![]()
If you are looking to sell your house, let it out, or receive a property valuation, an expert can help you.
Click the button below to get started.
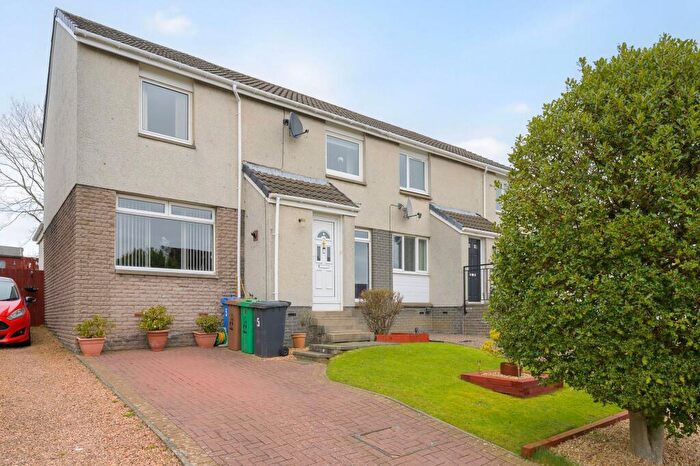
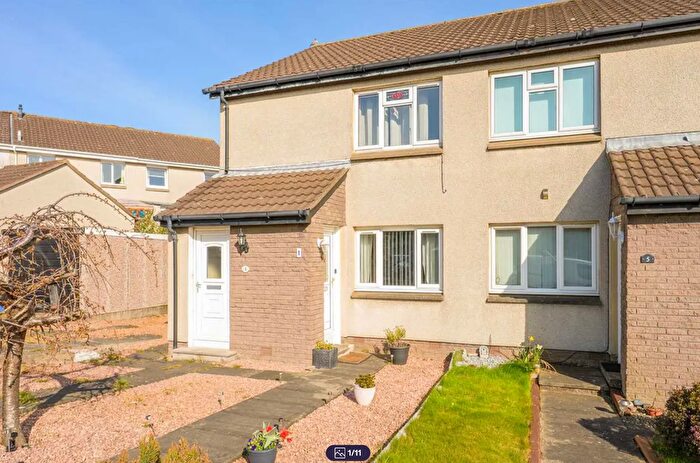
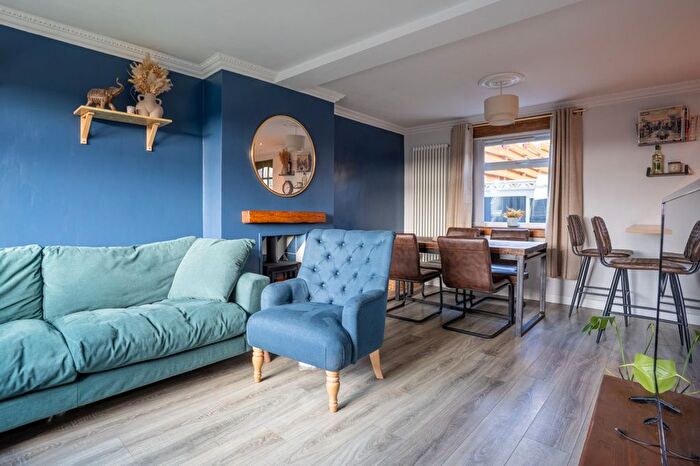
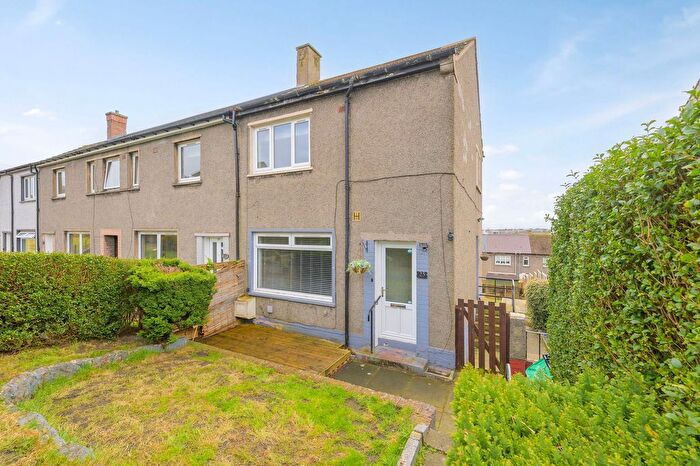
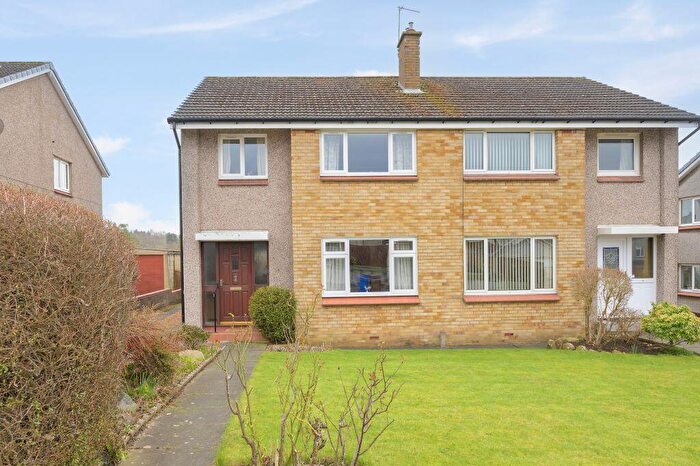
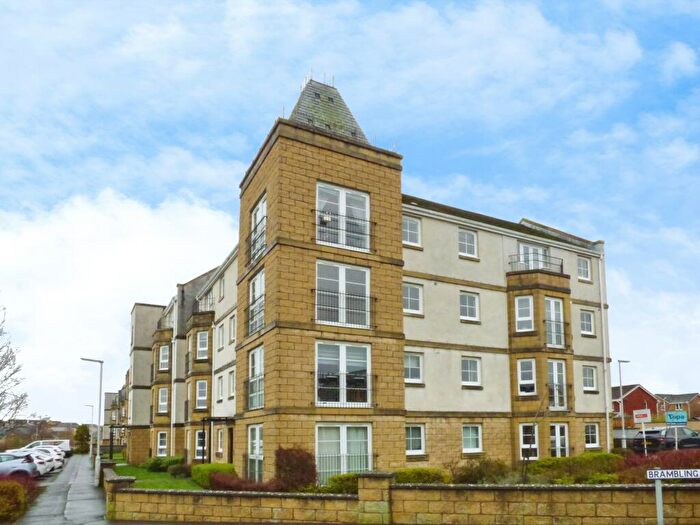
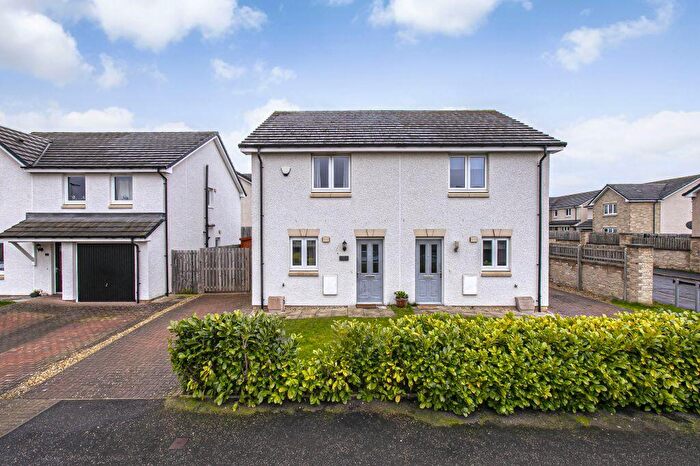
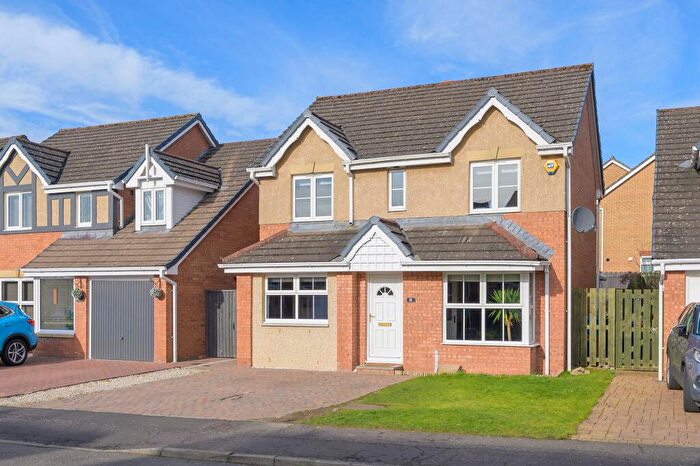
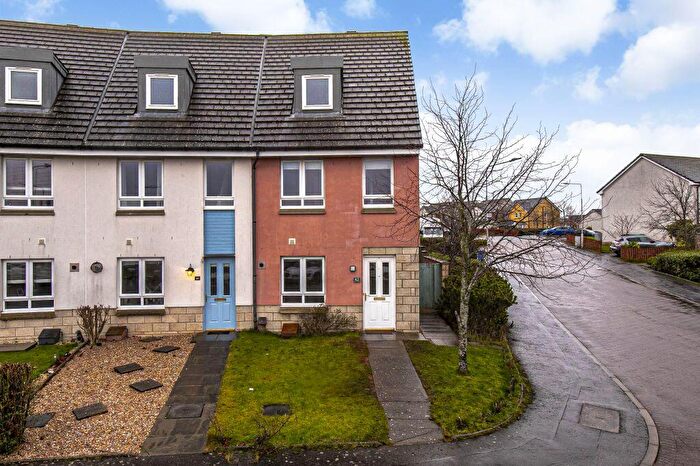
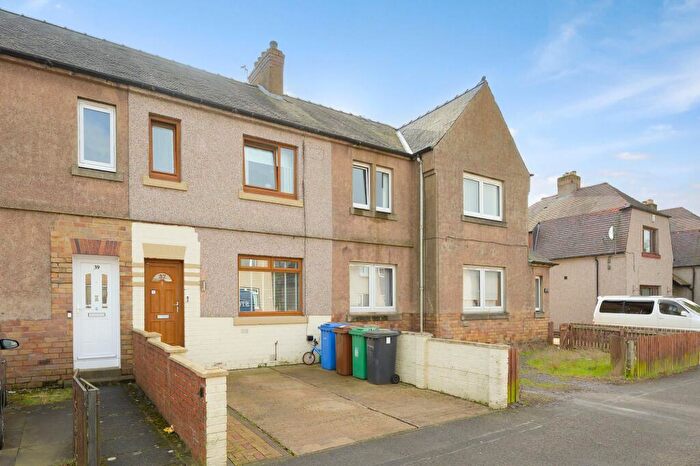
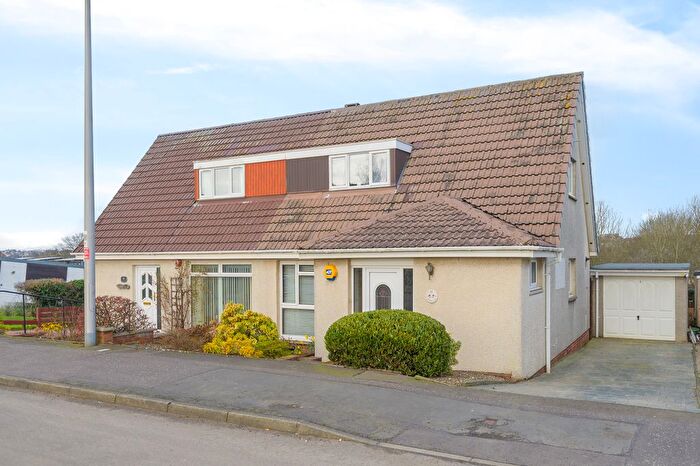
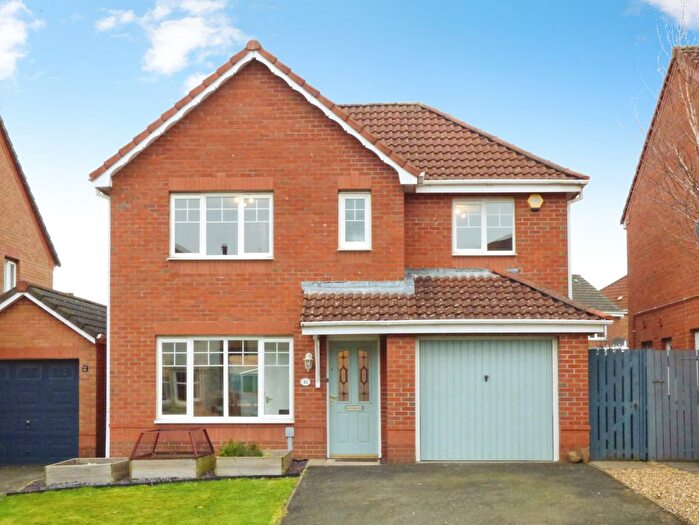
Previously listed properties near KY11 8DE, Dymond Grove
![]()
If you are looking to sell your house, let it out, or receive a property valuation, an expert can help you.
Click the button below to get started.
Price Paid in Dymond Grove, KY11 8DE, Dunfermline South
17 Dymond Grove, KY11 8DE, Dunfermline South Dunfermline
Property 17 has been sold 4 times. The last time it was sold was in 19/03/2024 and the sold price was £245,000.00.
This is a Property which was sold as a New Build in 19/03/2024
| Date | Price | Classification |
|---|---|---|
| 19/03/2024 | £245,000.00 | New Build |
| 19/04/2019 | £190,000.00 | Established Building |
| 20/01/2015 | £168,000.00 | Established Building |
| 07/12/2004 | £125,000.00 | New Build |
3 Dymond Grove, KY11 8DE, Dunfermline South Dunfermline
Property 3 has been sold 2 times. The last time it was sold was in 12/07/2023 and the sold price was £260,000.00.
This is a Property which was sold as a New Build in 12/07/2023
| Date | Price | Classification |
|---|---|---|
| 12/07/2023 | £260,000.00 | New Build |
| 15/11/2022 | £224,000.00 | Established Building |
24 Dymond Grove, KY11 8DE, Dunfermline South Dunfermline
Property 24 has been sold 1 time. The last time it was sold was in 09/09/2022 and the sold price was £221,575.00.
This is a Property which was sold as an Established Building in 09/09/2022
| Date | Price | Classification |
|---|---|---|
| 09/09/2022 | £221,575.00 | Established Building |
5 Dymond Grove, KY11 8DE, Dunfermline South Dunfermline
Property 5 has been sold 4 times. The last time it was sold was in 18/10/2021 and the sold price was £230,000.00.
This is a Property which was sold as an Established Building in 18/10/2021
| Date | Price | Classification |
|---|---|---|
| 18/10/2021 | £230,000.00 | Established Building |
| 31/05/2018 | £177,500.00 | Established Building |
| 16/12/2011 | £150,000.00 | Established Building |
| 18/10/2006 | £138,500.00 | New Build |
15 Dymond Grove, KY11 8DE, Dunfermline South Dunfermline
Property 15 has been sold 3 times. The last time it was sold was in 15/03/2021 and the sold price was £182,000.00.
This is a Property which was sold as an Established Building in 15/03/2021
| Date | Price | Classification |
|---|---|---|
| 15/03/2021 | £182,000.00 | Established Building |
| 21/07/2016 | £138,000.00 | Established Building |
| 09/12/2010 | £120,000.00 | Established Building |
13 Dymond Grove, KY11 8DE, Dunfermline South Dunfermline
Property 13 has been sold 3 times. The last time it was sold was in 31/05/2018 and the sold price was £155,000.00.
This is a Property which was sold as an Established Building in 31/05/2018
| Date | Price | Classification |
|---|---|---|
| 31/05/2018 | £155,000.00 | Established Building |
| 18/05/2007 | £150,000.00 | New Build |
| 28/07/2004 | £125,000.00 | New Build |
38 Dymond Grove, KY11 8DE, Dunfermline South Dunfermline
Property 38 has been sold 2 times. The last time it was sold was in 05/06/2014 and the sold price was £183,000.00.
This is a Property which was sold as an Established Building in 05/06/2014
| Date | Price | Classification |
|---|---|---|
| 05/06/2014 | £183,000.00 | Established Building |
| 05/09/2013 | £170,558.00 | Established Building |
Transport near KY11 8DE, Dymond Grove
-
 Rosyth Station
 -
Dunfermline Queen Margaret Station
-
Dunfermline Station
-
Inverkeithing Station
-
Dalgety Bay Station
House price paid reports for KY11 8DE, Dymond Grove
Click on the buttons below to see price paid reports by year or property price:
- Price Paid By Year
Property Price Paid in KY11 8DE, Dymond Grove by Year
The average sold property price by year was:
| Year | Average Sold Price | Price Change |
Sold Properties
|
|---|---|---|---|
| 2024 | £245,000 | -6% |
1 Property |
| 2023 | £260,000 | 14% |
1 Property |
| 2022 | £222,787 | 8% |
2 Properties |
| 2021 | £206,000 | 8% |
2 Properties |
| 2019 | £190,000 | 13% |
1 Property |
| 2018 | £166,250 | 17% |
2 Properties |
| 2016 | £138,000 | -22% |
1 Property |
| 2015 | £168,000 | -9% |
1 Property |
| 2014 | £183,000 | 7% |
1 Property |
| 2013 | £170,558 | 12% |
1 Property |
| 2011 | £150,000 | 20% |
1 Property |
| 2010 | £120,000 | -25% |
1 Property |
| 2007 | £150,000 | 8% |
1 Property |
| 2006 | £138,500 | 10% |
1 Property |
| 2004 | £125,000 | - |
2 Properties |