
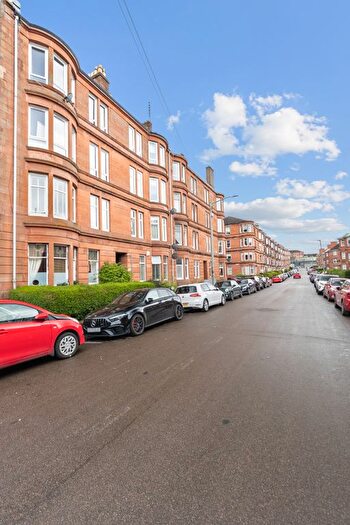
Houses for sale & to rent in Pollokshields, Glasgow
House Prices in Pollokshields
Properties in Pollokshields have an average house price of £343k and had 407 Property Transactions within the last 3 years¹.
Pollokshields is an area in Glasgow, Glasgow City with 12,107 households², where the most expensive property was sold for £1.6M.
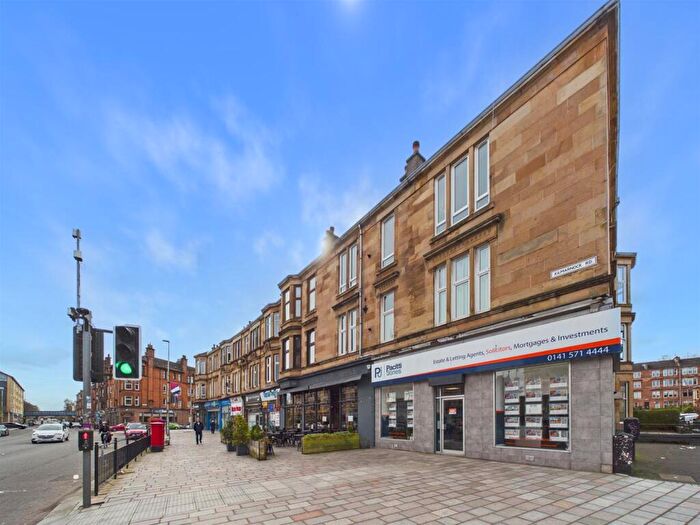
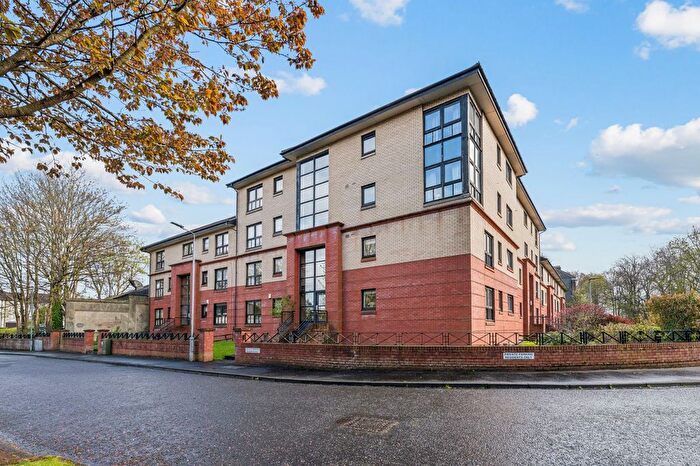
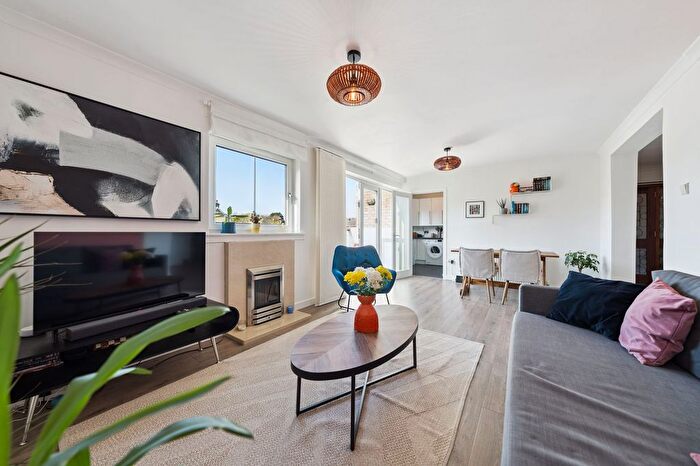
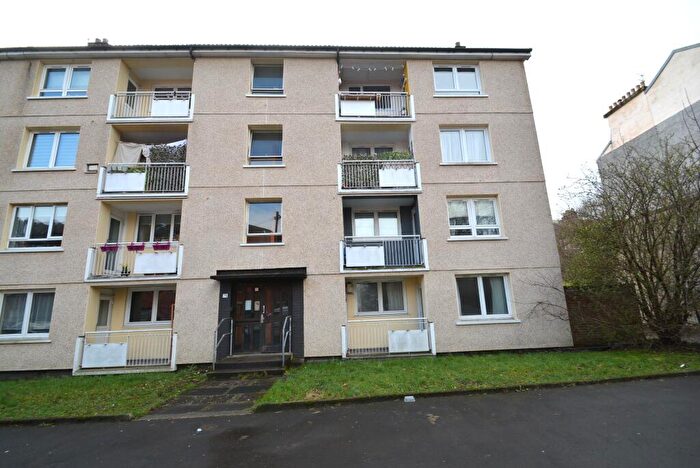
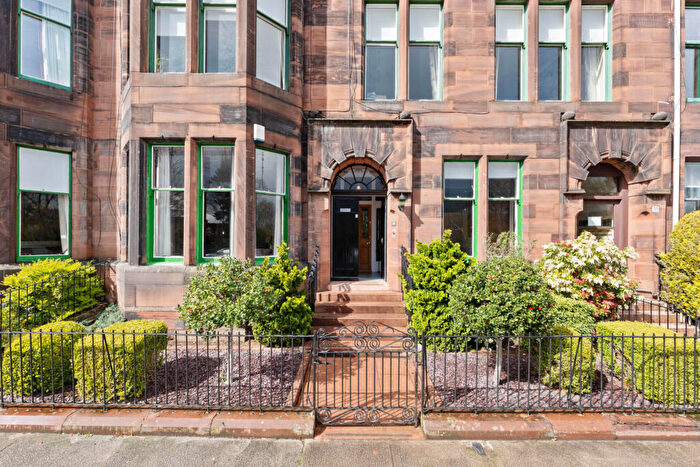
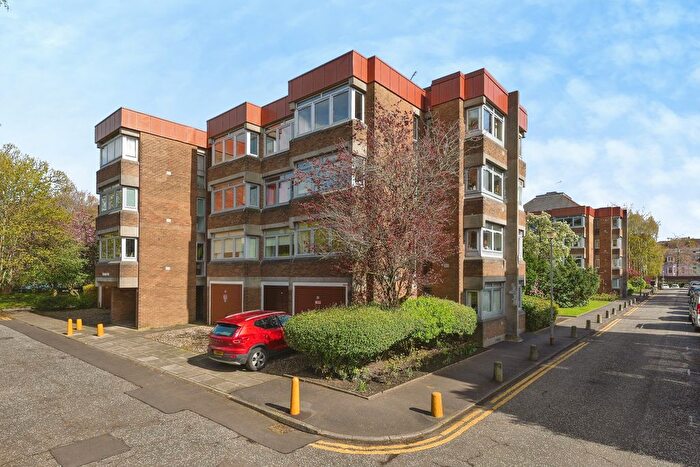
Properties for sale in Pollokshields
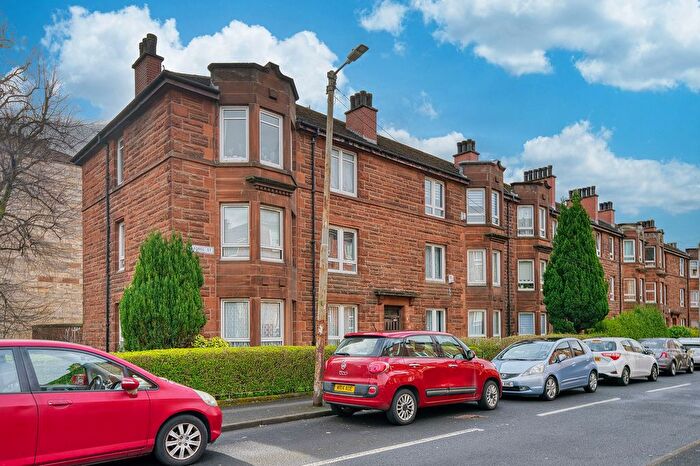
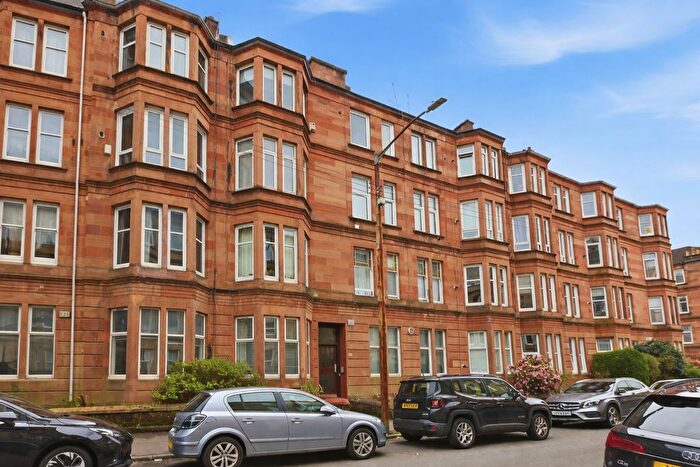

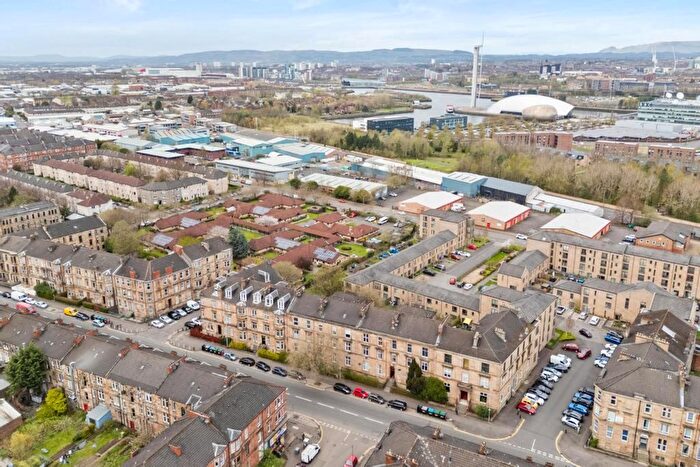
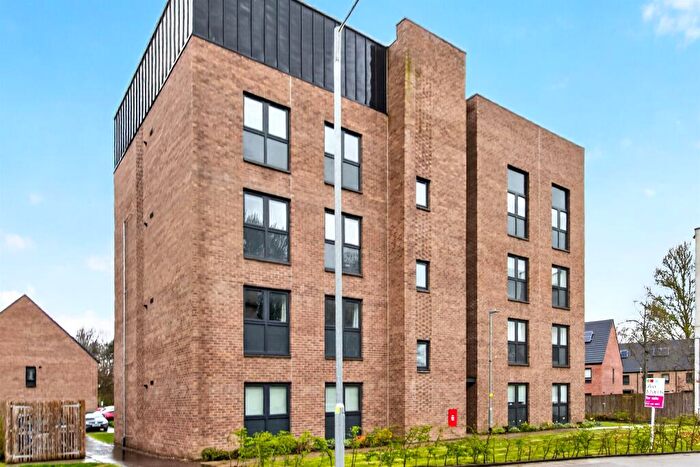

![]()
If you are looking to sell your house, let it out, or receive a property valuation, an expert can help you.
Click the button below to get started.


Roads and Postcodes in Pollokshields
Navigate through our locations to find the location of your next house in Pollokshields, Glasgow for sale or to rent.
Transport near Pollokshields
-
 Maxwell Park Station
 -
Crossmyloof Station
-
Dumbreck Station
-
Pollokshields West Station
-
Shawlands Station
-
Pollokshields East Station
-
Queen's Park (Glasgow) Station
-
Pollokshaws East Station
-
Pollokshaws West Station
-
Crosshill Station
- FAQ
- Price Paid By Year
Frequently asked questions about Pollokshields
What is the average price for a property for sale in Pollokshields?
The average price for a property for sale in Pollokshields is £342,826. This amount is 60% higher than the average price in Glasgow. There are 5,219 property listings for sale in Pollokshields.
What streets have the most expensive properties for sale in Pollokshields?
The streets with the most expensive properties for sale in Pollokshields are Newark Drive at an average of £925,375, Hamilton Avenue at an average of £859,665 and Sutherland Avenue at an average of £834,166.
What streets have the most affordable properties for sale in Pollokshields?
The streets with the most affordable properties for sale in Pollokshields are Moidart Crescent at an average of £90,000, Morven Street at an average of £110,000 and Sunart Road at an average of £112,500.
Which train stations are available in or near Pollokshields?
Some of the train stations available in or near Pollokshields are Maxwell Park, Crossmyloof and Dumbreck.
Property Price Paid in Pollokshields by Year
The average sold property price by year was:
| Year | Average Sold Price | Price Change |
Sold Properties
|
|---|---|---|---|
| 2025 | £442,465 | 16% |
91 Properties |
| 2024 | £370,766 | 21% |
88 Properties |
| 2023 | £292,274 | 11% |
228 Properties |
| 2022 | £259,841 | 10% |
655 Properties |
| 2021 | £232,758 | 13% |
764 Properties |
| 2020 | £203,321 | 9% |
598 Properties |
| 2019 | £184,910 | -4% |
667 Properties |
| 2018 | £191,395 | 3% |
657 Properties |
| 2017 | £184,933 | 13% |
653 Properties |
| 2016 | £161,049 | -9% |
659 Properties |
| 2015 | £175,755 | 5% |
609 Properties |
| 2014 | £167,603 | 5% |
642 Properties |
| 2013 | £158,964 | -3% |
495 Properties |
| 2012 | £163,010 | -2% |
408 Properties |
| 2011 | £165,674 | -4% |
369 Properties |
| 2010 | £172,109 | 10% |
466 Properties |
| 2009 | £154,097 | -16% |
598 Properties |
| 2008 | £178,586 | -15% |
658 Properties |
| 2007 | £204,954 | 6% |
856 Properties |
| 2006 | £191,808 | 20% |
961 Properties |
| 2005 | £153,281 | 2% |
1,017 Properties |
| 2004 | £149,543 | 24% |
993 Properties |
| 2003 | £113,157 | 17% |
1,009 Properties |
| 2002 | £94,242 | -5% |
879 Properties |
| 2001 | £98,980 | - |
67 Properties |