
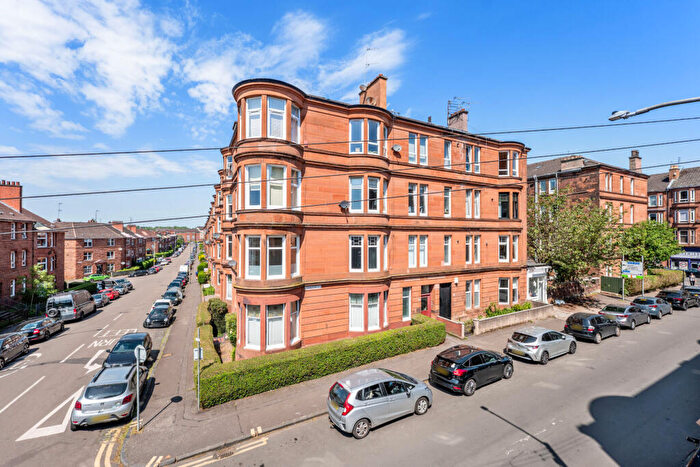
Houses for sale & to rent in Southside Central, Glasgow
House Prices in Southside Central
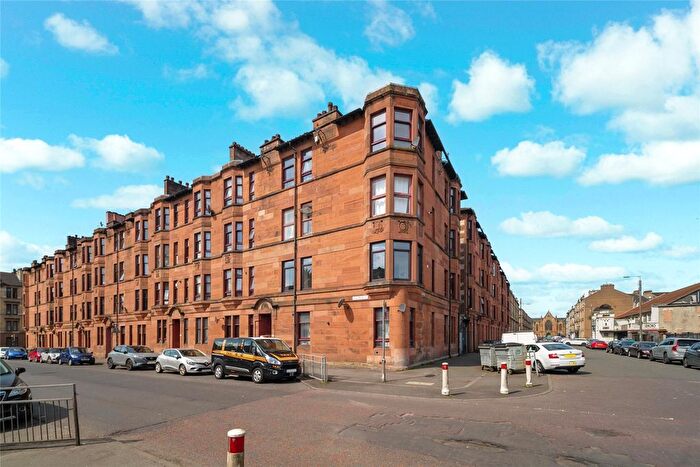
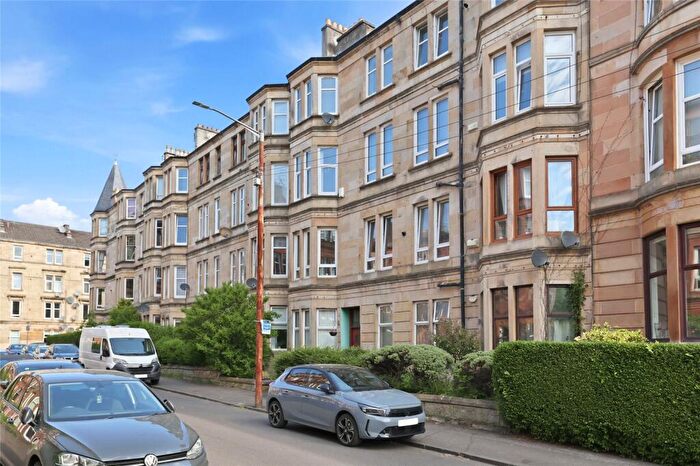
Properties in Southside Central have an average house price of £195k and had 223 Property Transactions within the last 3 years¹.
Southside Central is an area in Glasgow, Glasgow City with 12,467 households², where the most expensive property was sold for £722k.
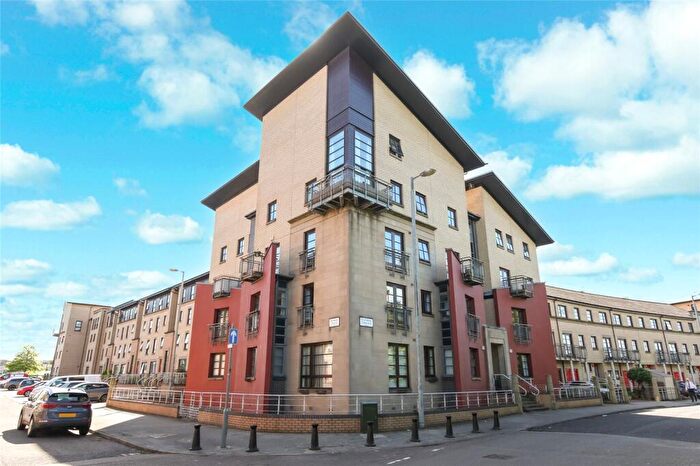
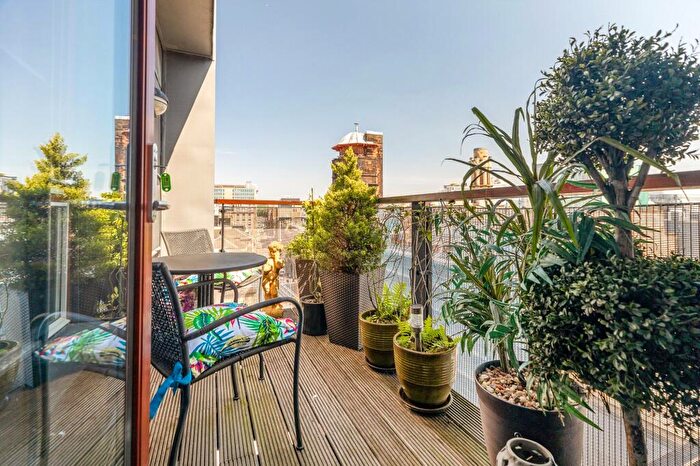
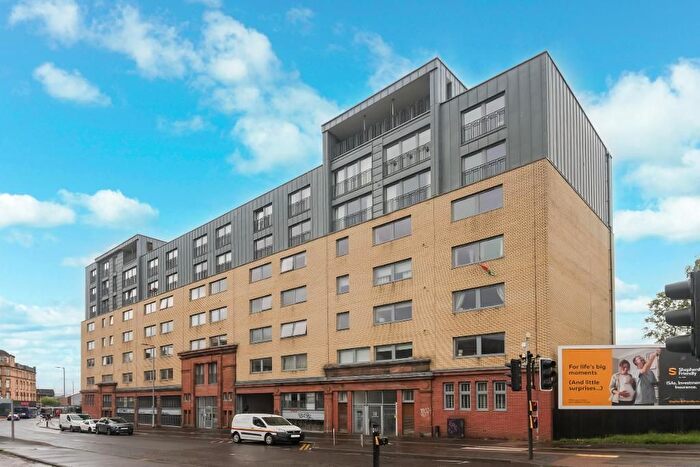
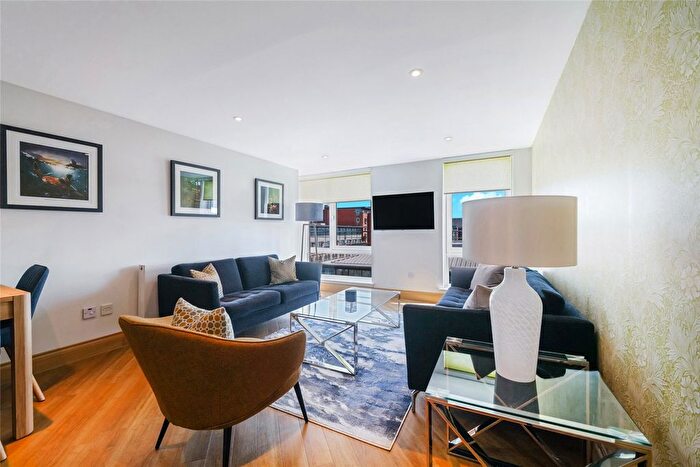
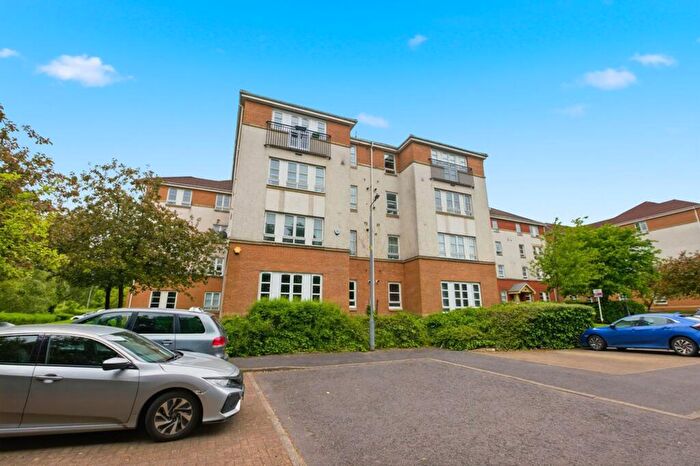
Properties for sale in Southside Central
![]()
If you are looking to sell your house, let it out, or receive a property valuation, an expert can help you.
Click the button below to get started.
Roads and Postcodes in Southside Central
Navigate through our locations to find the location of your next house in Southside Central, Glasgow for sale or to rent.
Transport near Southside Central
-
 Crosshill Station
 -
Pollokshields East Station
-
Queen's Park (Glasgow) Station
-
Pollokshields West Station
-
Mount Florida Station
-
Argyle Street Station
-
Crossmyloof Station
-
Bridgeton Station
-
Glasgow Central Station
-
Maxwell Park Station
- FAQ
- Price Paid By Year
Frequently asked questions about Southside Central
What is the average price for a property for sale in Southside Central?
The average price for a property for sale in Southside Central is £194,503. This amount is 9% lower than the average price in Glasgow. There are 7,172 property listings for sale in Southside Central.
What streets have the most expensive properties for sale in Southside Central?
The streets with the most expensive properties for sale in Southside Central are Queen Mary Avenue at an average of £465,543, Queens Drive at an average of £404,501 and Crosshill Avenue at an average of £395,000.
What streets have the most affordable properties for sale in Southside Central?
The streets with the most affordable properties for sale in Southside Central are Torrisdale Street at an average of £101,840, Allison Street at an average of £105,158 and Hutchesontown Court at an average of £115,750.
Which train stations are available in or near Southside Central?
Some of the train stations available in or near Southside Central are Crosshill, Pollokshields East and Queen's Park (Glasgow).
Property Price Paid in Southside Central by Year
The average sold property price by year was:
| Year | Average Sold Price | Price Change |
Sold Properties
|
|---|---|---|---|
| 2025 | £262,539 | -1% |
35 Properties |
| 2024 | £266,171 | 40% |
39 Properties |
| 2023 | £159,762 | 1% |
149 Properties |
| 2022 | £157,432 | 3% |
584 Properties |
| 2021 | £152,678 | 10% |
683 Properties |
| 2020 | £138,149 | 17% |
570 Properties |
| 2019 | £114,700 | -3% |
682 Properties |
| 2018 | £118,643 | 4% |
672 Properties |
| 2017 | £113,421 | 8% |
763 Properties |
| 2016 | £103,992 | 1% |
746 Properties |
| 2015 | £102,522 | 10% |
649 Properties |
| 2014 | £92,249 | 4% |
591 Properties |
| 2013 | £88,274 | -3% |
457 Properties |
| 2012 | £90,730 | -8% |
428 Properties |
| 2011 | £97,885 | -12% |
347 Properties |
| 2010 | £109,207 | 14% |
389 Properties |
| 2009 | £94,350 | -25% |
347 Properties |
| 2008 | £117,943 | 5% |
592 Properties |
| 2007 | £112,245 | -1532,5% |
780 Properties |
| 2006 | £1,832,378 | 95% |
821 Properties |
| 2005 | £95,459 | 11% |
953 Properties |
| 2004 | £84,846 | 1% |
917 Properties |
| 2003 | £83,697 | 16% |
883 Properties |
| 2002 | £69,930 | 25% |
980 Properties |
| 2001 | £52,653 | - |
64 Properties |