
Houses for sale & to rent in IV10 8UQ, Gowanbrae Crescent, Black Isle, Fortrose
House Prices in IV10 8UQ, Gowanbrae Crescent, Black Isle
Properties in IV10 8UQ have an average house price of £165,000.00 and had 1 Property Transaction within the last 3 years.¹ IV10 8UQ is a postcode in Gowanbrae Crescent located in Black Isle, an area in Fortrose, Highland, with 11 households², where the most expensive property was sold for £165,000.00.
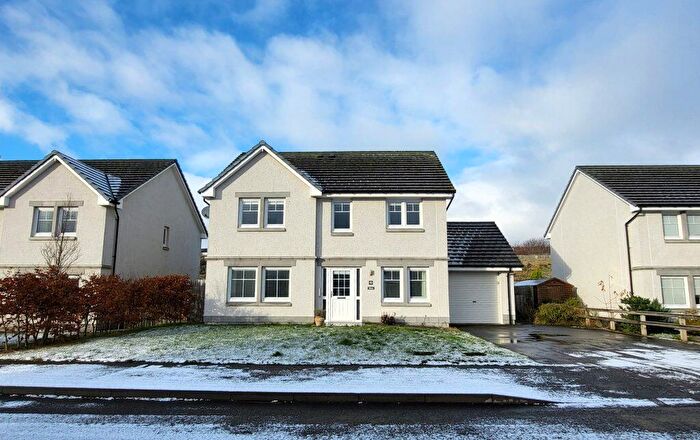
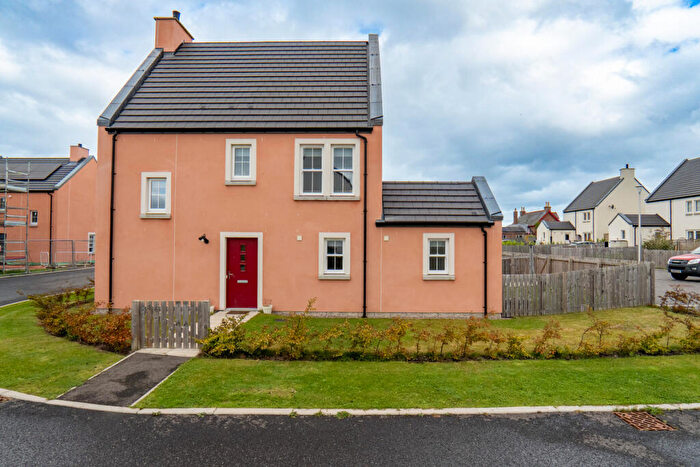
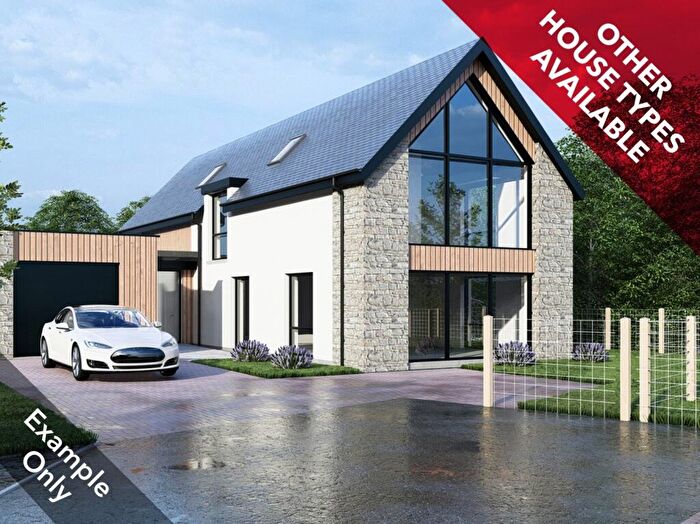
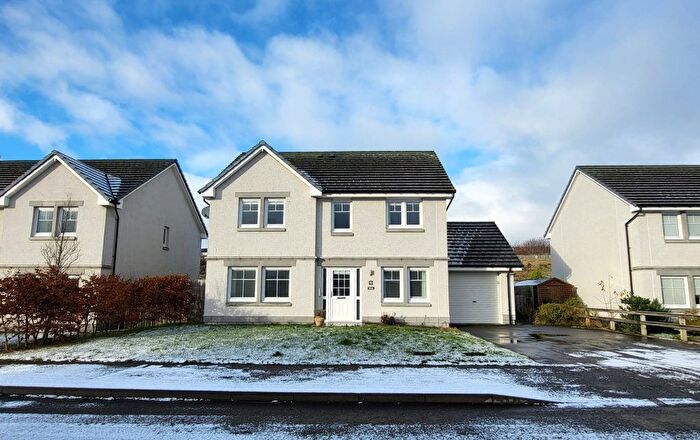
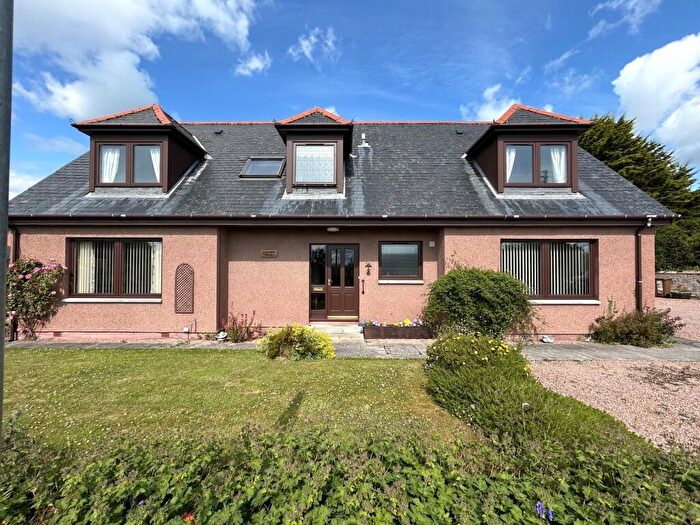
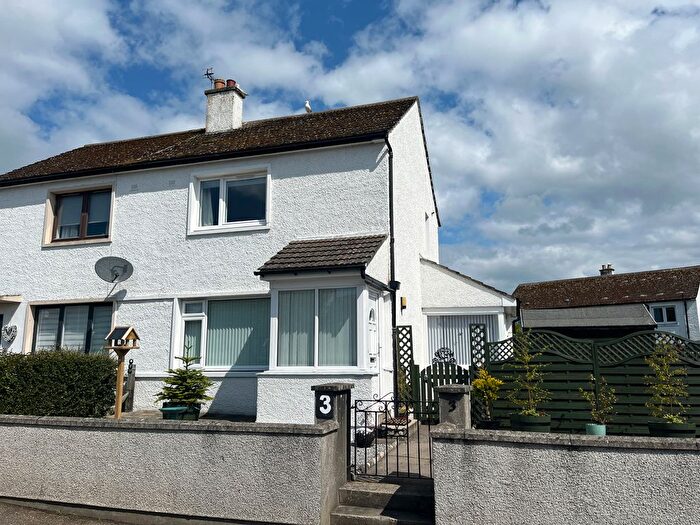
Properties for sale near IV10 8UQ, Gowanbrae Crescent

![]()
If you are looking to sell your house, let it out, or receive a property valuation, an expert can help you.
Click the button below to get started.


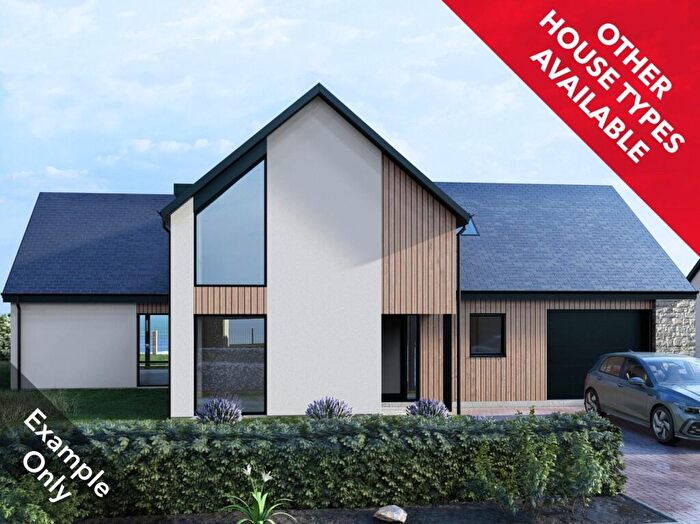
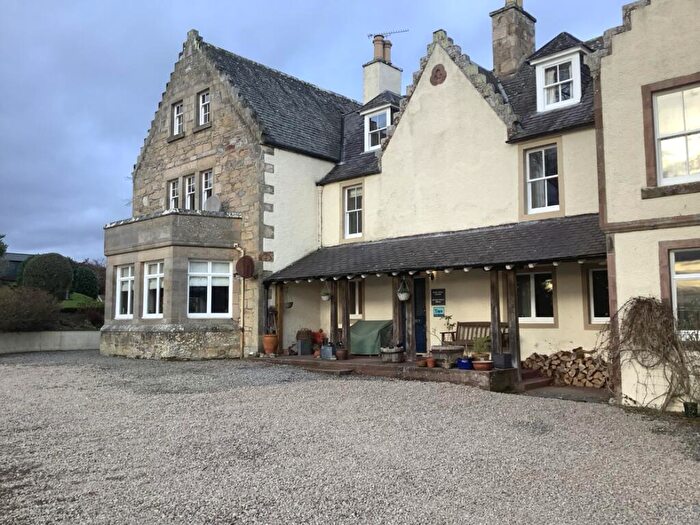
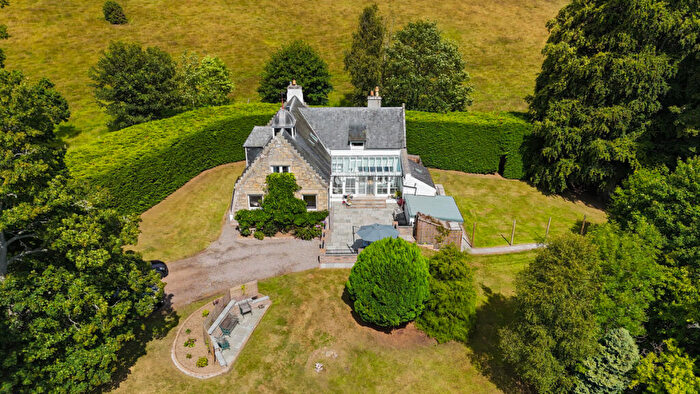
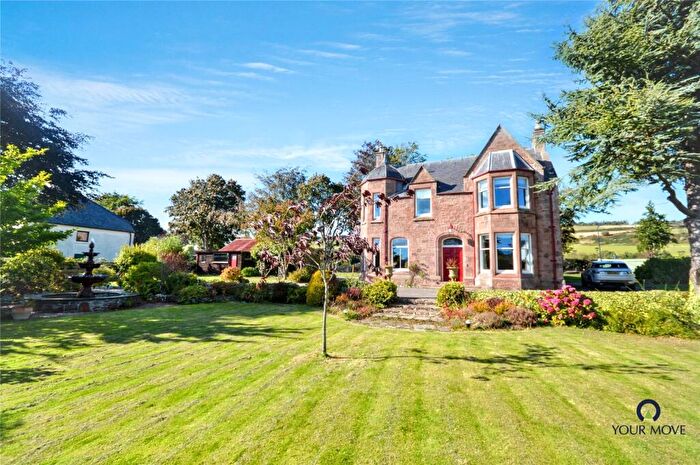
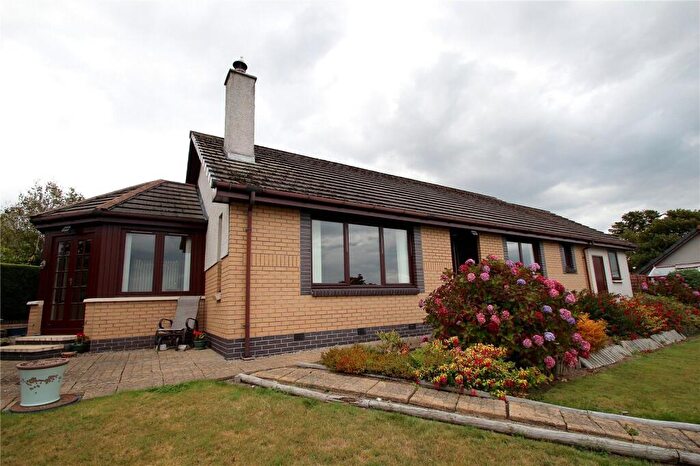
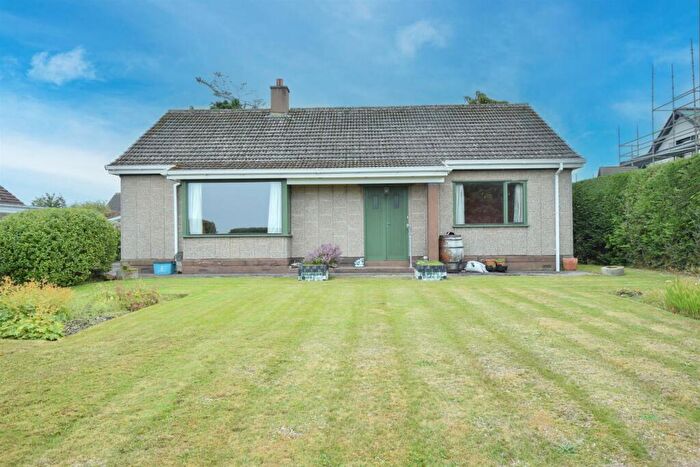
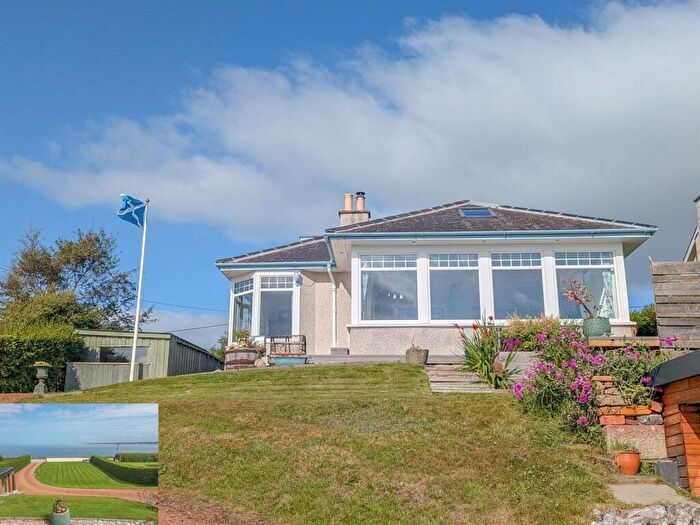
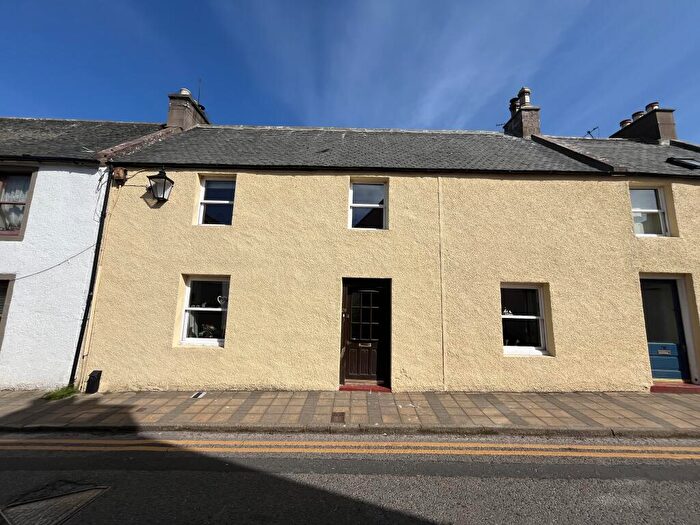
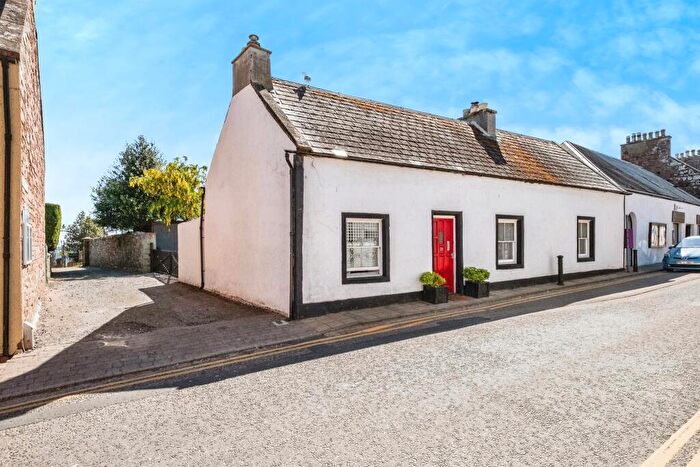
Previously listed properties near IV10 8UQ, Gowanbrae Crescent
![]()
If you are looking to sell your house, let it out, or receive a property valuation, an expert can help you.
Click the button below to get started.
Price Paid in Gowanbrae Crescent, IV10 8UQ, Black Isle
9 Gowanbrae Crescent, IV10 8UQ, Black Isle Fortrose
Property 9 has been sold 2 times. The last time it was sold was in 21/12/2022 and the sold price was £165,000.00.
This is a Property which was sold as an Established Building in 21/12/2022
| Date | Price | Classification |
|---|---|---|
| 21/12/2022 | £165,000.00 | Established Building |
| 14/07/2003 | £86,000.00 | Established Building |
5 Gowanbrae Crescent, IV10 8UQ, Black Isle Fortrose
Property 5 has been sold 3 times. The last time it was sold was in 28/08/2019 and the sold price was £149,250.00.
This is a Property which was sold as an Established Building in 28/08/2019
| Date | Price | Classification |
|---|---|---|
| 28/08/2019 | £149,250.00 | Established Building |
| 19/09/2011 | £140,000.00 | Established Building |
| 04/06/2007 | £40,000.00 | Established Building |
7 Gowanbrae Crescent, IV10 8UQ, Black Isle Fortrose
Property 7 has been sold 1 time. The last time it was sold was in 24/01/2002 and the sold price was £25,795.00.
This is a Property which was sold as an Established Building in 24/01/2002
| Date | Price | Classification |
|---|---|---|
| 24/01/2002 | £25,795.00 | Established Building |
Transport near IV10 8UQ, Gowanbrae Crescent

House price paid reports for IV10 8UQ, Gowanbrae Crescent
Click on the buttons below to see price paid reports by year or property price:
- Price Paid By Year
Property Price Paid in IV10 8UQ, Gowanbrae Crescent by Year
The average sold property price by year was:
| Year | Average Sold Price | Price Change |
Sold Properties
|
|---|---|---|---|
| 2022 | £165,000 | 10% |
1 Property |
| 2019 | £149,250 | 6% |
1 Property |
| 2011 | £140,000 | 71% |
1 Property |
| 2007 | £40,000 | -115% |
1 Property |
| 2003 | £86,000 | 70% |
1 Property |
| 2002 | £25,795 | - |
1 Property |