
Houses for sale & to rent in Troon, South Ayrshire
House Prices in Troon
Properties in Troon have an average house price of £202k and had 551 Property Transactions within the last 3 years.¹
Troon is an area in South Ayrshire with 7,298 households², where the most expensive property was sold for £700k.
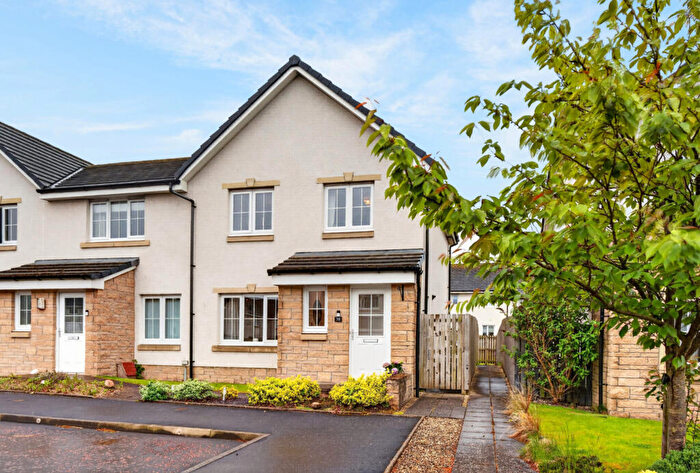
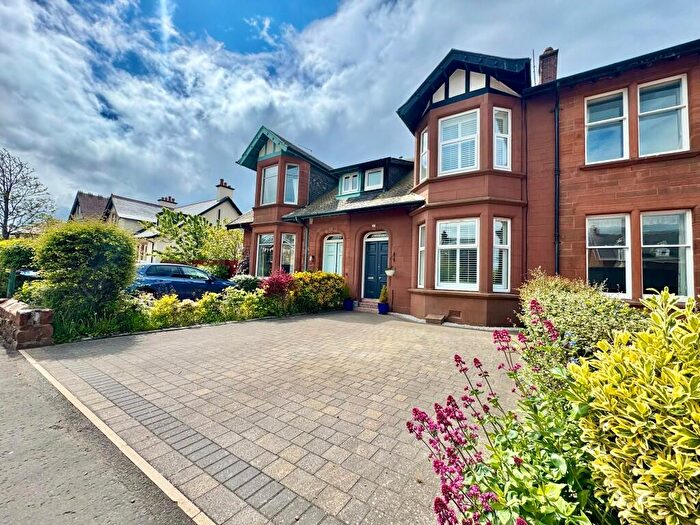
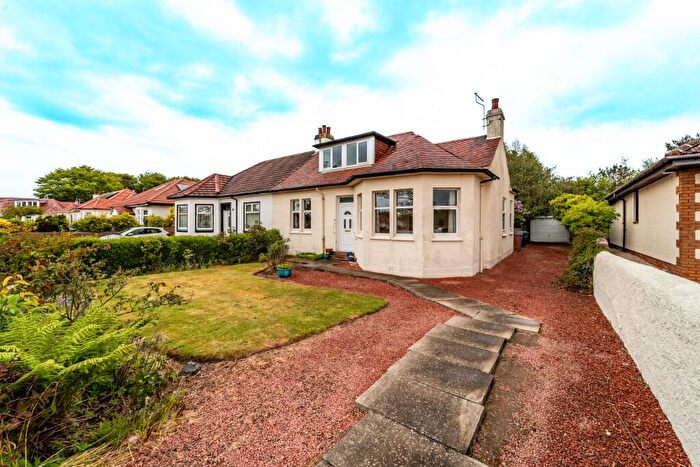
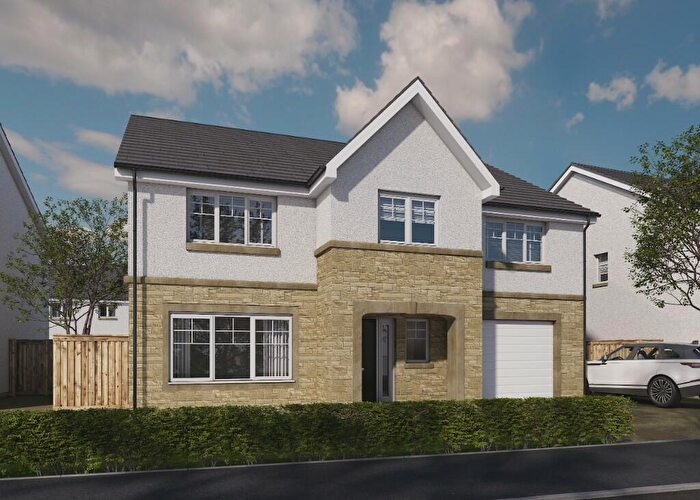
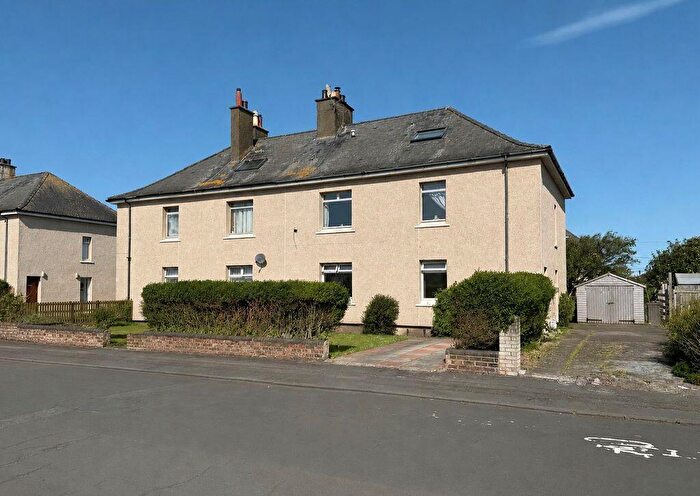
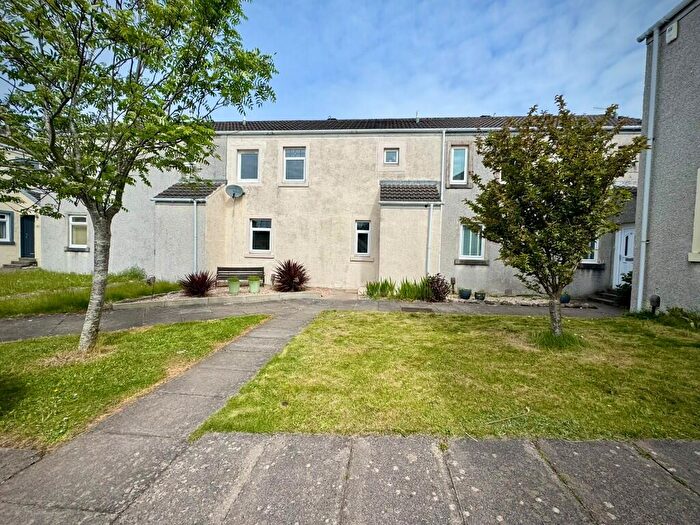
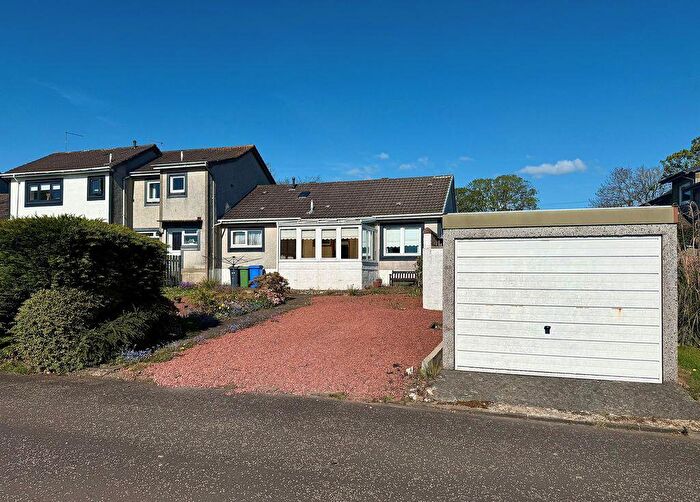
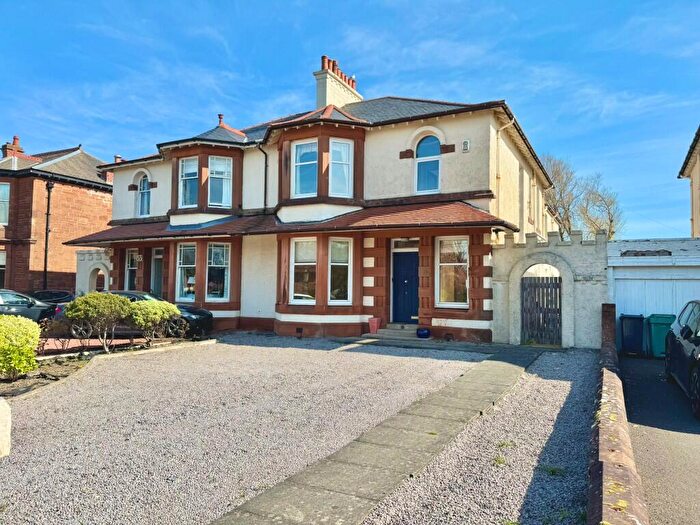
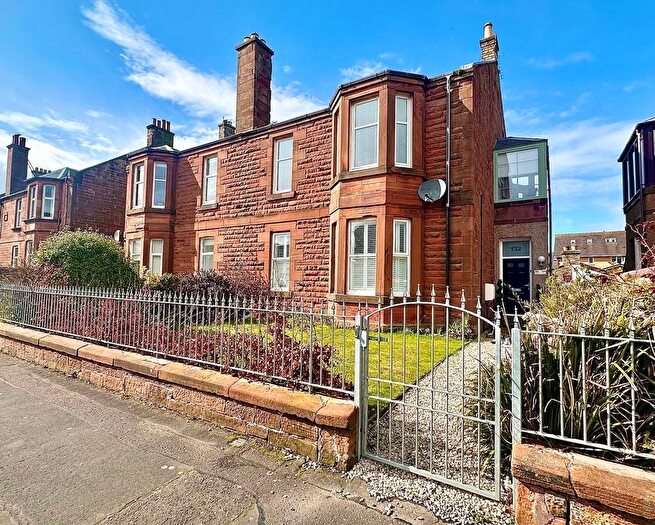
Properties for sale in Troon

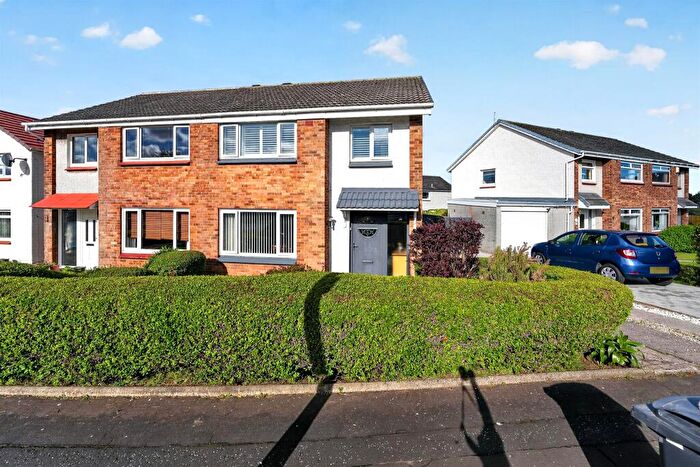
![]()
If you are looking to sell your house, let it out, or receive a property valuation, an expert can help you.
Click the button below to get started.

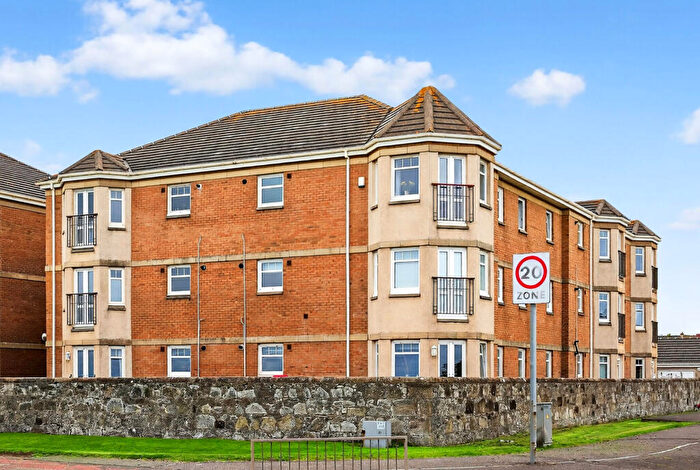
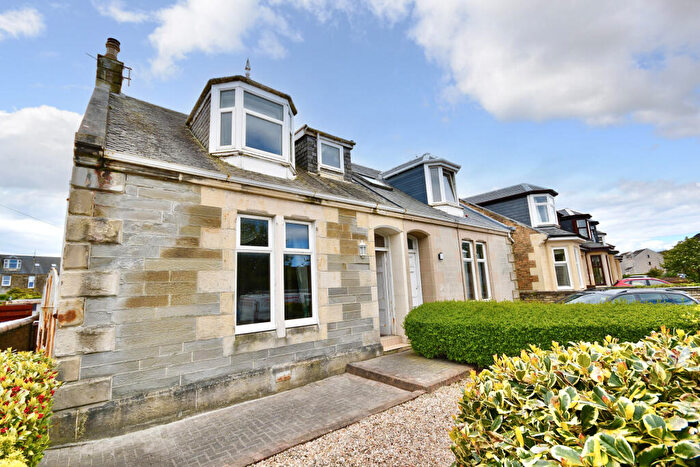
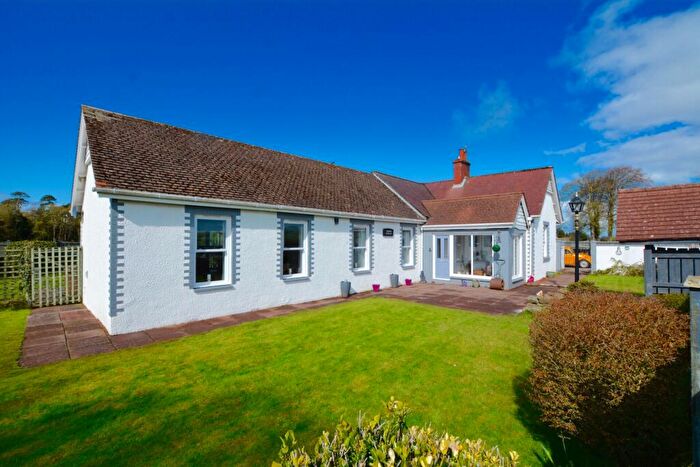
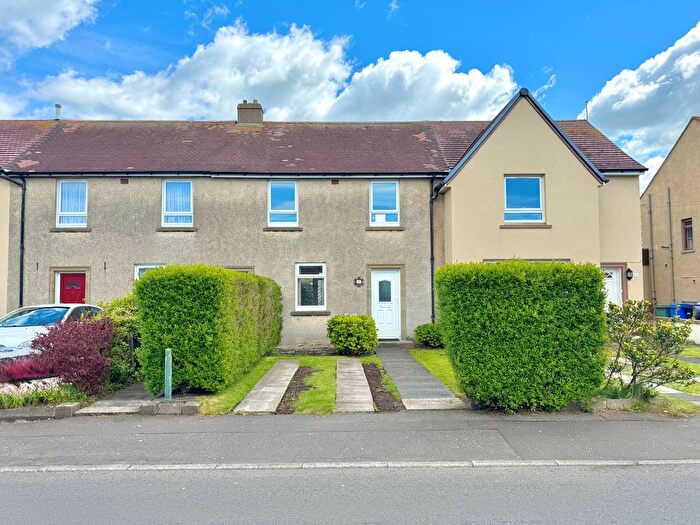
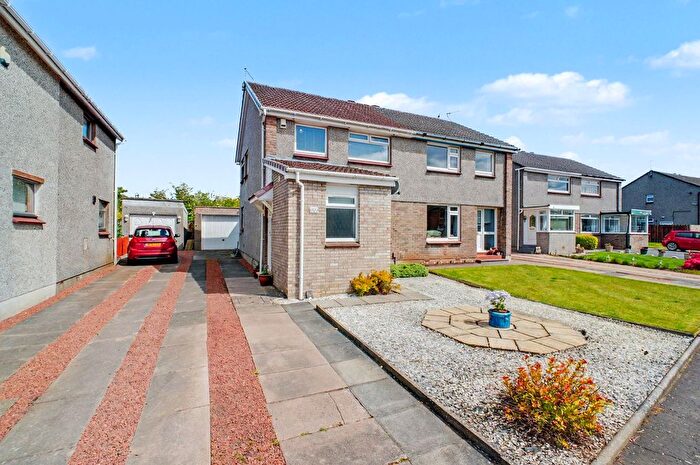
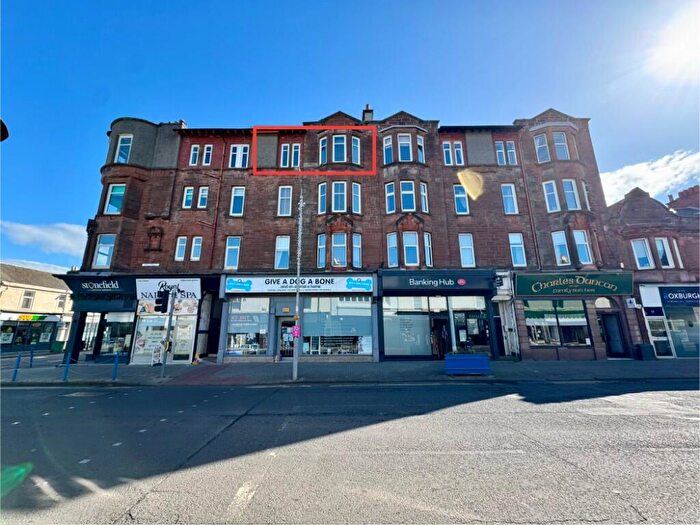
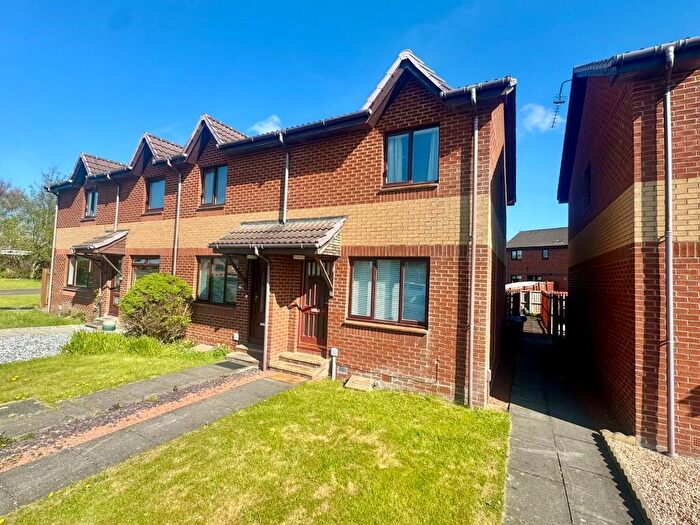
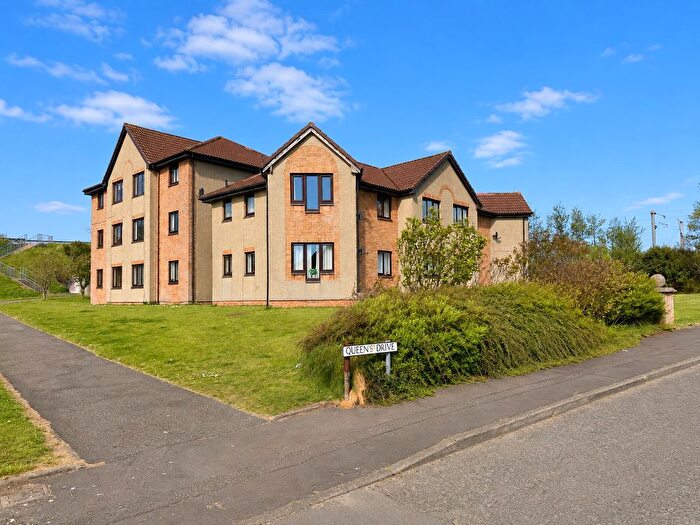
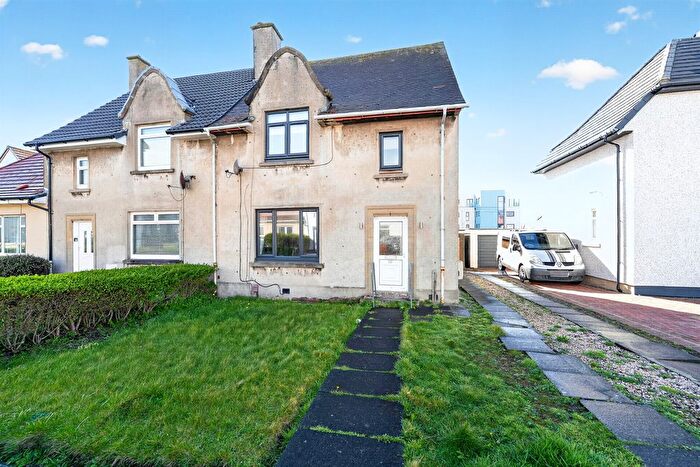
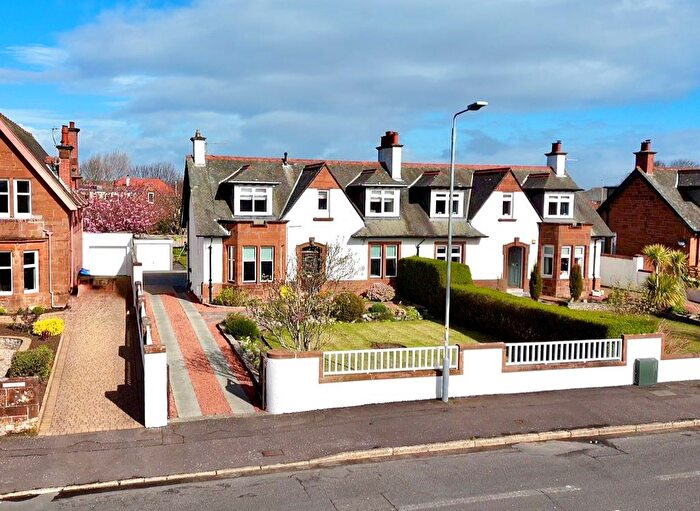
Previously listed properties in Troon
![]()
If you are looking to sell your house, let it out, or receive a property valuation, an expert can help you.
Click the button below to get started.
Neighbourhoods in Troon
Navigate through our locations to find the location of your next house in Troon, South Ayrshire for sale or to rent.
Transport in Troon
Please see below transportation links in this area:
-
 Troon Station
 -
Barassie Station
-
Prestwick Internat'nl Airport Station
-
Prestwick Station
-
Irvine Station
- FAQ
- Price Paid By Year
Frequently asked questions about Troon
What is the average price for a property for sale in Troon?
The average price for a property for sale in Troon is £201,535. This amount is 9% higher than the average price in South Ayrshire. There are 647 property listings for sale in Troon.
What locations have the most expensive properties for sale in Troon?
The location with the most expensive properties for sale in Troon is Kyle at an average of £202,223.
What locations have the most affordable properties for sale in Troon?
The location with the most affordable properties for sale in Troon is Troon at an average of £201,505.
Which train stations are available in or near Troon?
Some of the train stations available in or near Troon are Troon, Barassie and Prestwick Internat'nl Airport.
Property Price Paid in Troon by Year
The average sold property price by year was:
| Year | Average Sold Price | Price Change |
Sold Properties
|
|---|---|---|---|
| 2025 | £209,399 | 1% |
153 Properties |
| 2024 | £207,818 | 9% |
189 Properties |
| 2023 | £190,097 | -12% |
209 Properties |
| 2022 | £211,981 | 4% |
355 Properties |
| 2021 | £203,054 | -3% |
394 Properties |
| 2020 | £208,819 | 15% |
380 Properties |
| 2019 | £176,795 | -3% |
412 Properties |
| 2018 | £182,452 | -3% |
361 Properties |
| 2017 | £188,244 | -5% |
433 Properties |
| 2016 | £198,247 | 3% |
437 Properties |
| 2015 | £192,018 | 22% |
356 Properties |
| 2014 | £148,825 | -6% |
322 Properties |
| 2013 | £157,332 | 2% |
297 Properties |
| 2012 | £153,720 | -18% |
259 Properties |
| 2011 | £181,125 | 5% |
207 Properties |
| 2010 | £172,245 | 9% |
248 Properties |
| 2009 | £156,930 | -4% |
284 Properties |
| 2008 | £163,527 | -3% |
380 Properties |
| 2007 | £169,019 | 2% |
545 Properties |
| 2006 | £165,744 | 21% |
459 Properties |
| 2005 | £131,511 | 13% |
488 Properties |
| 2004 | £114,986 | -18% |
491 Properties |
| 2003 | £135,903 | 44% |
441 Properties |
| 2002 | £76,125 | -49% |
492 Properties |
| 2001 | £113,353 | -83% |
55 Properties |
| 1997 | £207,000 | - |
1 Property |