
Houses for sale & to rent in West Kilbride, North Ayrshire
House Prices in West Kilbride
Properties in West Kilbride have an average house price of £228k and had 173 Property Transactions within the last 3 years.¹
West Kilbride is an area in North Ayrshire with 2,317 households², where the most expensive property was sold for £600k.
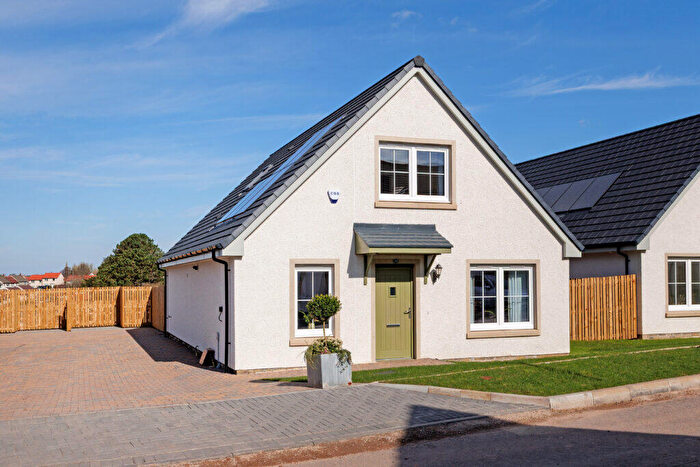
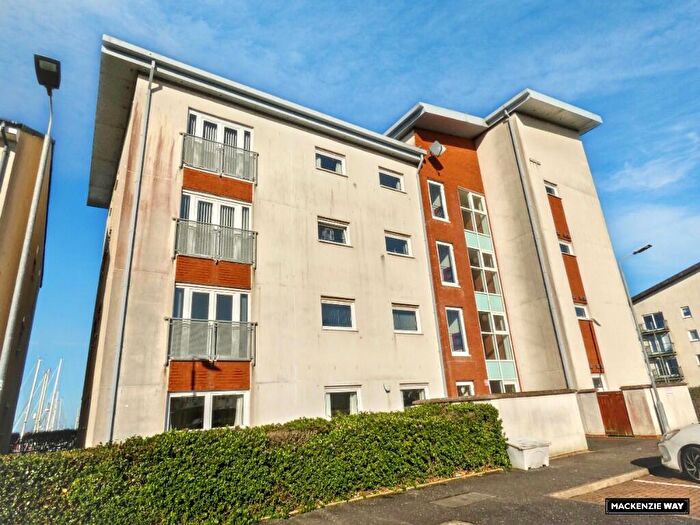
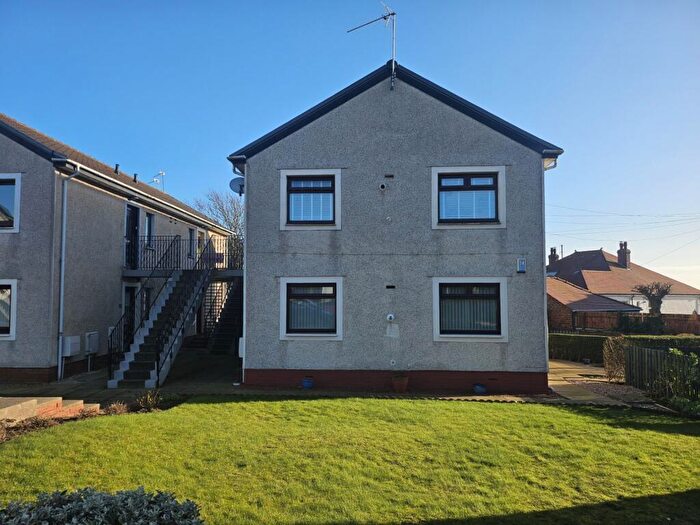
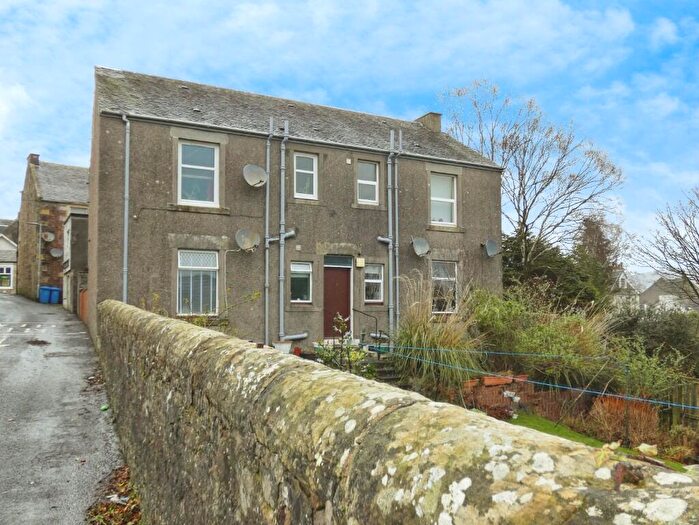
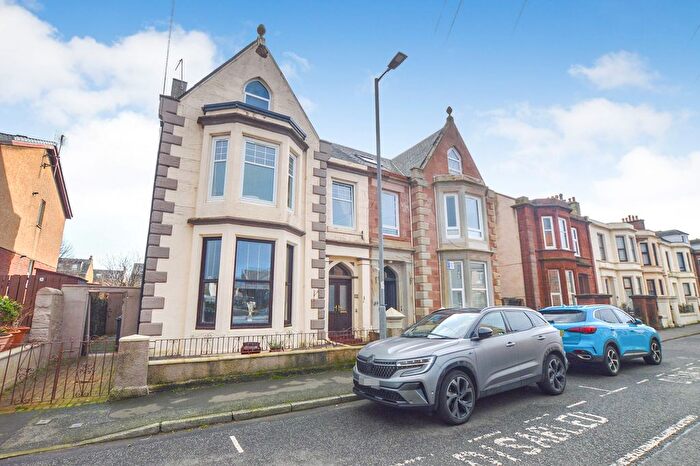
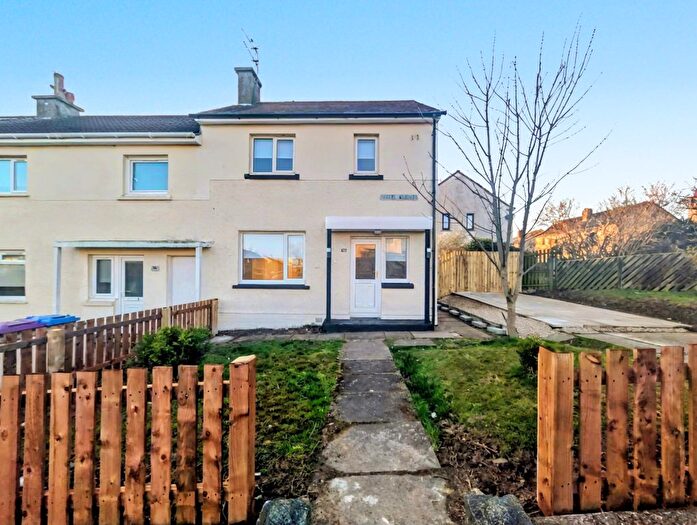
Properties for sale in West Kilbride
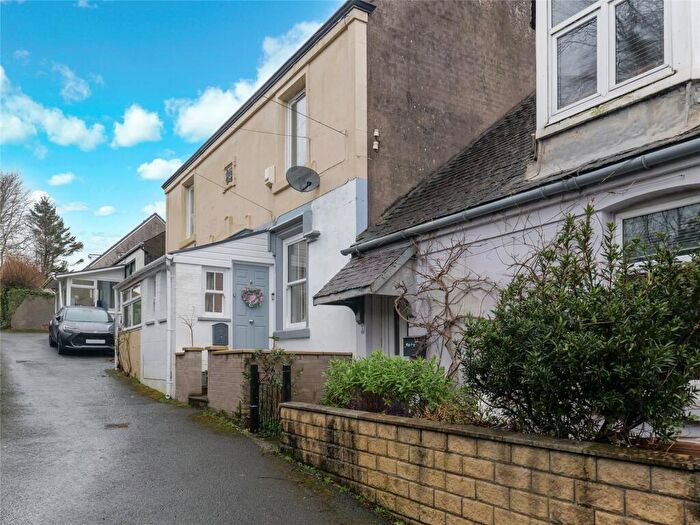
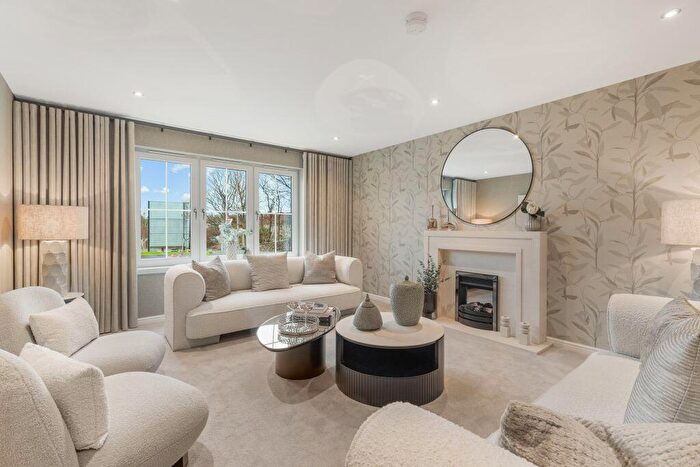
![]()
If you are looking to sell your house, let it out, or receive a property valuation, an expert can help you.
Click the button below to get started.


Neighbourhoods in West Kilbride
Navigate through our locations to find the location of your next house in West Kilbride, North Ayrshire for sale or to rent.
Transport in West Kilbride
Please see below transportation links in this area:
-
 West Kilbride Station
 -
Ardrossan Harbour Station
-
Fairlie Station
-
Ardrossan Town Station
-
Ardrossan South Beach Station
- FAQ
- Price Paid By Year
Frequently asked questions about West Kilbride
What is the average price for a property for sale in West Kilbride?
The average price for a property for sale in West Kilbride is £228,205. This amount is 61% higher than the average price in North Ayrshire. There are 1,412 property listings for sale in West Kilbride.
Which train stations are available in or near West Kilbride?
Some of the train stations available in or near West Kilbride are West Kilbride, Ardrossan Harbour and Fairlie.
Property Price Paid in West Kilbride by Year
The average sold property price by year was:
| Year | Average Sold Price | Price Change |
Sold Properties
|
|---|---|---|---|
| 2025 | £240,816 | 2% |
55 Properties |
| 2024 | £235,940 | 10% |
49 Properties |
| 2023 | £212,661 | -7% |
69 Properties |
| 2022 | £228,285 | -8% |
102 Properties |
| 2021 | £247,629 | 9% |
127 Properties |
| 2020 | £224,358 | 9% |
133 Properties |
| 2019 | £204,526 | 10% |
131 Properties |
| 2018 | £184,613 | 8% |
138 Properties |
| 2017 | £168,953 | -12% |
82 Properties |
| 2016 | £189,655 | 5% |
101 Properties |
| 2015 | £179,697 | 6% |
111 Properties |
| 2014 | £168,774 | 11% |
109 Properties |
| 2013 | £150,390 | -8% |
82 Properties |
| 2012 | £162,434 | -6% |
78 Properties |
| 2011 | £172,195 | 23% |
72 Properties |
| 2010 | £133,436 | -9% |
64 Properties |
| 2009 | £145,521 | -19% |
91 Properties |
| 2008 | £172,609 | 6% |
100 Properties |
| 2007 | £161,403 | 3% |
151 Properties |
| 2006 | £156,862 | 21% |
175 Properties |
| 2005 | £124,203 | -3% |
144 Properties |
| 2004 | £127,553 | 27% |
156 Properties |
| 2003 | £93,209 | 20% |
150 Properties |
| 2002 | £74,865 | -196% |
192 Properties |
| 2001 | £221,428 | - |
7 Properties |