
Houses for sale in Kirkwall, Orkney Islands
House Prices in Kirkwall
Properties in Kirkwall have an average house price of £195k and had 169 Property Transactions within the last 3 years.¹
Kirkwall is an area in Orkney Islands with 3,876 households², where the most expensive property was sold for £545k.
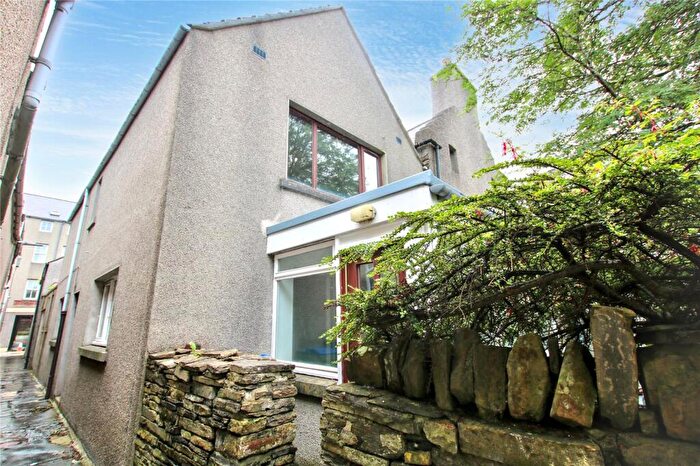
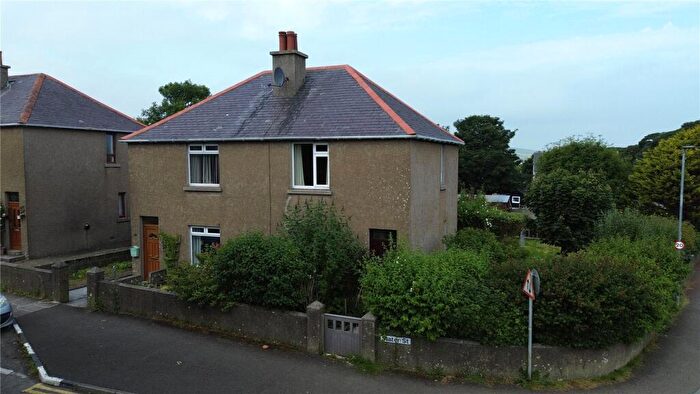
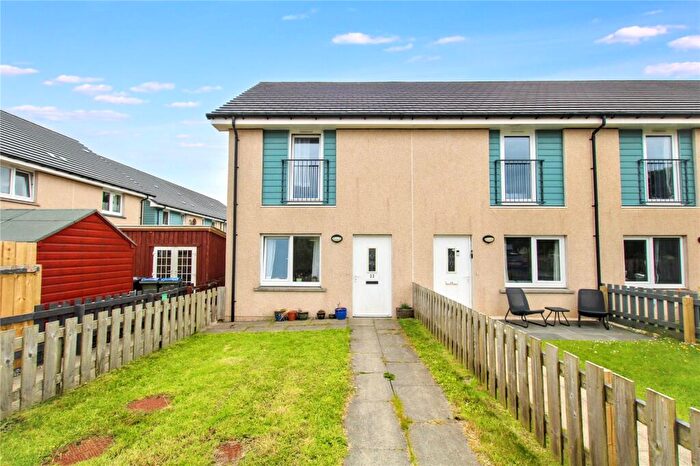
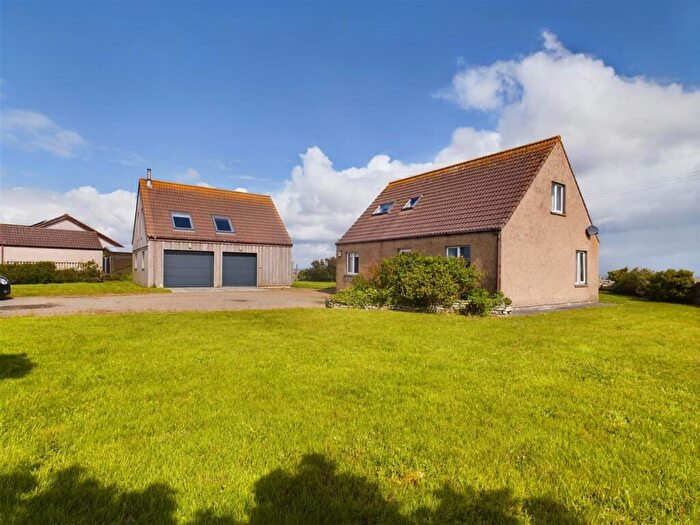
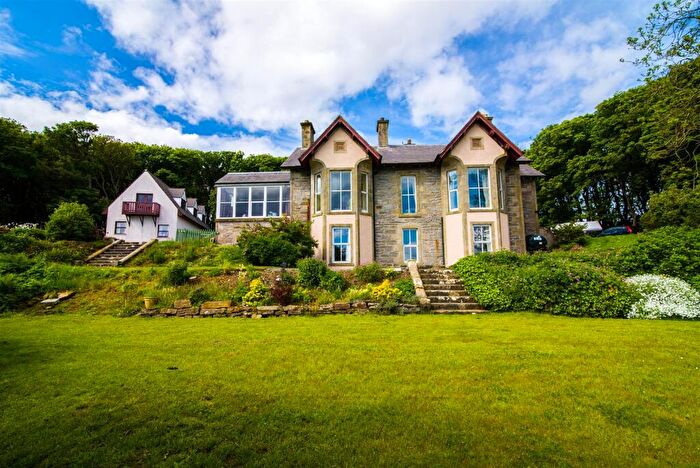
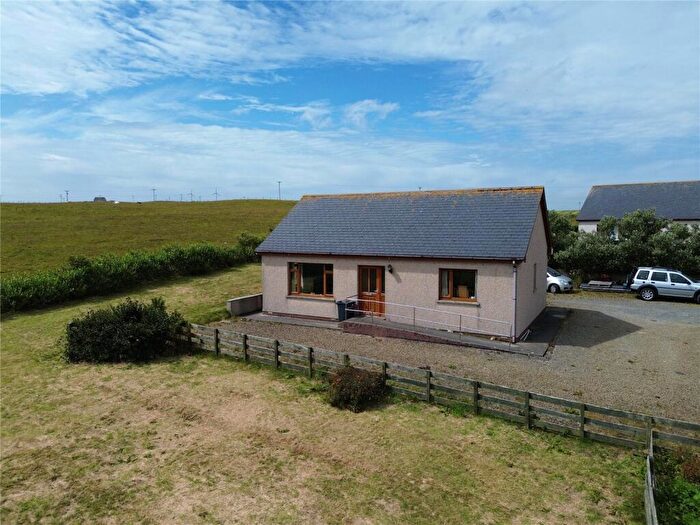
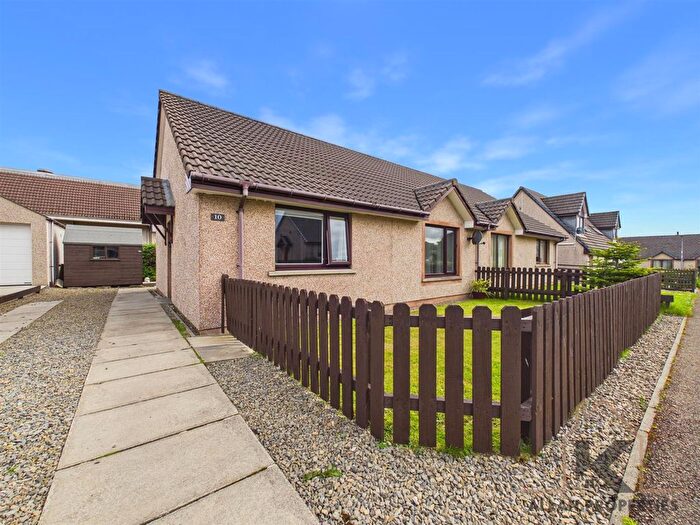
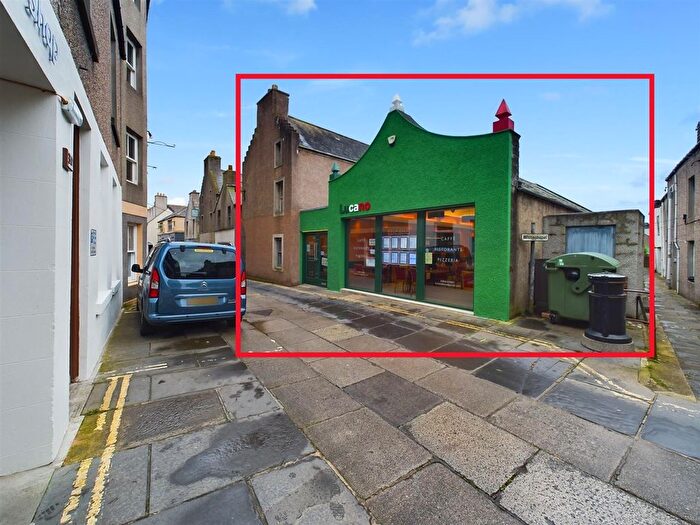
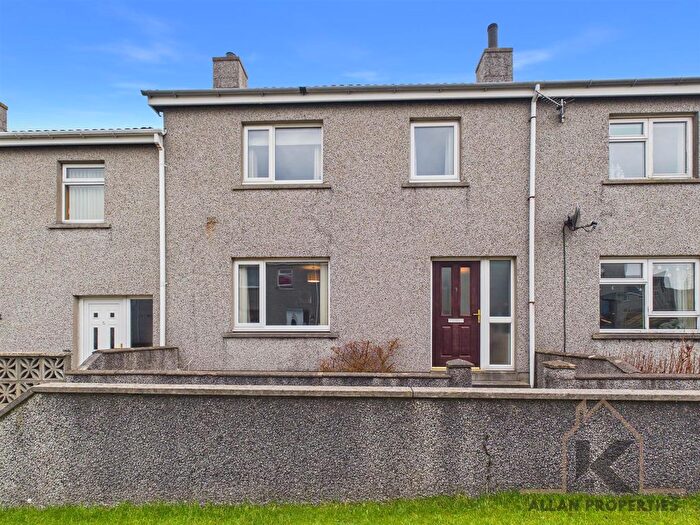
Properties for sale in Kirkwall
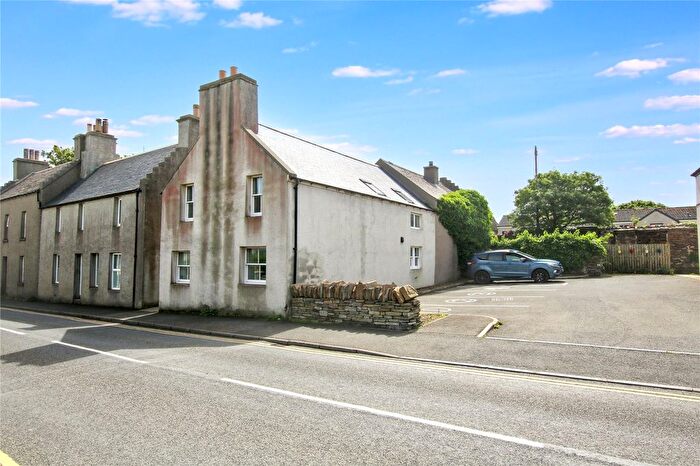
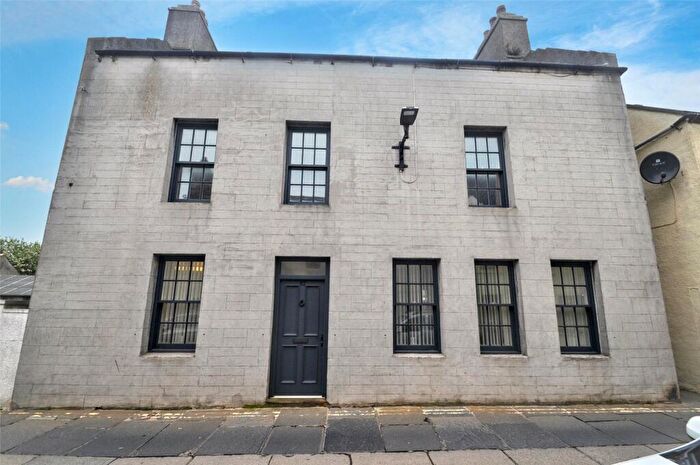
![]()
If you are looking to sell your house, let it out, or receive a property valuation, an expert can help you.
Click the button below to get started.
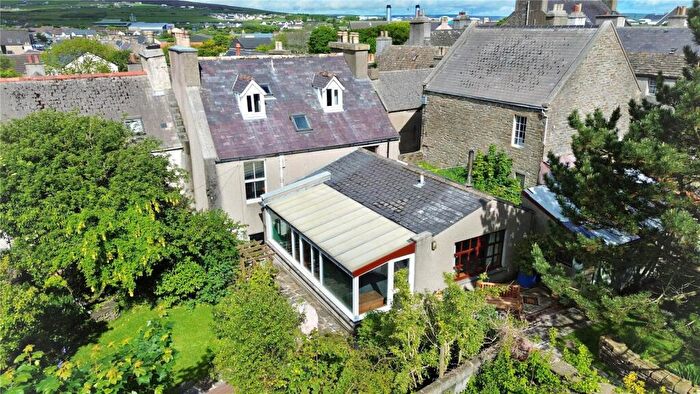
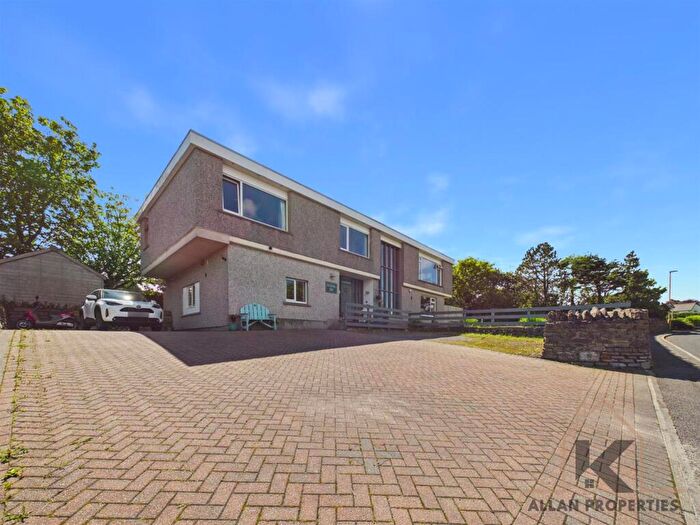
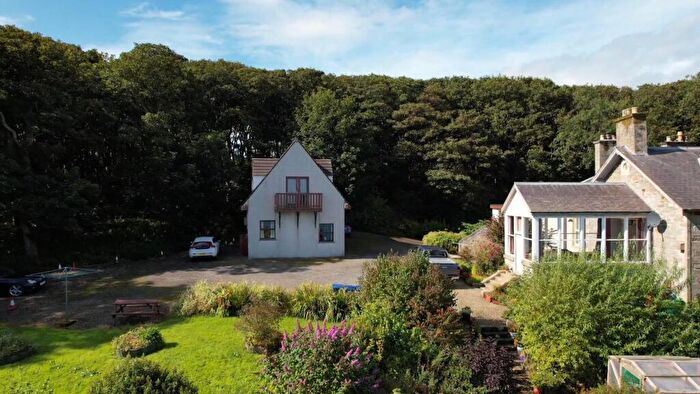
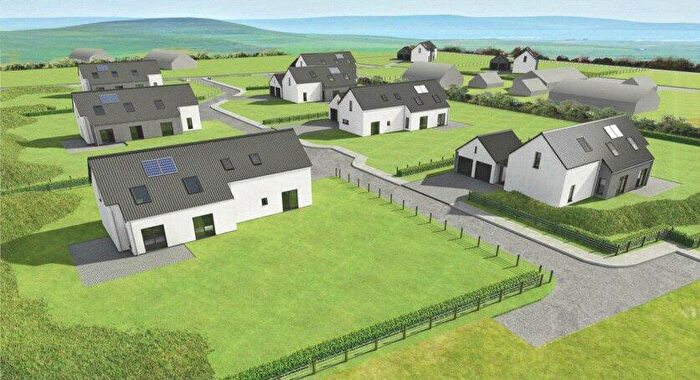

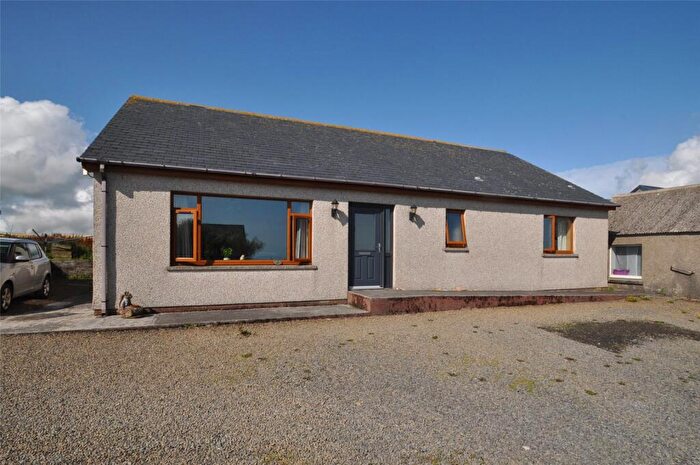
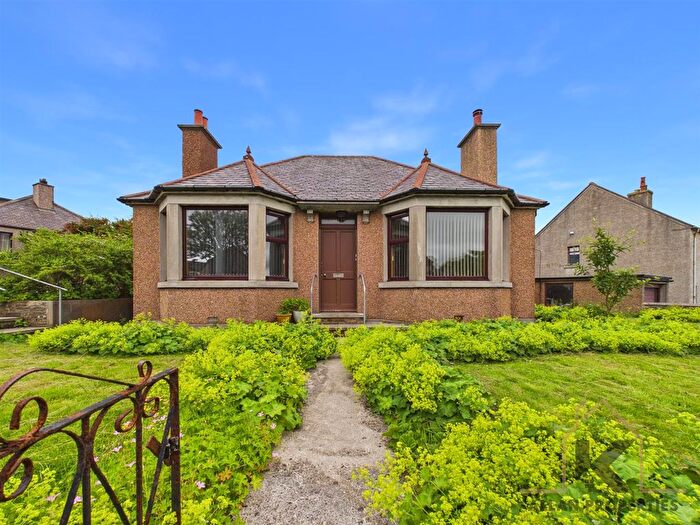
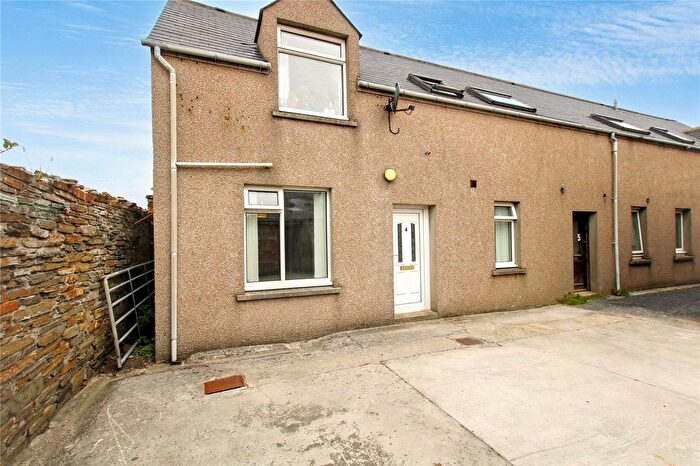
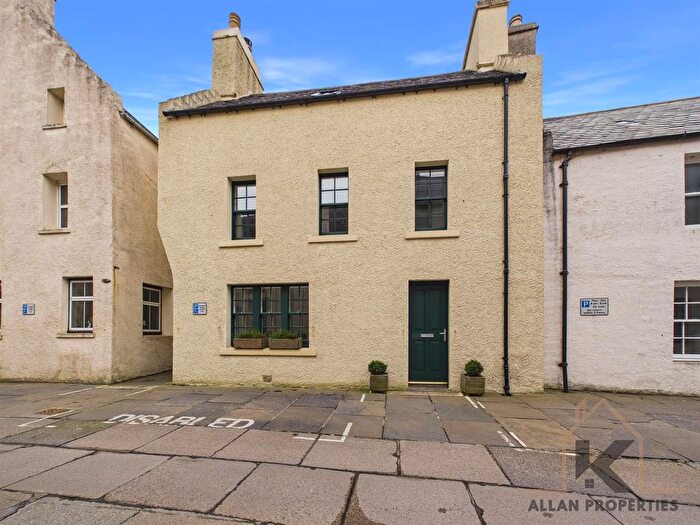
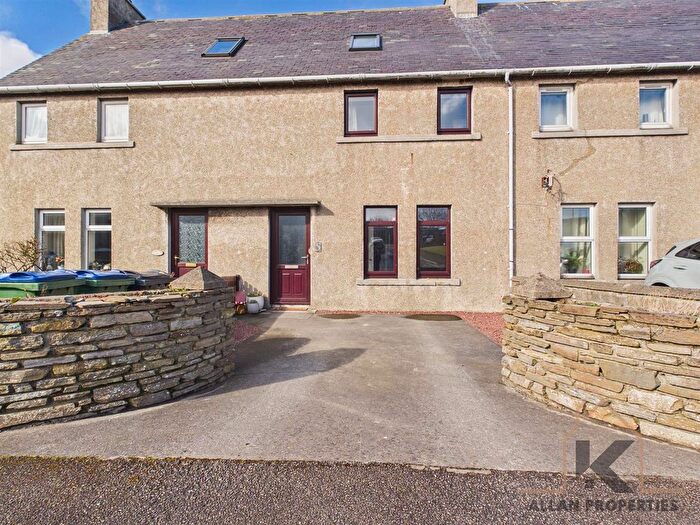
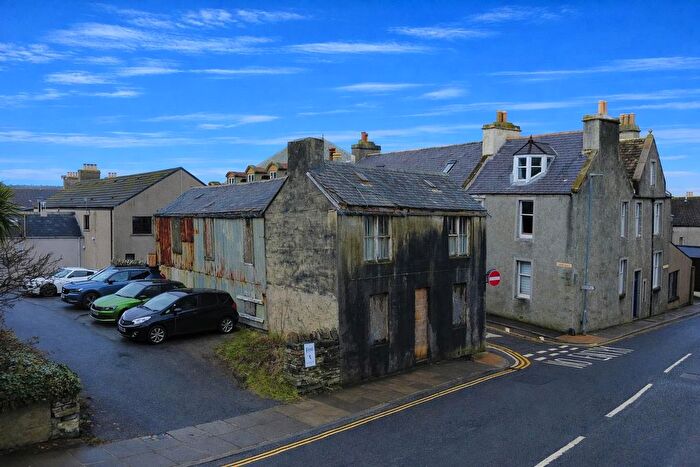
Previously listed properties in Kirkwall
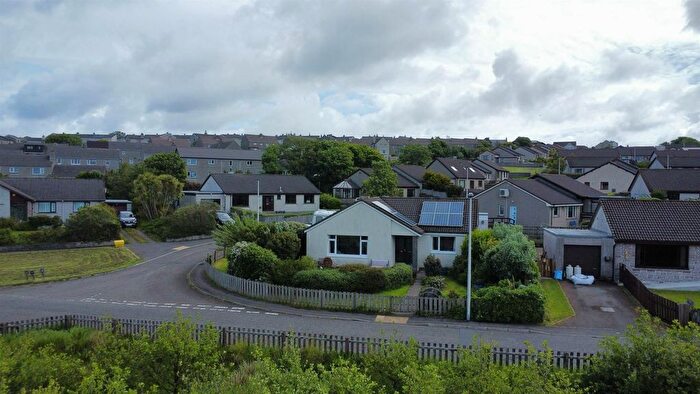
![]()
If you are looking to sell your house, let it out, or receive a property valuation, an expert can help you.
Click the button below to get started.
Neighbourhoods in Kirkwall
Navigate through our locations to find the location of your next house in Kirkwall, Orkney Islands for sale or to rent.
Property price trends in Kirkwall
According to the latest Registers of Scotland data, the average home in Kirkwall sold for £193,547 in 2025. That figure comes from 3,200 sales logged over the past 25 years.
Prices have held fairly steady over the last three years. Compared with 2022, when the typical sale came in around £193,630, values are broadly unchanged.
Looking back five years, average prices are up about 21.5% since 2020, a gain of around £34,292 in cash terms.
Zoom out to the past decade for the fuller picture. Back in 2015, homes here averaged £132,110, so the typical sold price has climbed about 46.5% since then, roughly 3.9% a year. Stretch the view to fifteen years and that annual pace holds at about 4%.
Frequently asked questions about Kirkwall
What is the average price for a property for sale in Kirkwall?
The average price for a property for sale in Kirkwall is £195,350. This amount is 2% higher than the average price in Orkney Islands. There are 179 property listings for sale in Kirkwall.
What locations have the most expensive properties for sale in Kirkwall?
The locations with the most expensive properties for sale in Kirkwall are East Mainland, South Ronaldsay and Burray at an average of £215,000 and Kirkwall East at an average of £200,428.
What locations have the most affordable properties for sale in Kirkwall?
The location with the most affordable properties for sale in Kirkwall is Kirkwall West and Orphir at an average of £190,346.
Which train stations are available in or near Kirkwall?
Some of the train stations available in or near Kirkwall are Thurso, Georgemas Junction and Wick.
Property Price Paid in Kirkwall by Year
The average sold property price by year was:
| Year | Average Sold Price | Price Change |
Sold Properties
|
|---|---|---|---|
| 2025 | £193,547 | 7% |
49 Properties |
| 2024 | £180,065 | -18% |
60 Properties |
| 2023 | £212,109 | 9% |
60 Properties |
| 2022 | £193,630 | 4% |
124 Properties |
| 2021 | £185,267 | 14% |
147 Properties |
| 2020 | £159,255 | -3% |
132 Properties |
| 2019 | £163,273 | - |
163 Properties |
| 2018 | £163,210 | 10% |
181 Properties |
| 2017 | £147,256 | 4% |
202 Properties |
| 2016 | £141,504 | 7% |
180 Properties |
Transport in Kirkwall
Please see below transportation links in this area:
