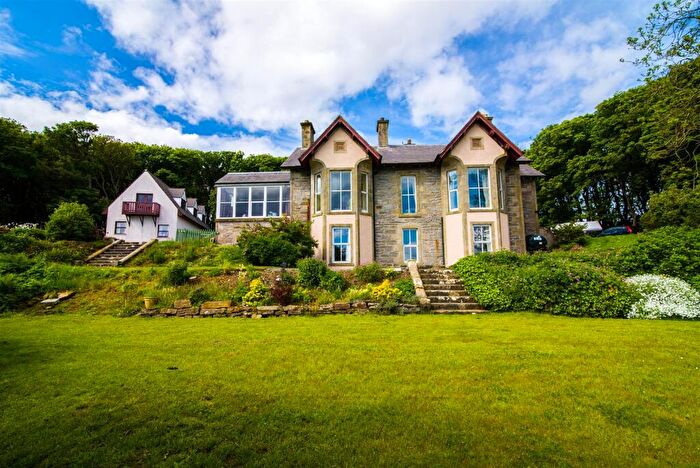
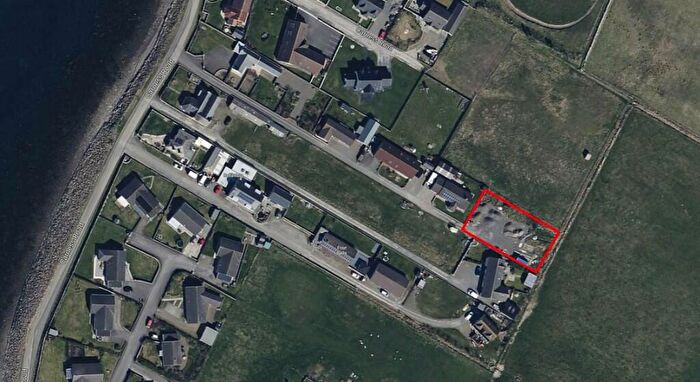
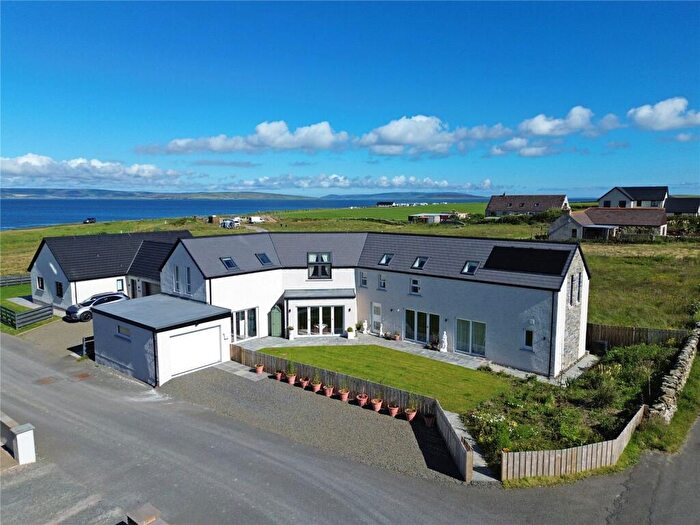
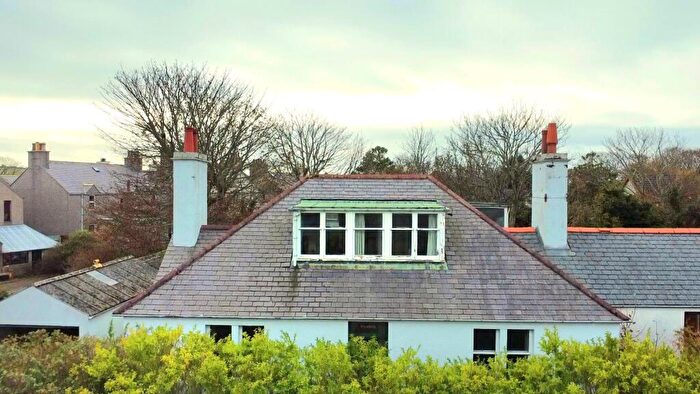
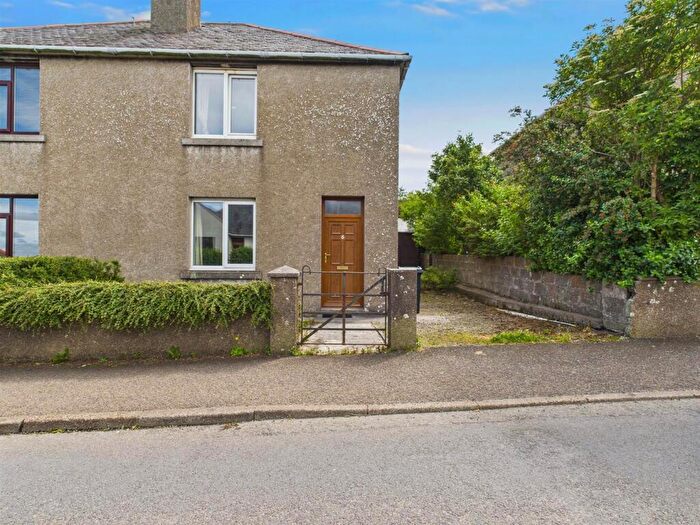
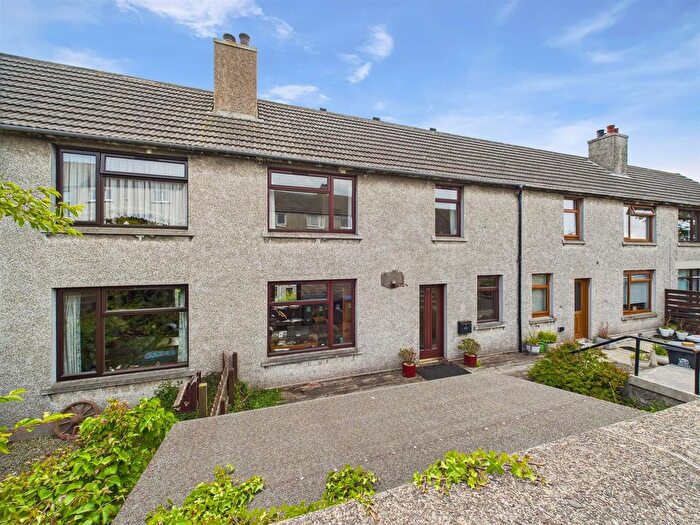
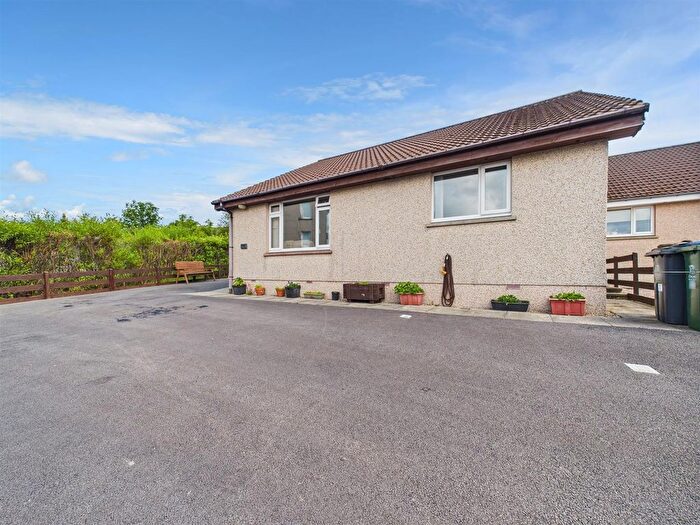
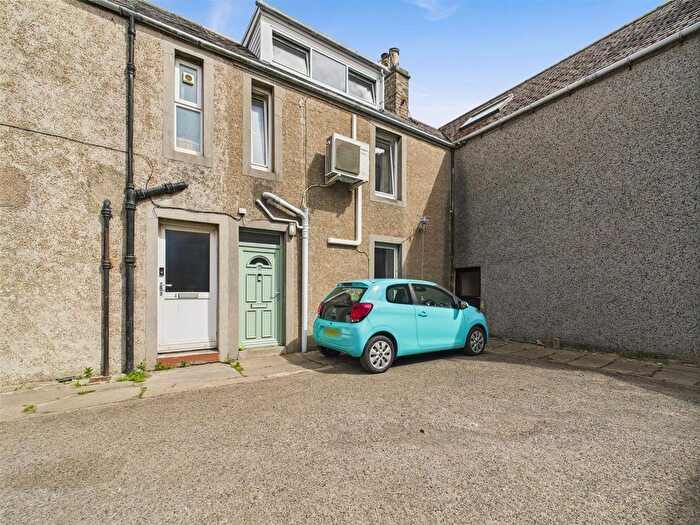
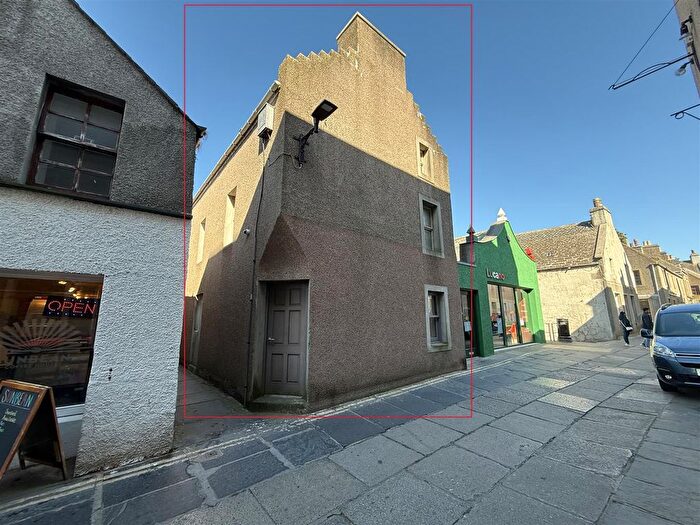
Houses for sale & to rent in Kirkwall East, Kirkwall
House Prices in Kirkwall East
Properties in Kirkwall East have an average house price of £227,860.00 and had 70 Property Transactions within the last 3 years¹.
Kirkwall East is an area in Kirkwall, Orkney Islands with 2,038 households², where the most expensive property was sold for £605,000.00.
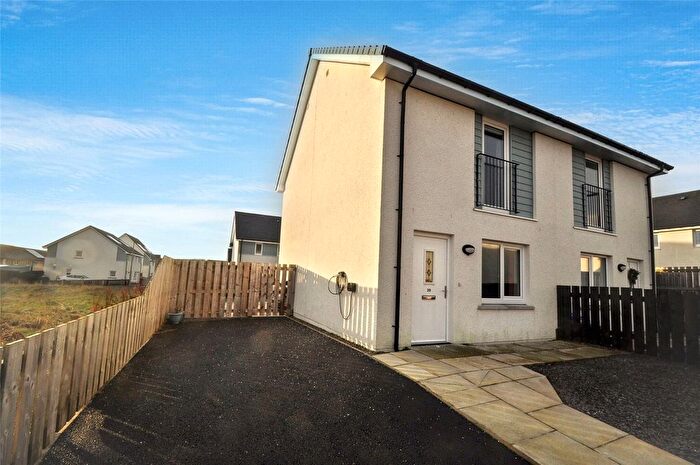
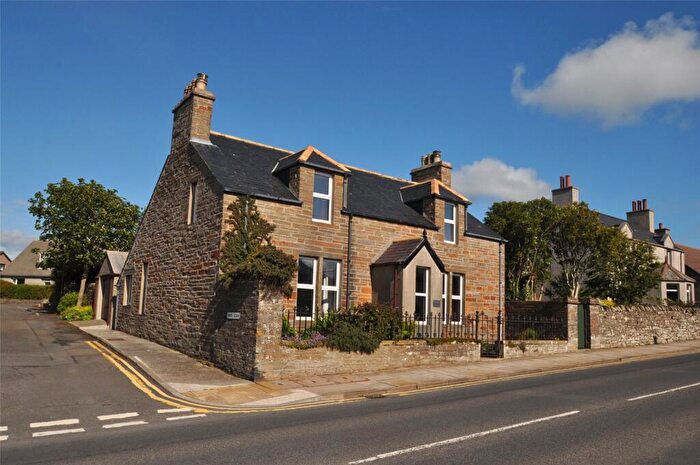
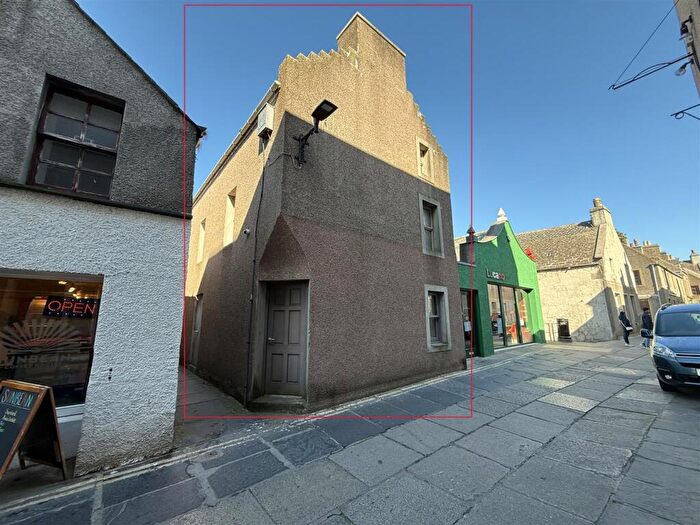
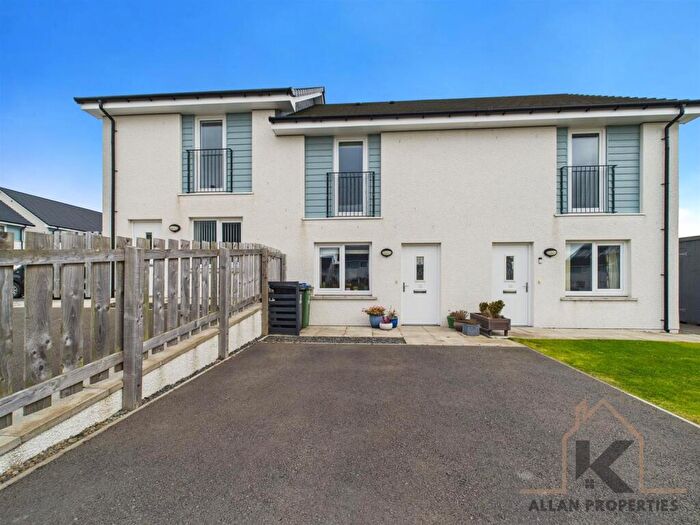
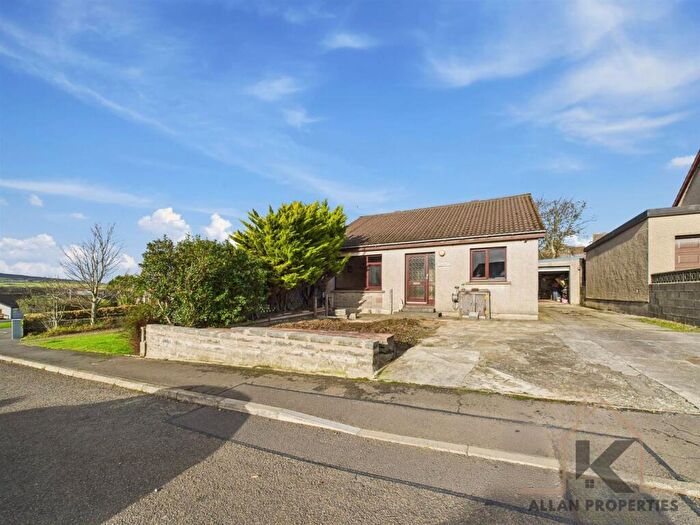
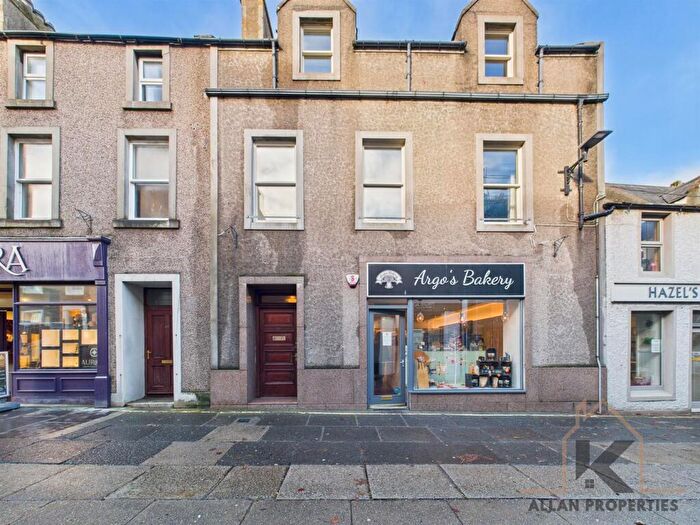
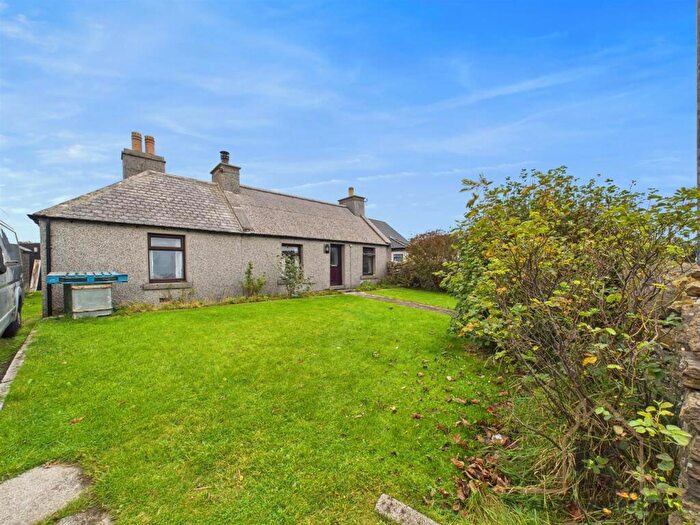
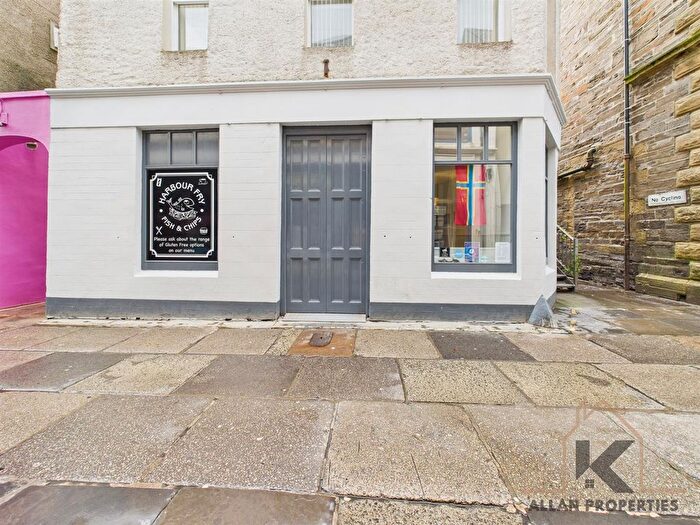
Properties for sale in Kirkwall East
Previously listed properties in Kirkwall East
Roads and Postcodes in Kirkwall East
Navigate through our locations to find the location of your next house in Kirkwall East, Kirkwall for sale or to rent.
| Streets | Postcodes |
|---|---|
| Albert Street | KW15 1HL |
| Annfield Crescent | KW15 1NS |
| Annfield Park | KW15 1FR |
| Bellevue Park | KW15 1XL |
| Berstane Loan | KW15 1TA |
| Berstane Park | KW15 1QU |
| Berstane Road | KW15 1LJ KW15 1NA KW15 1NB KW15 1SZ |
| Bignold Park Road | KW15 1PT |
| Boray Drive | KW15 1YZ |
| Bosquoy Road | KW15 1YR |
| Bridge Street Wynd | KW15 1JD |
| Broad Street | KW15 1DG KW15 1HF KW15 1NX |
| Burnett Brae | KW15 1GS |
| Burnside | KW15 1TF |
| Buttquoy Crescent | KW15 1JH |
| Buttquoy Drive | KW15 1JJ |
| Buttquoy Park | KW15 1JL |
| Buttquoy Place | KW15 1JN KW15 1QH |
| Carness Road | KW15 1UE |
| Carters Park Road | KW15 1ND |
| Castlehame Park | KW15 1XZ |
| Claymore Brae | KW15 1UQ |
| Claymore Court | KW15 1UP |
| Clumly Avenue | KW15 1YU |
| Craigiefield Park | KW15 1TE |
| Craigiefield Road | KW15 1UJ |
| Cromwell Court | KW15 1NP |
| Cromwell Crescent | KW15 1LW |
| Cromwell Drive | KW15 1NR |
| Cromwell Road | KW15 1LH KW15 1LN |
| Crowness Park | KW15 1GF |
| Cursiter Crescent | KW15 1XN |
| Cusiter Close | KW15 1FA |
| Deerness Road | KW15 1SN KW15 1SW |
| Dundas Crescent | KW15 1JQ KW15 1PS |
| Earls Court | KW15 1XY |
| Easdale Close | KW15 1YF |
| East Road | KW15 1HZ KW15 1LX |
| Easthill | KW15 1LY |
| Eastquoy Road | KW15 1LT |
| Enzie Road | KW15 1ZA |
| Firth Court | KW15 1HN |
| Flett Drive | KW15 1FW |
| Flett Park | KW15 1FX |
| Gairsay View | KW15 1ED |
| Garrioch Street | KW15 1PL |
| George Street | KW15 1PP KW15 1PW |
| Grassick Court | KW15 1UR |
| Grimsetter Drive | KW15 1XT |
| Grimsetter Place | KW15 1XS |
| Highbury Villas | KW15 1HT |
| Hordaland | KW15 1UN |
| Inganess Place | KW15 1WA |
| Inganess Road | KW15 1SP |
| Ingavoe Drive | KW15 1WT |
| Isbister Road | KW15 1YN |
| Islands View Road | KW15 1YP |
| King Street | KW15 1JF KW15 1NN |
| Laing Street | KW15 1GZ KW15 1NW |
| Linklater Drive | KW15 1XX |
| Logie Drive | KW15 1ZT |
| Lynn Crescent | KW15 1FF |
| Lynnpark | KW15 1SL |
| Mackenzies Drive | KW15 1FE |
| Mackenzies Park | KW15 1FD |
| Mackenzies Place | KW15 1FB |
| Meadow Crescent | KW15 1HA |
| Meadow Drive | KW15 1EY |
| Meadow Park | KW15 1FN |
| Mill Street | KW15 1NL |
| Moar Drive | KW15 1FS |
| Mount Drive | KW15 1LL |
| Otterswick Crescent | KW15 1TL |
| Palace Gardens | KW15 1PB |
| Palace Road | KW15 1PA |
| Papdale Close | KW15 1QP |
| Papdale Court | KW15 1XP |
| Papdale Crescent | KW15 1JS |
| Papdale Drive | KW15 1JX |
| Papdale Place | KW15 1JU |
| Papdale Road | KW15 1JT |
| Park Avenue | KW15 1PX |
| Peace Crescent | KW15 1YJ |
| Queen Street | KW15 1JE |
| Reid Crescent | KW15 1UD |
| Rendall Road | KW15 1ZS |
| Repeater Road | KW15 1ZP |
| Rope Walk | KW15 1XJ |
| Royal Oak Court | KW15 1US |
| Sabiston Crescent | KW15 1YT |
| School Place | KW15 1JG KW15 1NY KW15 9SA |
| Skaill Road | KW15 1YS |
| Slater Street | KW15 1PQ |
| Spences Square | KW15 1EZ |
| Springfield Drive | KW15 1XU |
| St Catherines Place | KW15 1HX |
| St Rognvald Street | KW15 1PR |
| The Keelies | KW15 1GA |
| The Meadows | KW15 1DE |
| The Quadrant | KW15 1NF |
| Thoms Street | KW15 1PF KW15 1PN |
| Victoria Lane | KW15 1DY |
| Victoria Road | KW15 1DZ KW15 1JP |
| Victoria Street | KW15 1DN KW15 1DQ |
| Viewfield Drive | KW15 1RB |
| Wasdale Crescent | KW15 1YW |
| Watergate | KW15 1JW KW15 1PD |
| Watersfield Crescent | KW15 1ZR |
| Watersfield Road | KW15 1FQ |
| Watson Close | KW15 1WD |
| Watson Drive | KW15 1FG |
| Watson Park | KW15 1WB |
| Watson Place | KW15 1FH |
| Weyland Bay | KW15 1TD |
| Weyland Drive | KW15 1WW |
| Weyland Park | KW15 1LP |
| Weyland Terrace | KW15 1LS |
| White Street | KW15 1PG |
| Willow Court | KW15 1PE |
| Willow Road | KW15 1NH KW15 1NJ KW15 1PH KW15 1PJ |
| Willowburn Road | KW15 1NE KW15 1NG |
| Work Road | KW15 1UF |
| KW15 1EB KW15 1FU KW15 1GQ KW15 1HG KW15 1JR KW15 1NT KW15 1PU KW15 1QJ KW15 1QL KW15 1QN KW15 1QQ KW15 1QR KW15 1QW KW15 1RU KW15 1SR KW15 1SU KW15 1TB KW15 1UT KW15 1UU KW15 1UX KW15 1UY KW15 1UZ KW15 1WU KW15 1XA KW15 1XB KW15 1XD KW15 1XE KW15 1XF KW15 1XG KW15 1XH KW15 1XQ |
Transport near Kirkwall East
- FAQ
- Price Paid By Year
Frequently asked questions about Kirkwall East
What is the average price for a property for sale in Kirkwall East?
The average price for a property for sale in Kirkwall East is £227,860. This amount is 16% higher than the average price in Kirkwall. There are 175 property listings for sale in Kirkwall East.
Which train stations are available in or near Kirkwall East?
Some of the train stations available in or near Kirkwall East are Thurso, Georgemas Junction and Wick.
Property Price Paid in Kirkwall East by Year
The average sold property price by year was:
| Year | Average Sold Price | Price Change |
Sold Properties
|
|---|---|---|---|
| 2023 | £263,658 | 17% |
13 Properties |
| 2022 | £219,696 | 9% |
57 Properties |
| 2021 | £198,942 | 19% |
71 Properties |
| 2020 | £161,594 | -8% |
57 Properties |
| 2019 | £175,287 | 6% |
84 Properties |
| 2018 | £165,173 | 2% |
80 Properties |
| 2017 | £161,643 | 6% |
84 Properties |
| 2016 | £151,659 | 12% |
76 Properties |
| 2015 | £133,249 | 1% |
67 Properties |
| 2014 | £132,582 | -3% |
71 Properties |
| 2013 | £137,004 | 10% |
63 Properties |
| 2012 | £123,434 | -7% |
54 Properties |
| 2011 | £132,341 | 11% |
54 Properties |
| 2010 | £117,628 | 5% |
56 Properties |
| 2009 | £112,316 | -4% |
59 Properties |
| 2008 | £116,443 | -4% |
73 Properties |
| 2007 | £121,465 | 17% |
58 Properties |
| 2006 | £100,380 | 15% |
66 Properties |
| 2005 | £85,195 | -4% |
75 Properties |
| 2004 | £88,185 | 34% |
82 Properties |
| 2003 | £58,251 | 13% |
58 Properties |
| 2002 | £50,594 | 15% |
10 Properties |
| 2001 | £42,922 | -35% |
10 Properties |
| 2000 | £57,887 | - |
4 Properties |

