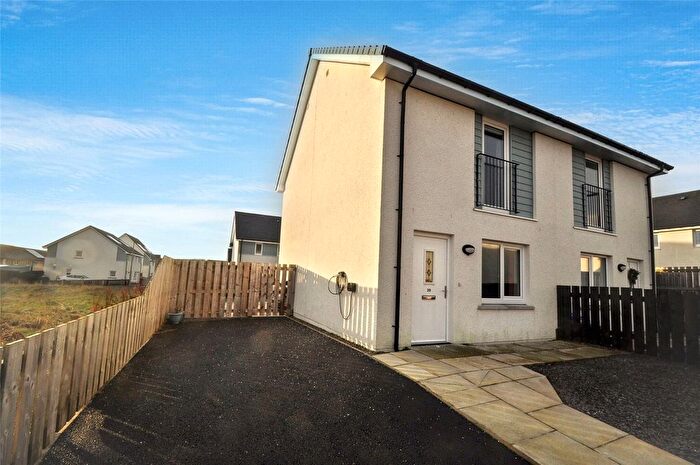
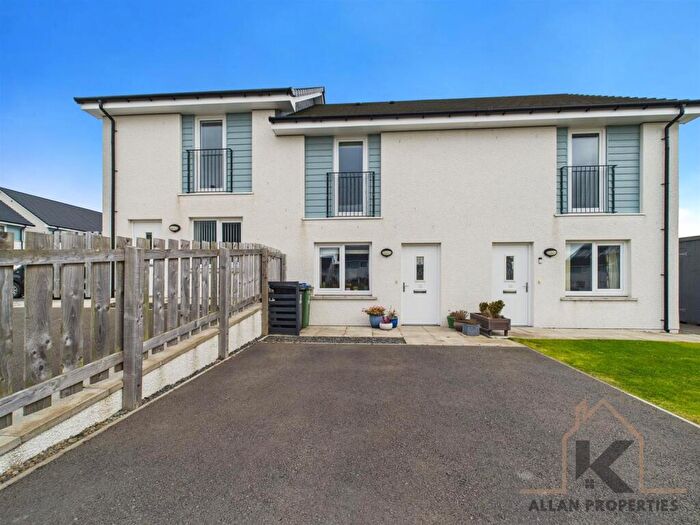
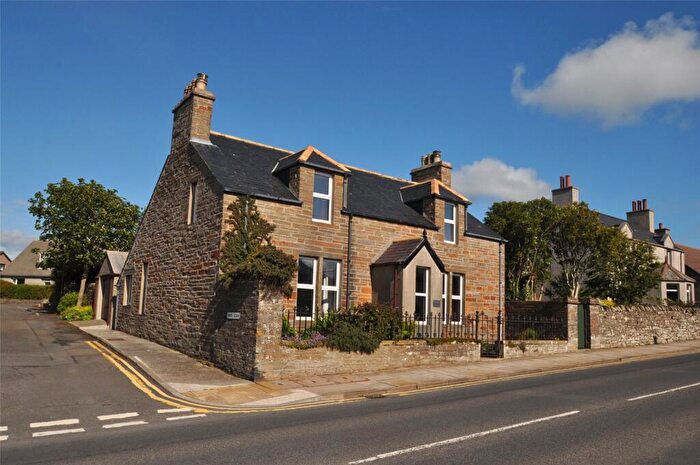
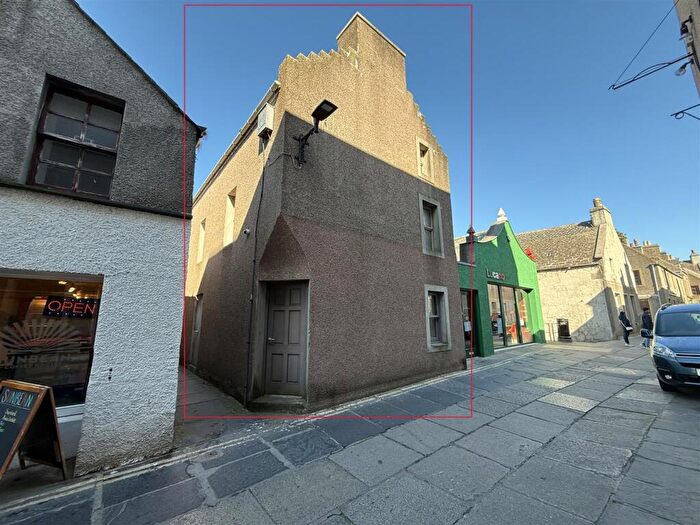
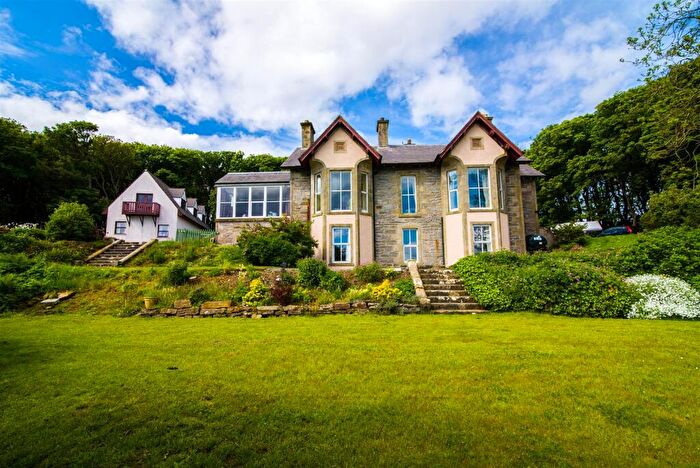
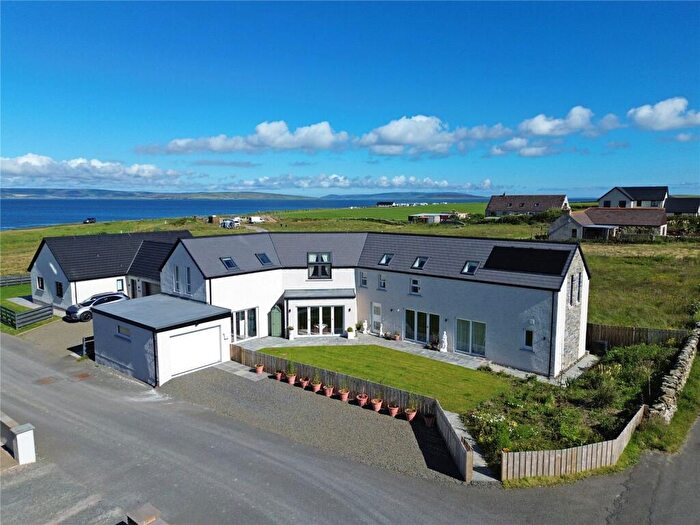
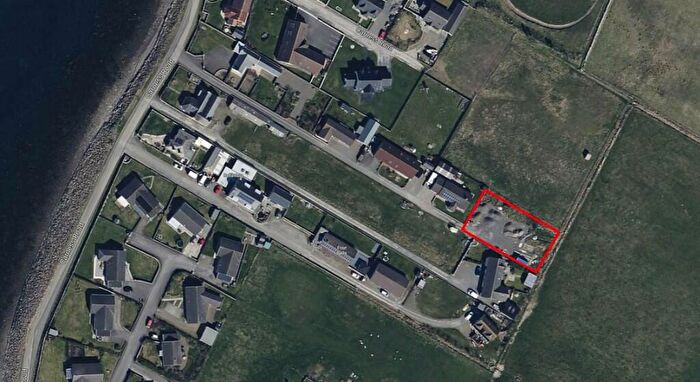
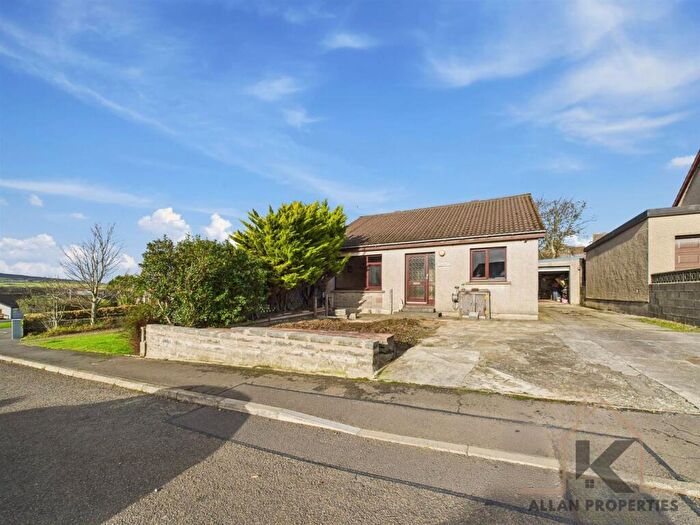
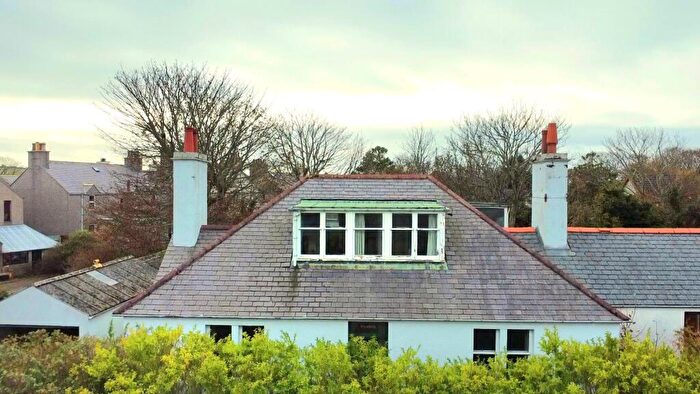
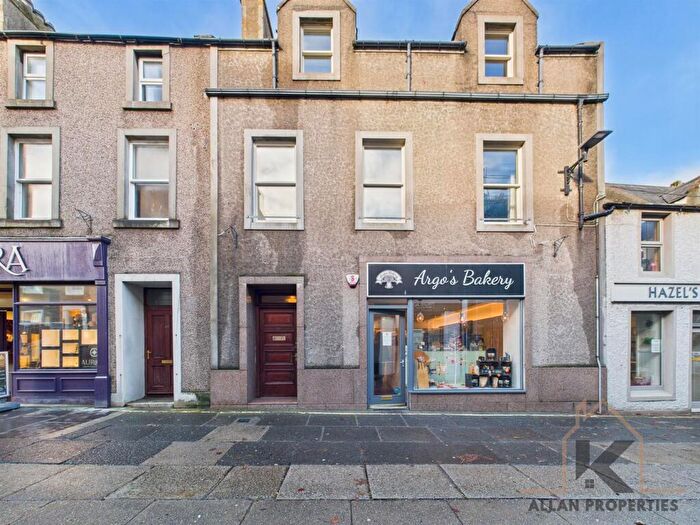
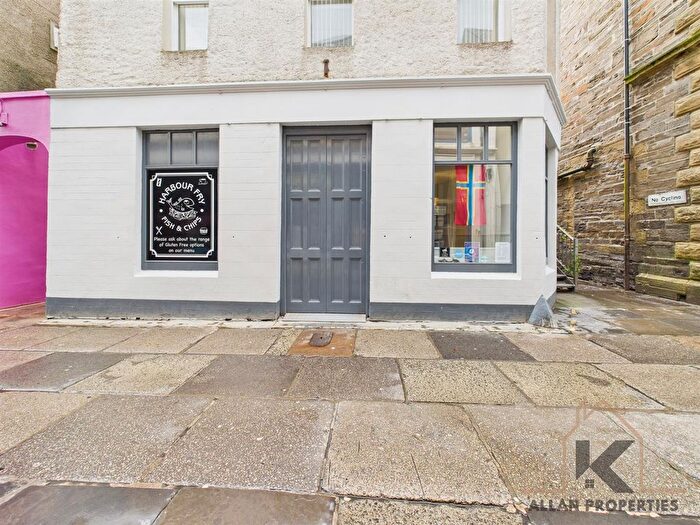
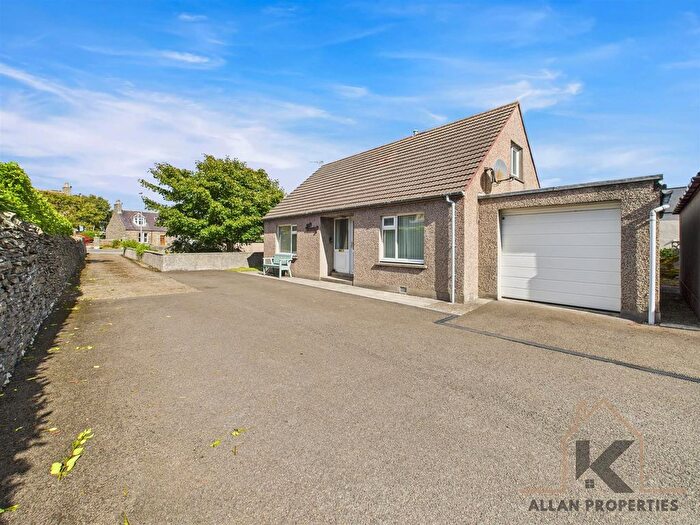
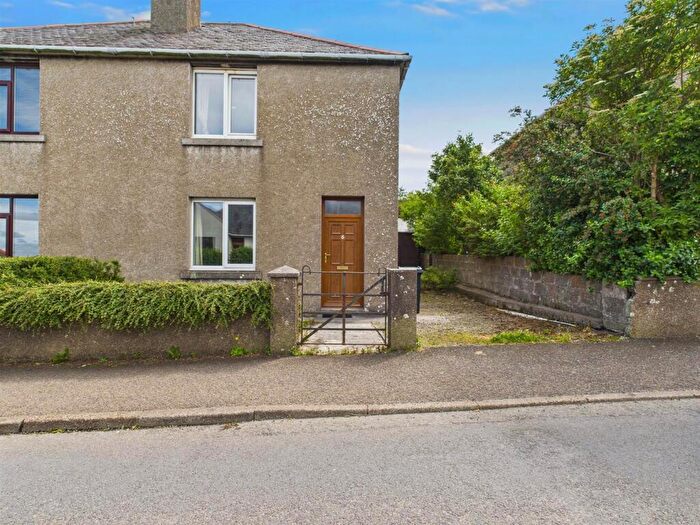
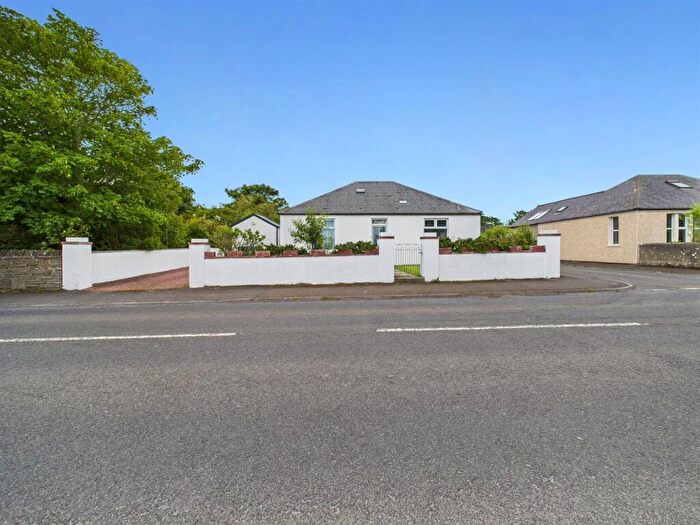
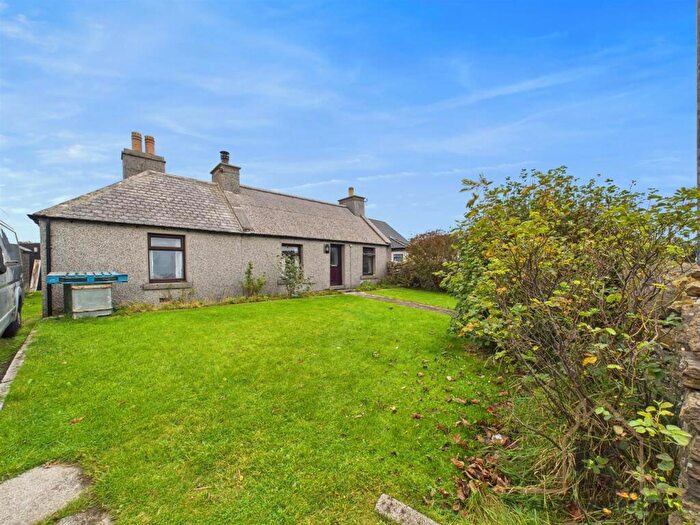
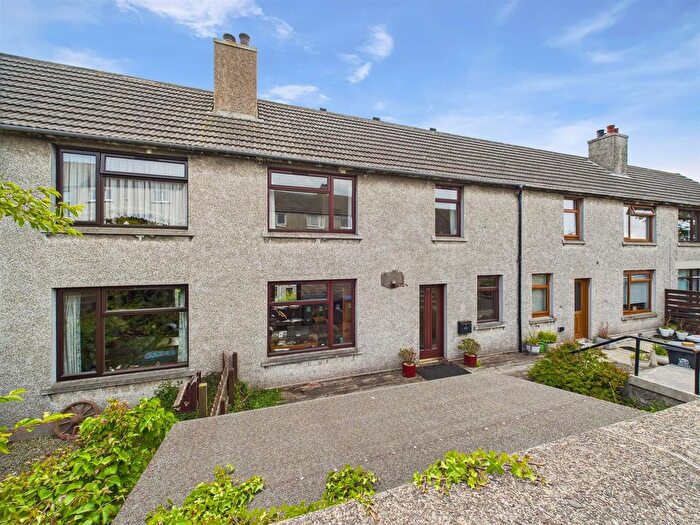
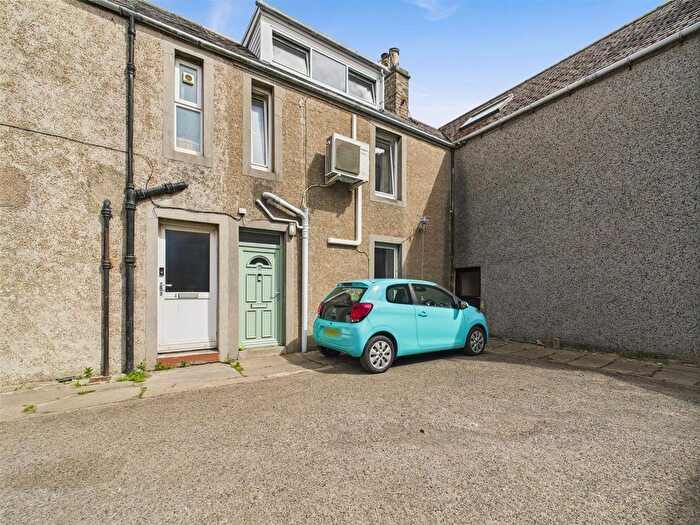
Houses for sale & to rent in Kirkwall West and Orphir, Kirkwall
House Prices in Kirkwall West and Orphir
Properties in Kirkwall West and Orphir have an average house price of £169,574.00 and had 78 Property Transactions within the last 3 years¹.
Kirkwall West and Orphir is an area in Kirkwall, Orkney Islands with 1,717 households², where the most expensive property was sold for £330,000.00.
Properties for sale in Kirkwall West and Orphir
Previously listed properties in Kirkwall West and Orphir
Roads and Postcodes in Kirkwall West and Orphir
Navigate through our locations to find the location of your next house in Kirkwall West and Orphir, Kirkwall for sale or to rent.
| Streets | Postcodes |
|---|---|
| Albert Street | KW15 1HP KW15 1HQ |
| Ayre Road | KW15 1QX KW15 1QZ |
| Baikies Buildings | KW15 1AF |
| Blackhill Road | KW15 1FP |
| Bridge Street | KW15 1HR KW15 1LD |
| Broad Street | KW15 1DH KW15 1HE |
| Broad Street Gardens | KW15 1GY |
| Broadsands Road | KW15 1BP |
| Burgh Road | KW15 1AH |
| Burnmouth Road | KW15 1NU KW15 1QY |
| Busant Drive | KW15 1XW |
| Castle Street | KW15 1DF KW15 1HD |
| Castle Yards | KW15 1TG |
| Craigie Crescent | KW15 1EP KW15 1ER |
| Crantit Park | KW15 1SJ |
| Crowness Crescent | KW15 1GJ |
| Crowness Place | KW15 1RA |
| Crowness Road | KW15 1RG |
| Dunnets Close | KW15 1ZQ |
| Earl Sigurd Street | KW15 1QE |
| Earl Thorfinn Street | KW15 1QF |
| East Road | KW15 1HY |
| Firths Square | KW15 1AT |
| Foreland Road | KW15 1NZ |
| Frasers Close | KW15 1AS KW15 1DT |
| Garden Street | KW15 1JA |
| Garrison Road | KW15 1GN KW15 1RE KW15 1RH |
| Glaitness Court | KW15 1GW |
| Glaitness Park | KW15 1DB |
| Glaitness Road | KW15 1BA KW15 1TN |
| Gold Drive | KW15 1HH |
| Grainepark | KW15 1UL |
| Grainshore Drive | KW15 1GG |
| Grainshore Road | KW15 1FL |
| Great Western Road | KW15 1AN KW15 1QS |
| Gunns Close | KW15 1DU |
| Harbour Street | KW15 1LE |
| Hatston Park | KW15 1UB |
| Hatston Pier Road | KW15 1ZL |
| High Street | KW15 1AZ |
| Holm Branch Road | KW15 1RY |
| Holm Road | KW15 1PY KW15 1RT KW15 1RX |
| Hornersquoy Lane | KW15 1BE |
| J T Flett Park | KW15 1RN |
| Jubilee Court | KW15 1XR |
| Junction Road | KW15 1AA KW15 1AB KW15 1AG KW15 1AR KW15 1AX KW15 1DD KW15 1JY KW15 1LB |
| King Haakon Street | KW15 1PZ |
| Kirklands Road | KW15 1EU |
| Langskaill Place | KW15 1WY |
| Laverock Road | KW15 1EE |
| Liberator Close | KW15 1LZ |
| Liberator Court | KW15 1DA |
| Liberator Drive | KW15 1ZU |
| Main Street | KW15 1BU |
| Manse Lane | KW15 1GH |
| Manse Road | KW15 1BS |
| Matches Square | KW15 1AU |
| Mcleod Drive | KW15 1ZG |
| Mounthoolie Lane | KW15 1HW KW15 1LA KW15 1WZ |
| Mounthoolie Place | KW15 1JZ |
| Muddisdale Road | KW15 1LR |
| Neuketineuks Lane | KW15 1WX |
| New Scapa Road | KW15 1BH KW15 1BL KW15 1BN KW15 1BQ KW15 1BT |
| Nicolson Street | KW15 1BD |
| Olaf Place | KW15 1AP |
| Old Finstown Road | KW15 1TW |
| Old Scapa Road | KW15 1BB |
| Peerie Sea Court | KW15 1NQ |
| Pickaquoy Drive | KW15 1ZJ |
| Pickaquoy Place | KW15 1FY |
| Pickaquoy Road | KW15 1RP KW15 1RR |
| Pipersquoy Drive | KW15 1EH |
| Pipersquoy Road | KW15 1BW KW15 1EF KW15 1EG KW15 1EQ |
| Pipersquoy Terrace | KW15 1EL |
| Quarryfield Road | KW15 1GD |
| Queen Elizabeth Way | KW15 1ZN |
| Quoybanks Crescent | KW15 1EN KW15 1EW |
| Quoybanks Drive | KW15 1EJ |
| Quoybanks Place | KW15 1ES |
| Royal Oak Road | KW15 1RF |
| Scapa Brae | KW15 1WG |
| Scapa Court | KW15 1BJ |
| Scapa Crescent | KW15 1RL |
| School Place | KW15 9ZZ |
| Scott's Road | KW15 1GR |
| Seafire Road | KW15 1GT |
| Shore Street | KW15 1LG |
| Skua Road | KW15 1GP |
| Somerville Square | KW15 1BX |
| Soulisquoy Place | KW15 1TJ |
| Sparrowhawk Road | KW15 1GE |
| St Magnus Lane | KW15 1DJ |
| St Olafs Wynd | KW15 1JB |
| St Rognvalds Way | KW15 1SQ |
| Summerdale Drive | KW15 1ET |
| Sunnybank Road | KW15 1TP |
| Sutherland Court | KW15 1DL |
| Sutherland Park | KW15 1DR |
| Sutherland Place | KW15 1EX |
| Swordfish Road | KW15 1GL |
| Tankerness Lane | KW15 1AQ |
| The Mound | KW15 1ZH |
| The Pier | KW15 1HU |
| Union Street | KW15 1EA |
| Upper Crantit Road | KW15 1RW |
| Viking Place | KW15 1SH |
| Walliwall Place | KW15 1LU |
| Walliwall Road | KW15 1LQ |
| Walls Lane | KW15 1DS |
| Warrenfield Crescent | KW15 1QB KW15 1QD |
| Warrenfield Drive | KW15 1QA |
| Warrens Walk | KW15 1DX |
| Wellington Street | KW15 1AY |
| West Castle Street | KW15 1AE KW15 1GU |
| West Tankerness Lane | KW15 1AL |
| Zetland Road | KW15 1UG |
| KW15 1BF KW15 1BG KW15 1BY KW15 1BZ KW15 1DP KW15 1FJ KW15 1FT KW15 1QG KW15 1RD KW15 1RS KW15 1RZ KW15 1SA KW15 1SB KW15 1SD KW15 1SE KW15 1SF KW15 1SG KW15 1TQ KW15 1TR KW15 1TY KW15 1TZ KW15 1UA KW15 1UH KW15 1UW KW15 1WQ KW15 1YA KW15 9BD KW15 9BG KW15 9BJ KW15 1RJ KW15 9BP KW15 9BR |
Transport near Kirkwall West and Orphir
- FAQ
- Price Paid By Year
Frequently asked questions about Kirkwall West and Orphir
What is the average price for a property for sale in Kirkwall West and Orphir?
The average price for a property for sale in Kirkwall West and Orphir is £169,574. This amount is 14% lower than the average price in Kirkwall. There are 178 property listings for sale in Kirkwall West and Orphir.
Which train stations are available in or near Kirkwall West and Orphir?
Some of the train stations available in or near Kirkwall West and Orphir are Thurso, Georgemas Junction and Wick.
Property Price Paid in Kirkwall West and Orphir by Year
The average sold property price by year was:
| Year | Average Sold Price | Price Change |
Sold Properties
|
|---|---|---|---|
| 2023 | £161,604 | -6% |
12 Properties |
| 2022 | £171,023 | -0,1% |
66 Properties |
| 2021 | £171,182 | 8% |
73 Properties |
| 2020 | £158,089 | 5% |
72 Properties |
| 2019 | £150,498 | -7% |
79 Properties |
| 2018 | £161,707 | 18% |
90 Properties |
| 2017 | £133,308 | -1% |
104 Properties |
| 2016 | £135,084 | 4% |
91 Properties |
| 2015 | £129,618 | 12% |
73 Properties |
| 2014 | £113,643 | -8% |
68 Properties |
| 2013 | £122,656 | 3% |
64 Properties |
| 2012 | £119,009 | 11% |
60 Properties |
| 2011 | £105,661 | 12% |
53 Properties |
| 2010 | £92,965 | -34% |
51 Properties |
| 2009 | £124,669 | 17% |
56 Properties |
| 2008 | £102,939 | -7% |
73 Properties |
| 2007 | £109,726 | 9% |
67 Properties |
| 2006 | £99,986 | -33% |
83 Properties |
| 2005 | £133,041 | 44% |
91 Properties |
| 2004 | £74,136 | 29% |
89 Properties |
| 2003 | £52,626 | 8% |
69 Properties |
| 2002 | £48,238 | 24% |
10 Properties |
| 2001 | £36,796 | -22% |
8 Properties |
| 2000 | £44,963 | - |
8 Properties |

