
Houses for sale in Orkney Islands, Scotland
House Prices in Orkney Islands
Properties in Orkney Islands have
an average house price of
£192k
and had 298 Property Transactions
within the last 3 years.¹
Orkney Islands is a location in
Scotland with
9,695 households², where the most expensive property was sold for £545k.
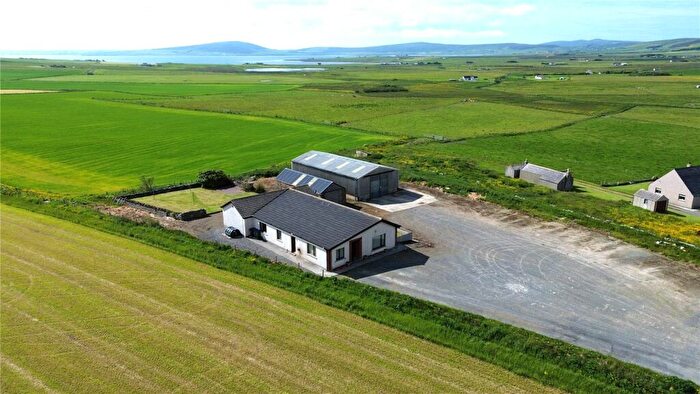
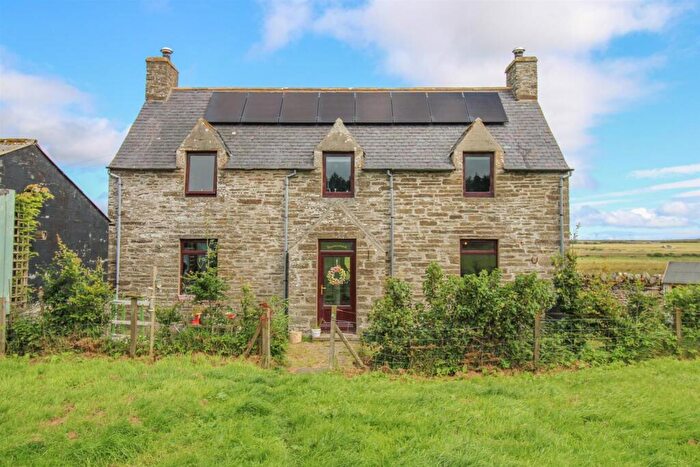
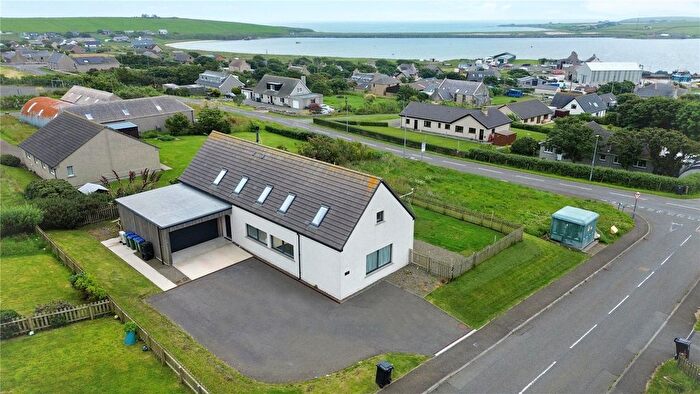
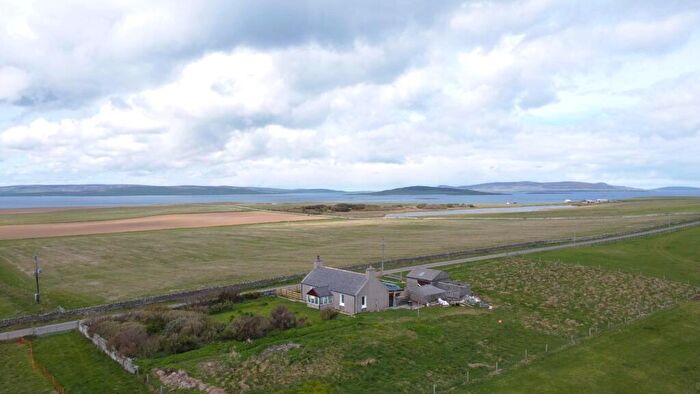
Properties for sale in Orkney Islands

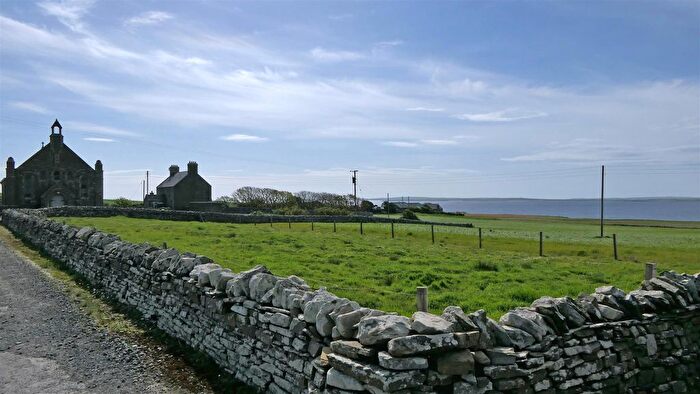
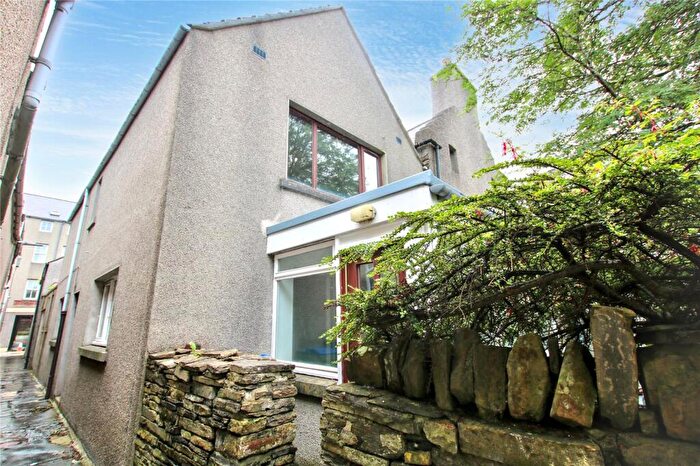
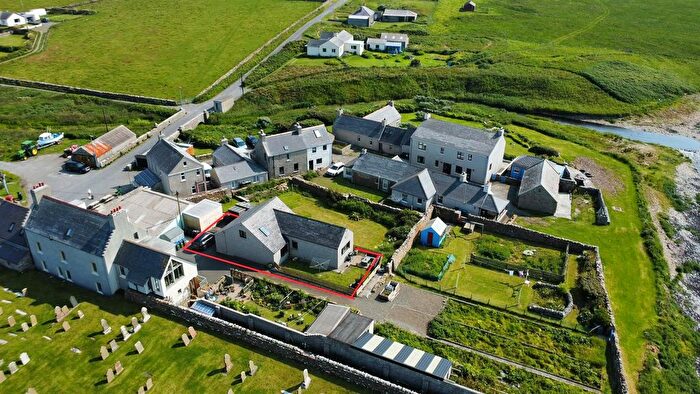
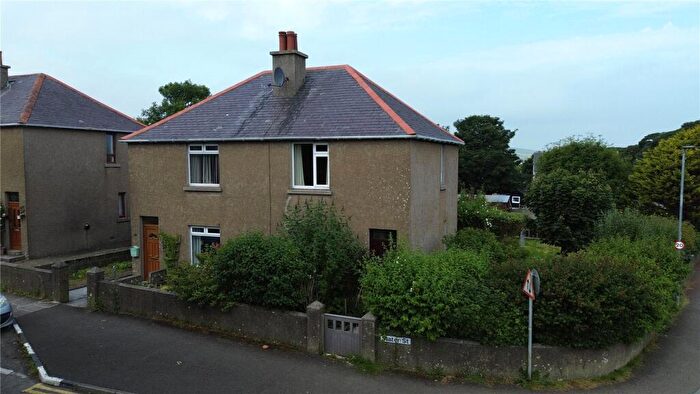
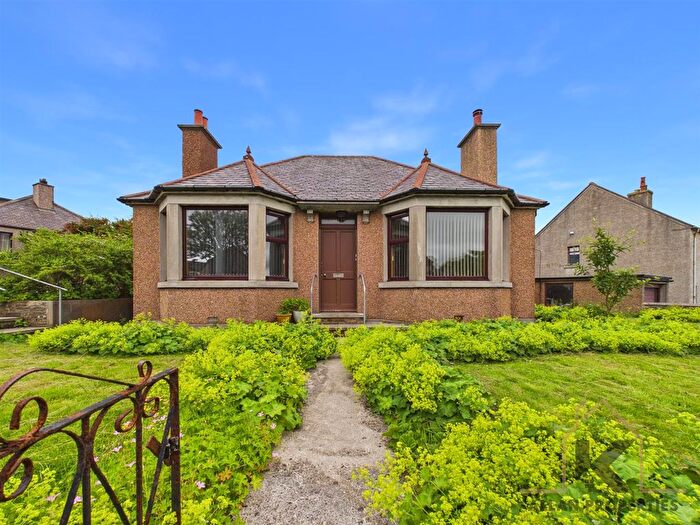
![]()
If you are looking to sell your house, let it out, or receive a property valuation, an expert can help you.
Click the button below to get started.


Towns in Orkney Islands
Navigate through our locations to find the location of your next house in Orkney Islands, Scotland for sale or to rent.
Property price trends in Orkney Islands
According to the latest Registers of Scotland data, the average home in Orkney Islands sold for £193,200 in 2026. That figure comes from a substantial record of 7,095 sales logged over the past 26 years.
Prices have softened over the last three years. Compared with 2023, when the typical sale came in around £201,879, that's a fall of roughly 4.3%.
Looking back five years, average prices are up about 3.8% since 2021, a gain of around £7,066 in cash terms.
Zoom out to the past decade for the fuller picture. Back in 2016, homes here averaged £137,495, so the typical sold price has climbed about 40.5% since then, roughly 3.5% a year. Stretch the view to fifteen years and that annual pace eases back to about 3.1%.
Frequently asked questions about Orkney Islands
What is the average price for a property for sale in Orkney Islands?
The average price for a property for sale in Orkney Islands is £192,131. This amount is 5% lower than the average price in Scotland. There are 1,584 property listings for sale in Orkney Islands.
What locations have the most expensive properties for sale in Orkney Islands?
The locations with the most expensive properties for sale in Orkney Islands are Stromness at an average of £195,886 and Kirkwall at an average of £195,350.
What locations have the most affordable properties for sale in Orkney Islands?
The location with the most affordable properties for sale in Orkney Islands is Orkney at an average of £180,711.
Which train stations are available in or near Orkney Islands?
Some of the train stations available in or near Orkney Islands are Thurso, Georgemas Junction and Wick.
Property Price Paid in Orkney Islands by Year
The average sold property price by year was:
| Year | Average Sold Price | Price Change |
Sold Properties
|
|---|---|---|---|
| 2026 | £193,200 | 3% |
10 Properties |
| 2025 | £186,775 | 2% |
76 Properties |
| 2024 | £183,920 | -10% |
93 Properties |
| 2023 | £201,879 | -4% |
119 Properties |
| 2022 | £210,458 | 12% |
317 Properties |
| 2021 | £186,134 | 11% |
395 Properties |
| 2020 | £165,259 | 5% |
337 Properties |
| 2019 | £156,404 | 0,4% |
378 Properties |
| 2018 | £155,818 | 5% |
384 Properties |
| 2017 | £147,494 | 7% |
402 Properties |
Transport in Orkney Islands
Please see below transportation links in this area:
