
Houses for sale & to rent in Pitlochry, Perth and Kinross
House Prices in Pitlochry
Properties in Pitlochry have an average house price of £251k and had 120 Property Transactions within the last 3 years.¹
Pitlochry is an area in Perth and Kinross with 2,705 households², where the most expensive property was sold for £780k.
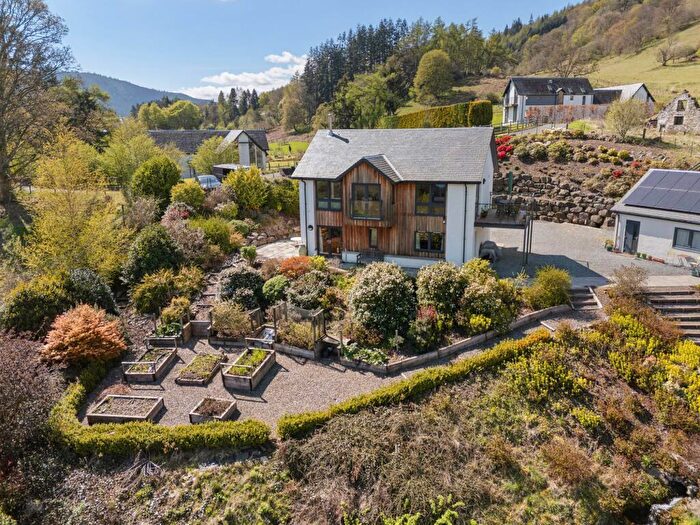
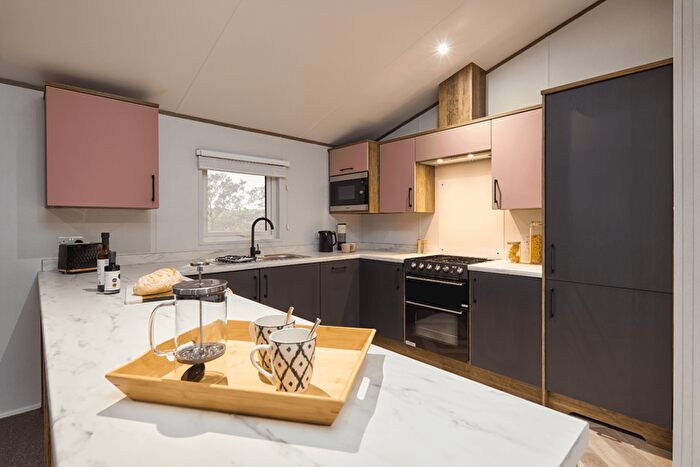
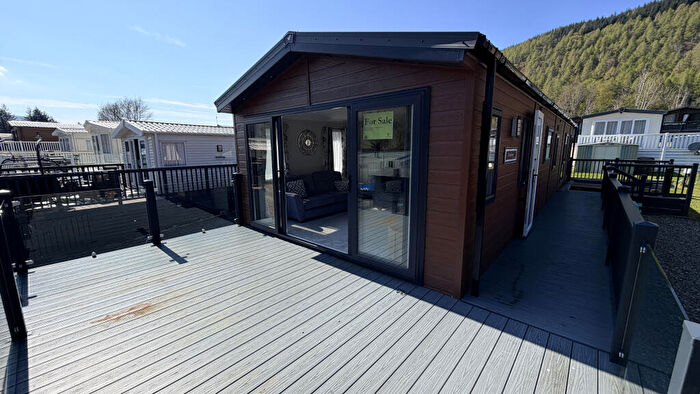
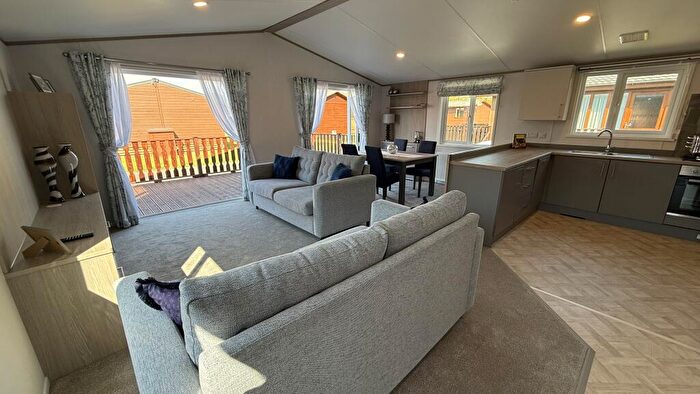
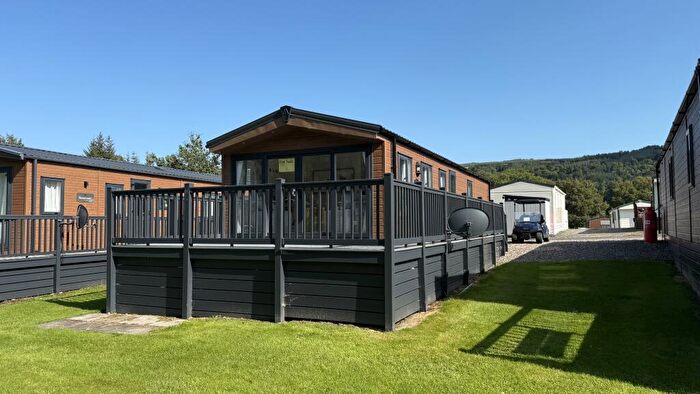
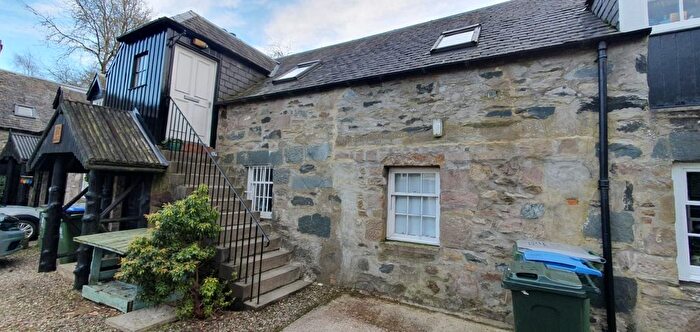
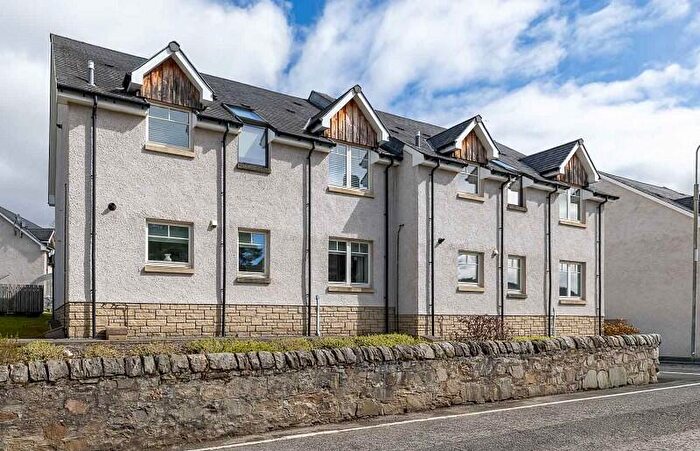
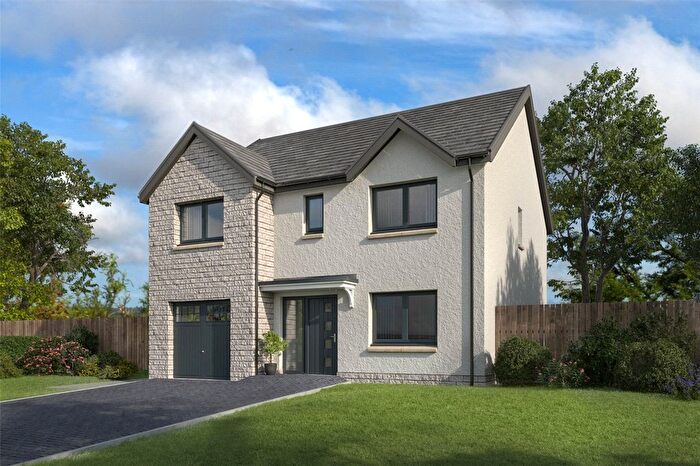
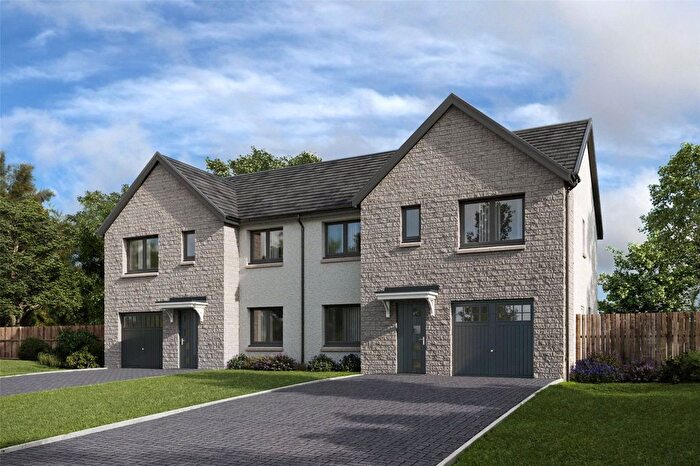
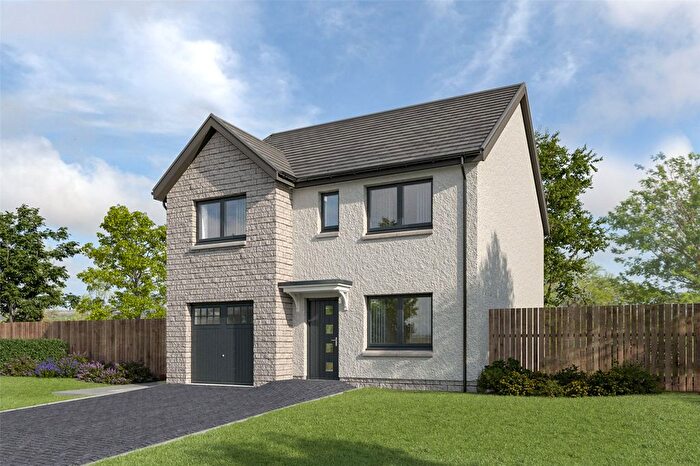
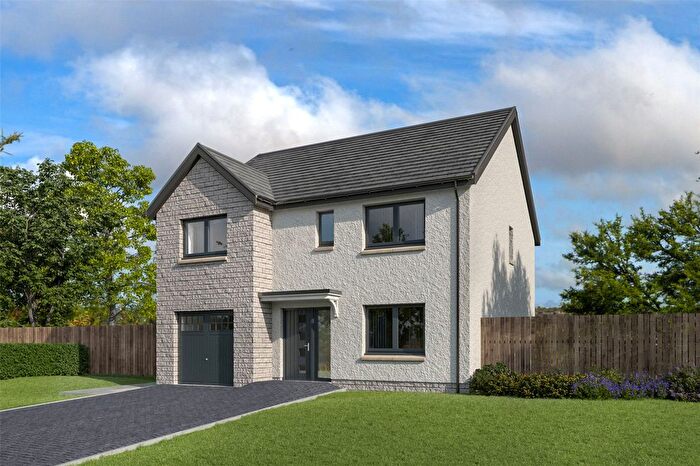
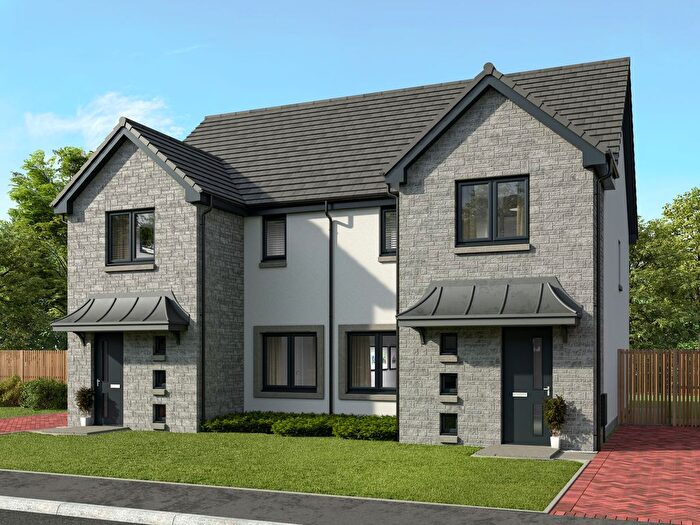
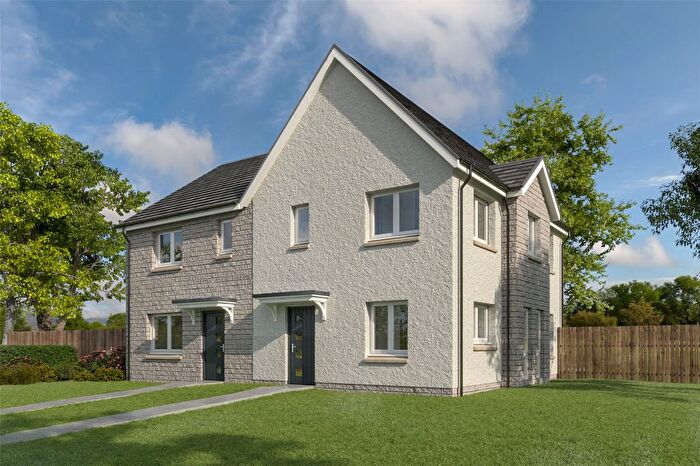
Properties for sale in Pitlochry
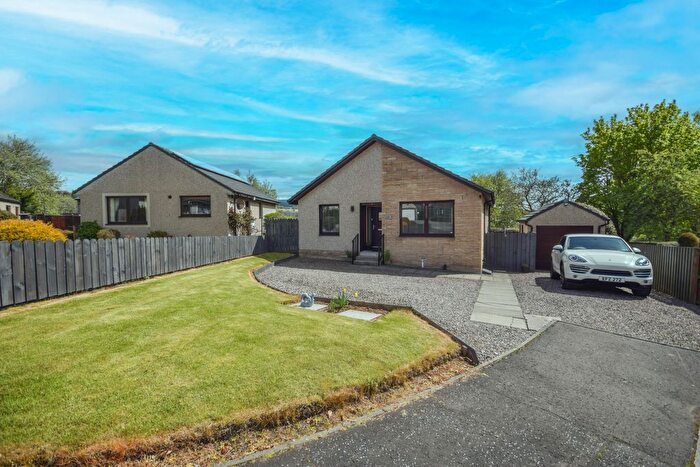
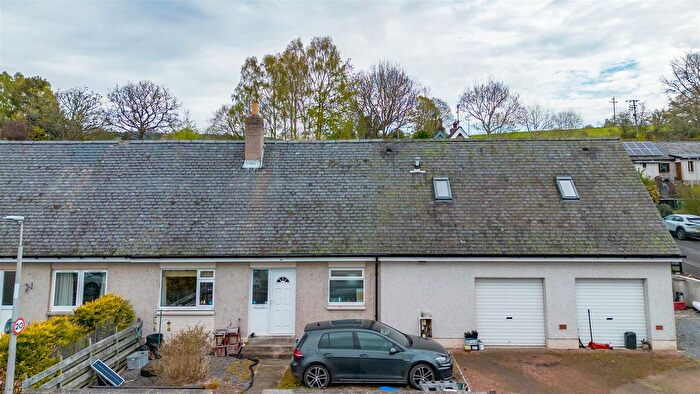
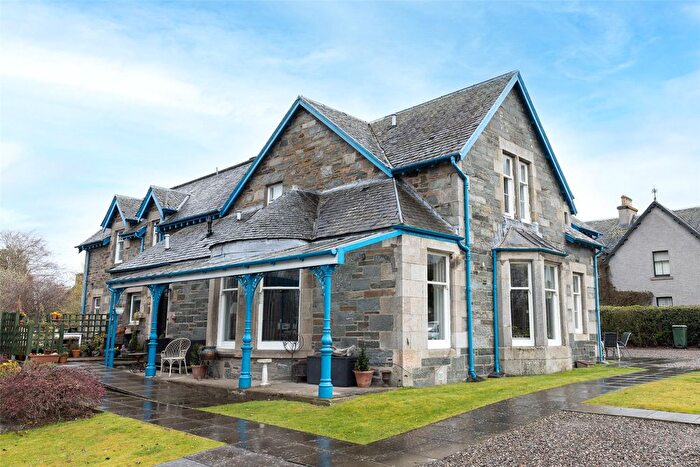
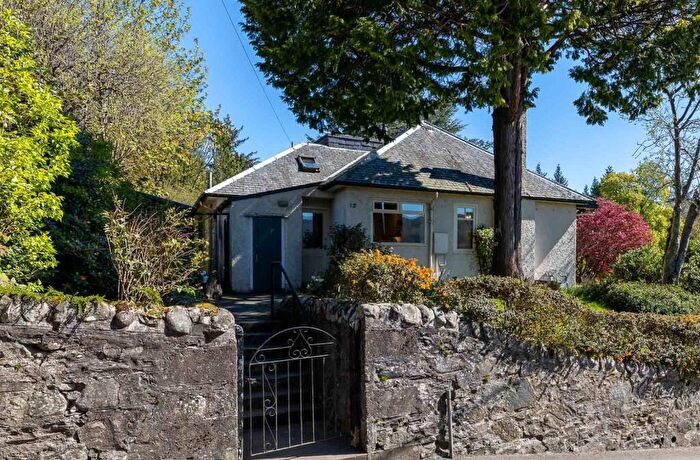
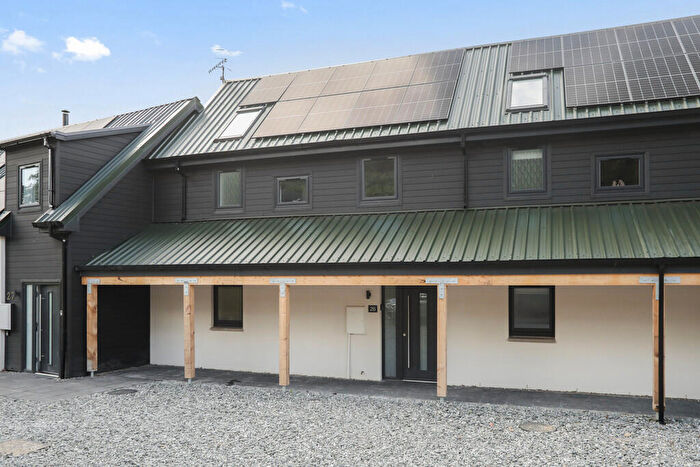
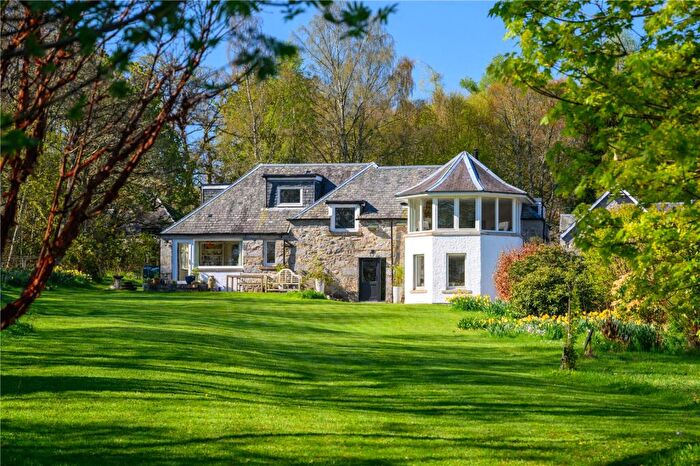
![]()
If you are looking to sell your house, let it out, or receive a property valuation, an expert can help you.
Click the button below to get started.


Neighbourhoods in Pitlochry
Navigate through our locations to find the location of your next house in Pitlochry, Perth and Kinross for sale or to rent.
Transport in Pitlochry
Please see below transportation links in this area:

- FAQ
- Price Paid By Year
Frequently asked questions about Pitlochry
What is the average price for a property for sale in Pitlochry?
The average price for a property for sale in Pitlochry is £251,170. This amount is 14% higher than the average price in Perth and Kinross. There are 2,143 property listings for sale in Pitlochry.
Which train stations are available in or near Pitlochry?
Some of the train stations available in or near Pitlochry are Pitlochry, Blair Atholl and Dunkeld and Birnam.
Property Price Paid in Pitlochry by Year
The average sold property price by year was:
| Year | Average Sold Price | Price Change |
Sold Properties
|
|---|---|---|---|
| 2025 | £241,819 | 6% |
37 Properties |
| 2024 | £226,129 | -21% |
32 Properties |
| 2023 | £273,665 | -4% |
51 Properties |
| 2022 | £283,547 | -0,1% |
107 Properties |
| 2021 | £283,724 | 6% |
190 Properties |
| 2020 | £268,104 | 17% |
116 Properties |
| 2019 | £222,039 | -4% |
120 Properties |
| 2018 | £230,847 | 8% |
123 Properties |
| 2017 | £211,379 | -12% |
123 Properties |
| 2016 | £237,690 | 6% |
109 Properties |
| 2015 | £224,388 | 2% |
125 Properties |
| 2014 | £219,743 | -0,2% |
137 Properties |
| 2013 | £220,273 | 1% |
112 Properties |
| 2012 | £217,074 | -10% |
85 Properties |
| 2011 | £239,369 | 4% |
104 Properties |
| 2010 | £230,237 | -14% |
84 Properties |
| 2009 | £262,085 | 13% |
87 Properties |
| 2008 | £227,171 | -14% |
105 Properties |
| 2007 | £258,819 | 1% |
107 Properties |
| 2006 | £256,615 | 30% |
139 Properties |
| 2005 | £179,191 | 14% |
119 Properties |
| 2004 | £153,260 | 10% |
112 Properties |
| 2003 | £137,473 | 8% |
144 Properties |
| 2002 | £125,805 | -52% |
145 Properties |
| 2001 | £191,224 | - |
11 Properties |