
Houses for sale & to rent in Blairgowrie, Perth and Kinross
House Prices in Blairgowrie
Properties in Blairgowrie have an average house price of £197k and had 455 Property Transactions within the last 3 years.¹
Blairgowrie is an area in Perth and Kinross with 8,509 households², where the most expensive property was sold for £1.57M.
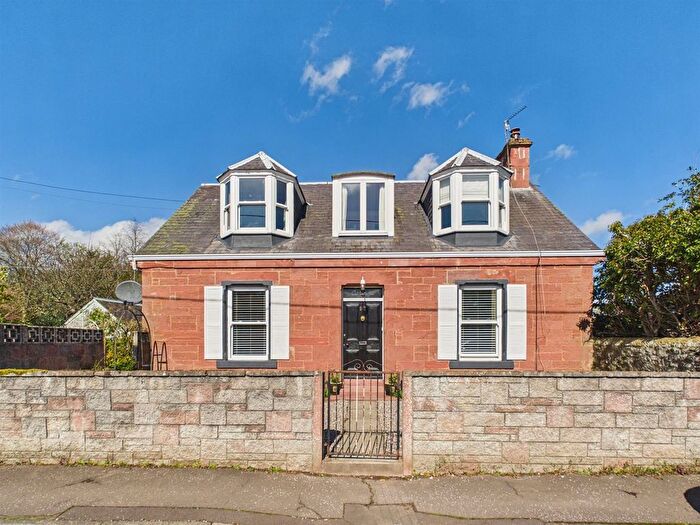
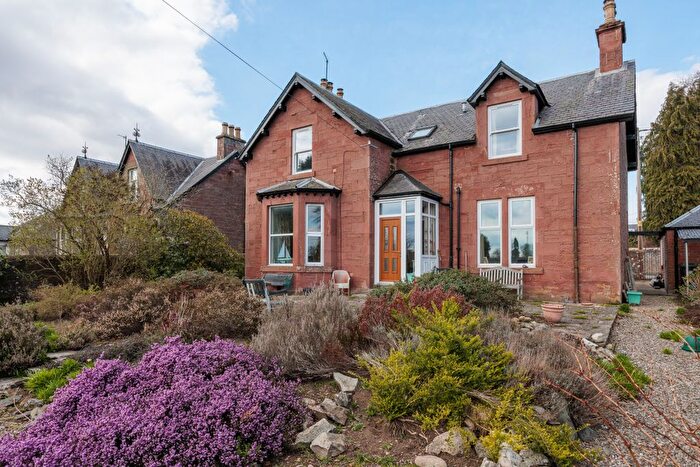
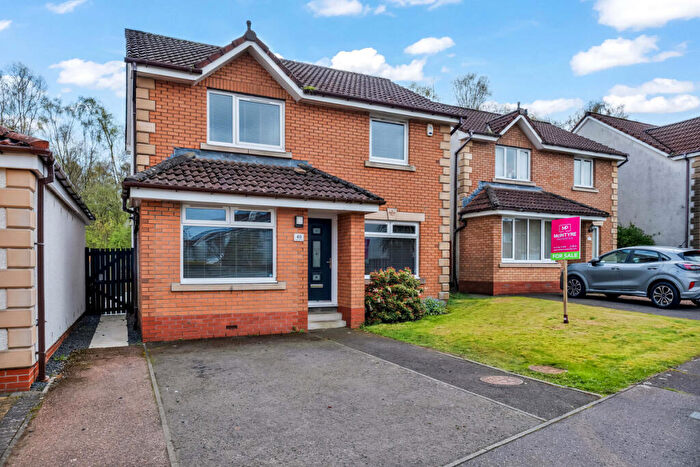
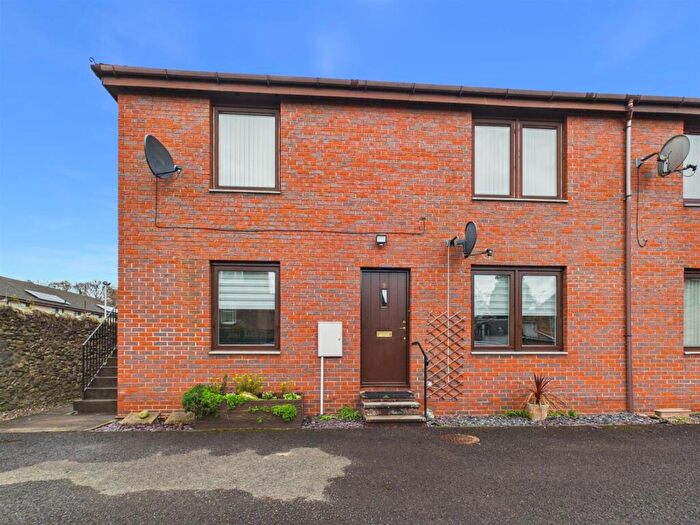
Properties for sale in Blairgowrie
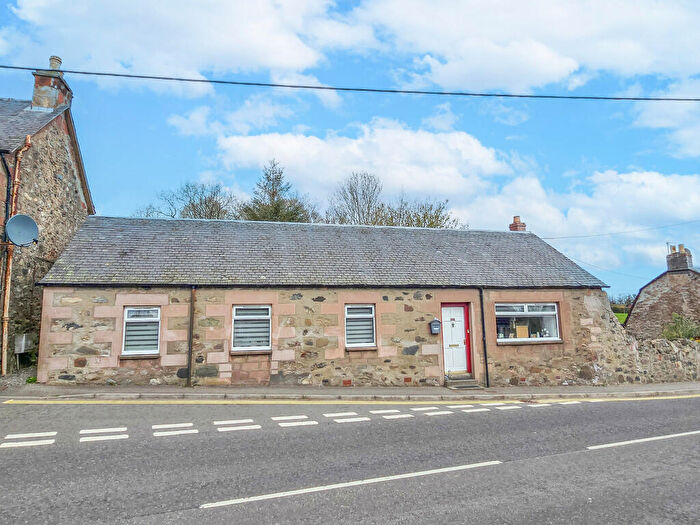

![]()
If you are looking to sell your house, let it out, or receive a property valuation, an expert can help you.
Click the button below to get started.


Neighbourhoods in Blairgowrie
Navigate through our locations to find the location of your next house in Blairgowrie, Perth and Kinross for sale or to rent.
Transport in Blairgowrie
Please see below transportation links in this area:

- FAQ
- Price Paid By Year
Frequently asked questions about Blairgowrie
What is the average price for a property for sale in Blairgowrie?
The average price for a property for sale in Blairgowrie is £196,787. This amount is 11% lower than the average price in Perth and Kinross. There are 9,510 property listings for sale in Blairgowrie.
What locations have the most expensive properties for sale in Blairgowrie?
The location with the most expensive properties for sale in Blairgowrie is Blairgowrie and Glens at an average of £202,576.
What locations have the most affordable properties for sale in Blairgowrie?
The location with the most affordable properties for sale in Blairgowrie is Strathmore at an average of £182,959.
Which train stations are available in or near Blairgowrie?
Some of the train stations available in or near Blairgowrie are Dunkeld and Birnam, Invergowrie and Perth.
Property Price Paid in Blairgowrie by Year
The average sold property price by year was:
| Year | Average Sold Price | Price Change |
Sold Properties
|
|---|---|---|---|
| 2025 | £195,819 | 3% |
157 Properties |
| 2024 | £189,892 | -7% |
127 Properties |
| 2023 | £202,797 | -8% |
171 Properties |
| 2022 | £219,907 | 9% |
444 Properties |
| 2021 | £200,824 | -3% |
462 Properties |
| 2020 | £206,113 | 7% |
346 Properties |
| 2019 | £190,881 | 6% |
375 Properties |
| 2018 | £179,925 | 6% |
416 Properties |
| 2017 | £168,327 | 1% |
400 Properties |
| 2016 | £166,714 | -1% |
356 Properties |
| 2015 | £169,148 | 3% |
395 Properties |
| 2014 | £164,759 | -4% |
320 Properties |
| 2013 | £171,332 | 4% |
284 Properties |
| 2012 | £164,219 | 3% |
237 Properties |
| 2011 | £159,553 | -39% |
195 Properties |
| 2010 | £222,395 | 32% |
254 Properties |
| 2009 | £152,032 | -3% |
264 Properties |
| 2008 | £157,016 | 1% |
319 Properties |
| 2007 | £155,776 | 11% |
451 Properties |
| 2006 | £139,276 | 13% |
508 Properties |
| 2005 | £121,730 | 22% |
470 Properties |
| 2004 | £95,315 | 9% |
470 Properties |
| 2003 | £86,957 | 4% |
477 Properties |
| 2002 | £83,512 | 25% |
501 Properties |
| 2001 | £62,423 | - |
31 Properties |