
Houses for sale & to rent in PA2 9HU, St. Abbs Drive, Paisley Southwest, Paisley
House Prices in PA2 9HU, St. Abbs Drive, Paisley Southwest
Properties in PA2 9HU have no sales history available within the last 3 years. PA2 9HU is a postcode in St. Abbs Drive located in Paisley Southwest, an area in Paisley, Renfrewshire, with 7 households².
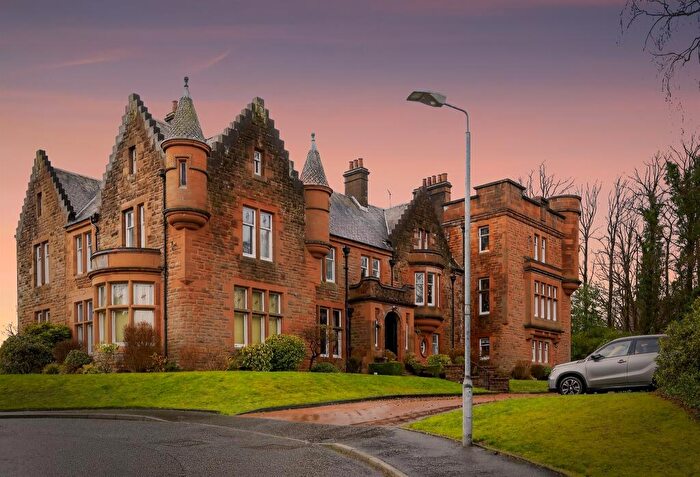
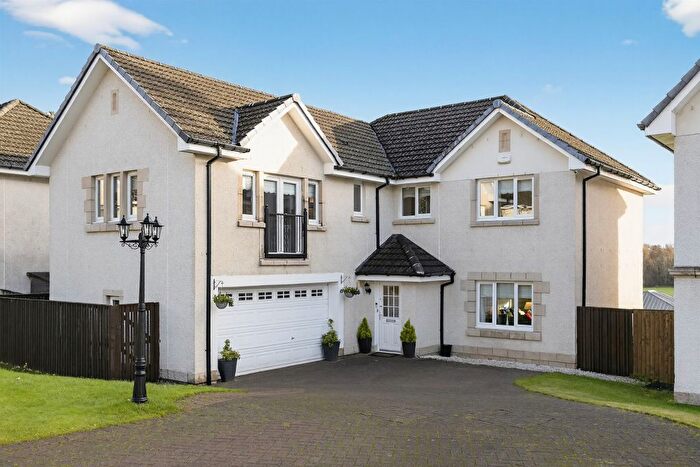
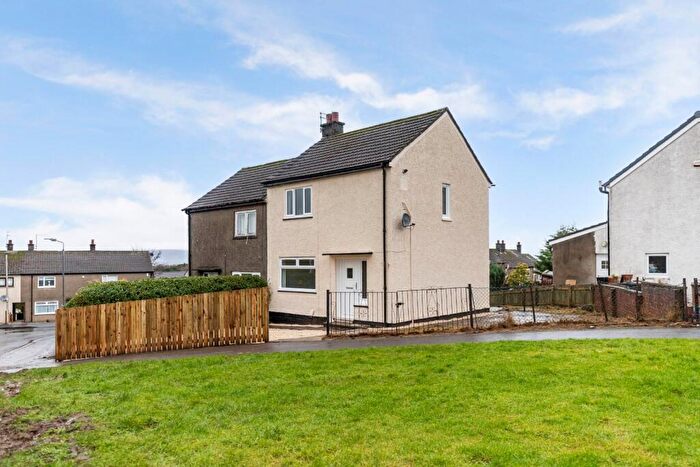
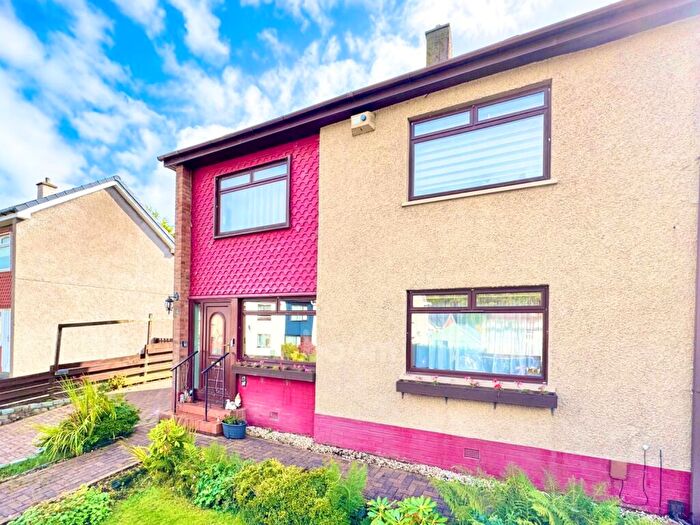
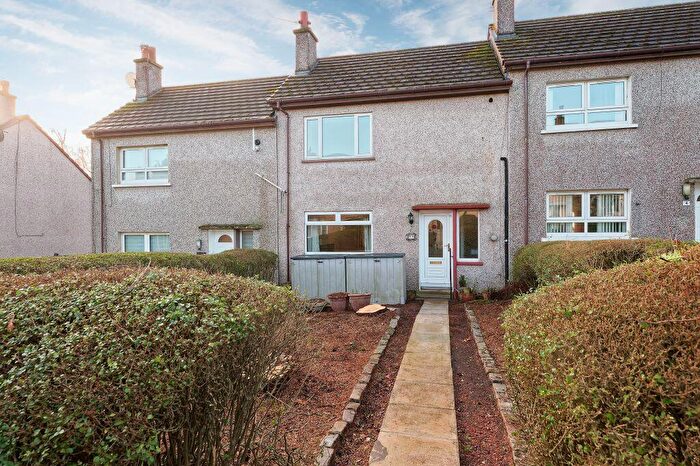
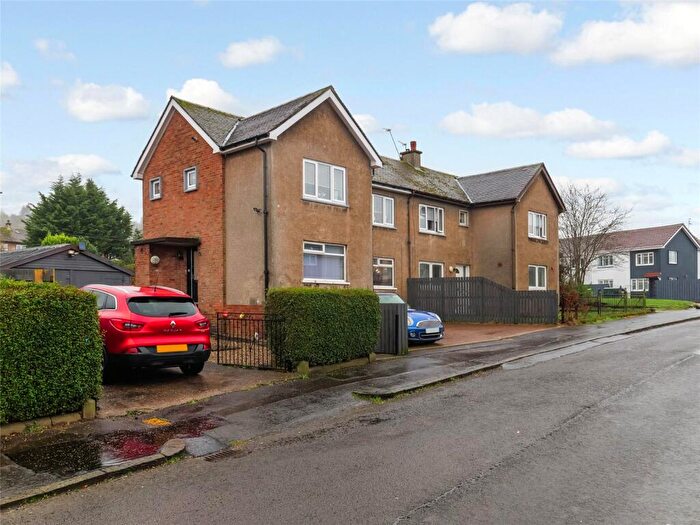
Properties for sale near PA2 9HU, St. Abbs Drive
![]()
If you are looking to sell your house, let it out, or receive a property valuation, an expert can help you.
Click the button below to get started.


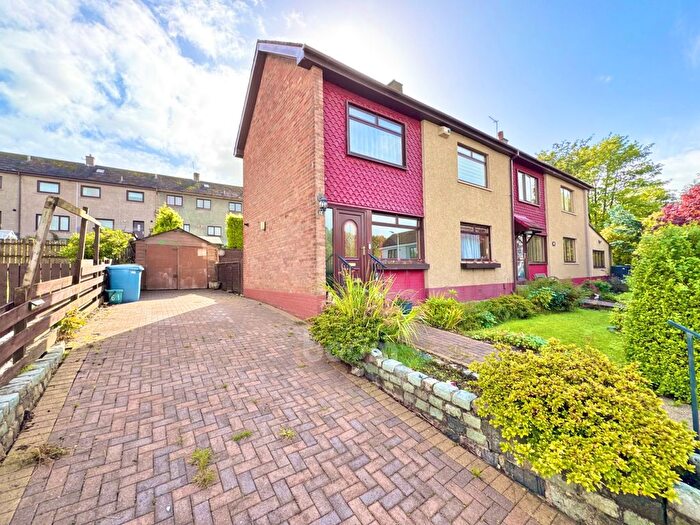
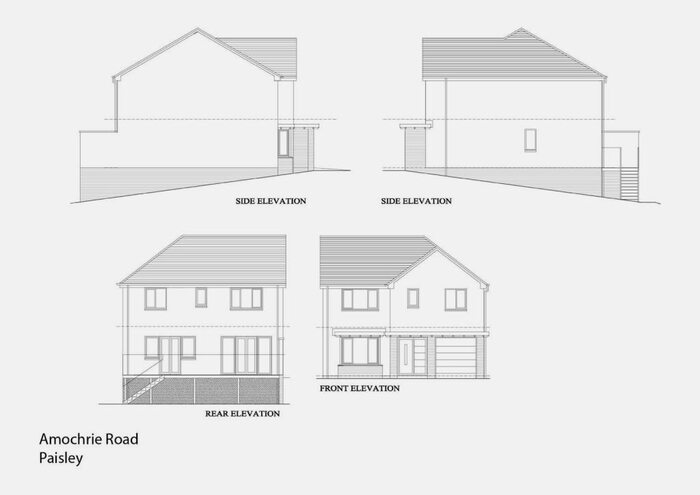
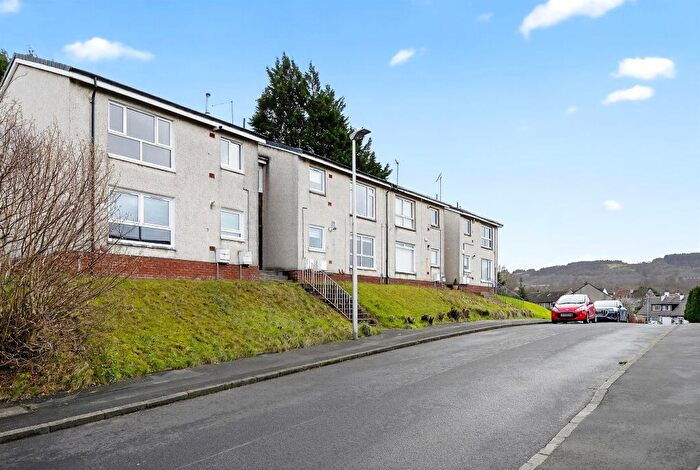
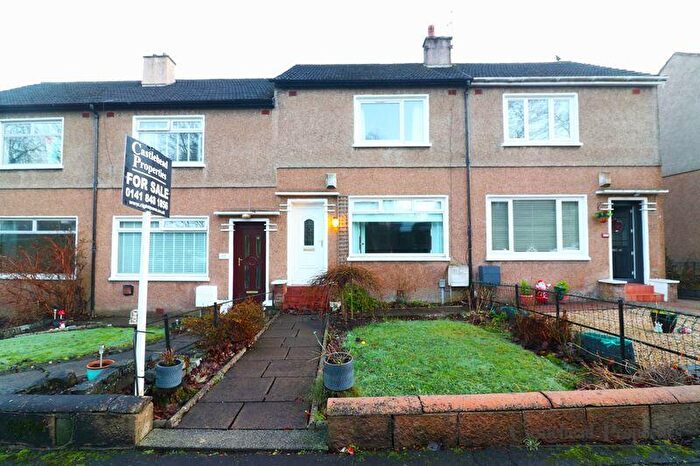
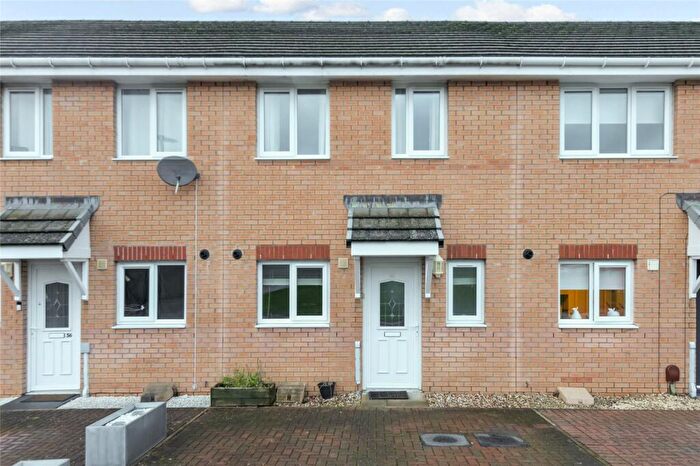
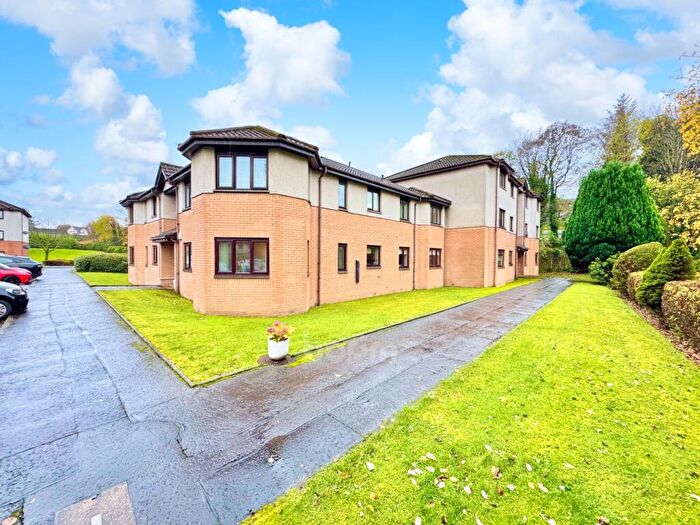
Previously listed properties near PA2 9HU, St. Abbs Drive
![]()
If you are looking to sell your house, let it out, or receive a property valuation, an expert can help you.
Click the button below to get started.


Price Paid in St. Abbs Drive, PA2 9HU, Paisley Southwest
6 St. Abbs Drive, PA2 9HU, Paisley Southwest Paisley
Property 6 has been sold 2 times. The last time it was sold was in 02/02/2021 and the sold price was £286,000.00.
This is a Property which was sold as an Established Building in 02/02/2021
| Date | Price | Classification |
|---|---|---|
| 02/02/2021 | £286,000.00 | Established Building |
| 16/12/2015 | £170,000.00 | Established Building |
4 St. Abbs Drive, PA2 9HU, Paisley Southwest Paisley
Property 4 has been sold 2 times. The last time it was sold was in 10/06/2020 and the sold price was £230,250.00.
This is a Property which was sold as an Established Building in 10/06/2020
| Date | Price | Classification |
|---|---|---|
| 10/06/2020 | £230,250.00 | Established Building |
| 16/01/2008 | £173,000.00 | Established Building |
5 St. Abbs Drive, PA2 9HU, Paisley Southwest Paisley
Property 5 has been sold 1 time. The last time it was sold was in 17/10/2002 and the sold price was £77,500.00.
This is a Property which was sold as an Established Building in 17/10/2002
| Date | Price | Classification |
|---|---|---|
| 17/10/2002 | £77,500.00 | Established Building |
Transport near PA2 9HU, St. Abbs Drive
-
 Paisley Canal Station
 -
Paisley St.James Station
-
Paisley Gilmour Street Station
-
Johnstone Station
-
Hawkhead Station
-
Barrhead Station
-
Milliken Park Station
House price paid reports for PA2 9HU, St. Abbs Drive
Click on the buttons below to see price paid reports by year or property price:
- Price Paid By Year
Property Price Paid in PA2 9HU, St. Abbs Drive by Year
The average sold property price by year was:
| Year | Average Sold Price | Price Change |
Sold Properties
|
|---|---|---|---|
| 2021 | £286,000 | 19% |
1 Property |
| 2020 | £230,250 | 26% |
1 Property |
| 2015 | £170,000 | -2% |
1 Property |
| 2008 | £173,000 | 55% |
1 Property |
| 2002 | £77,500 | - |
1 Property |