
Houses for sale & to rent in Paisley, Renfrewshire
House Prices in Paisley
Properties in Paisley have an average house price of £153k and had 2,059 Property Transactions within the last 3 years.¹
Paisley is an area in Renfrewshire with 41,749 households², where the most expensive property was sold for £1.03M.
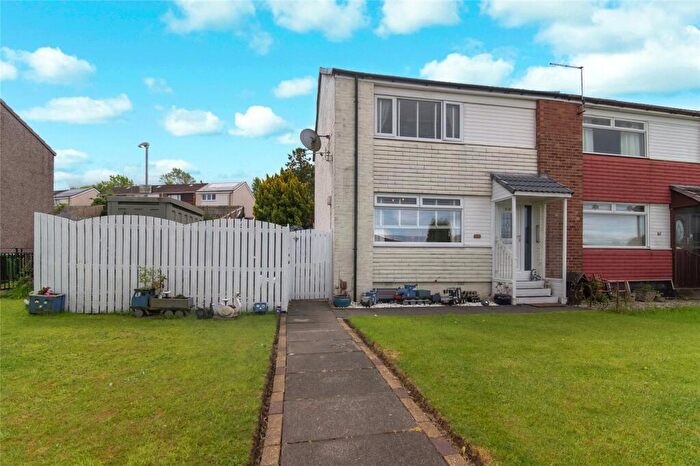
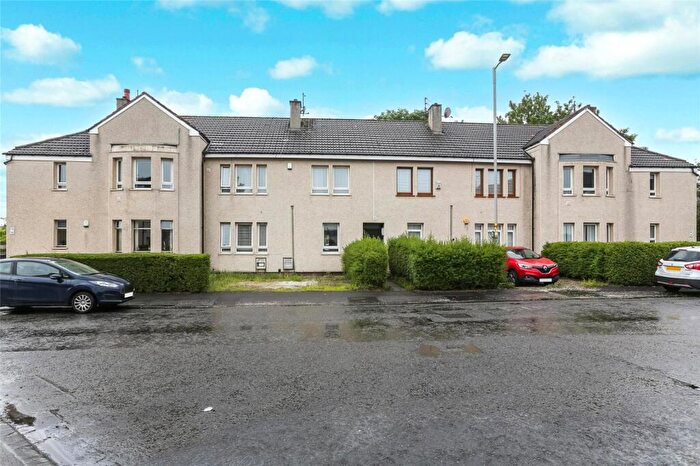
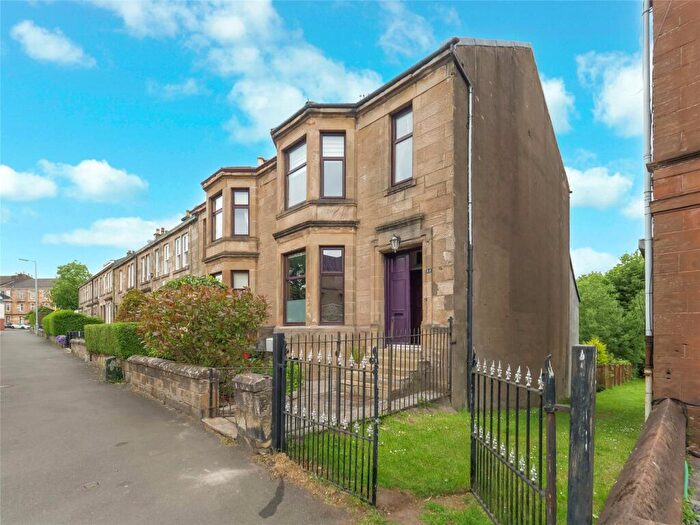
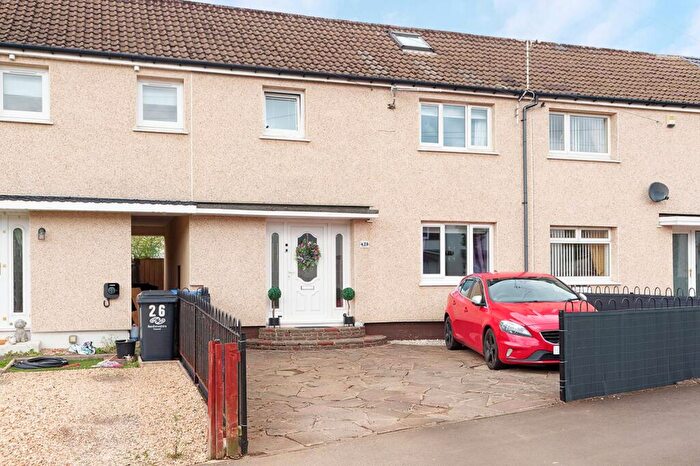
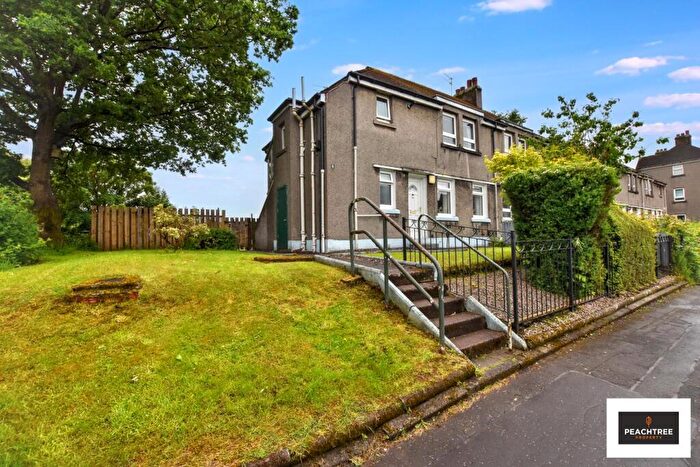
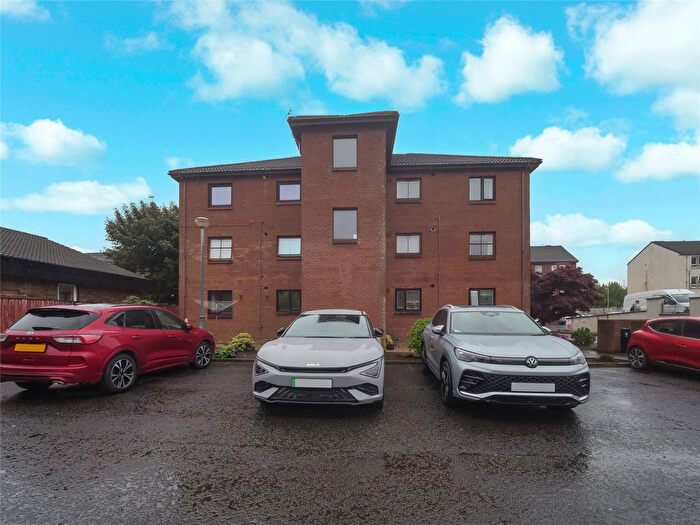
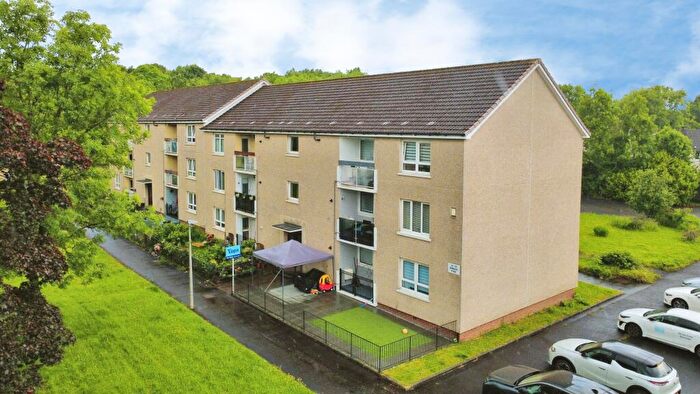
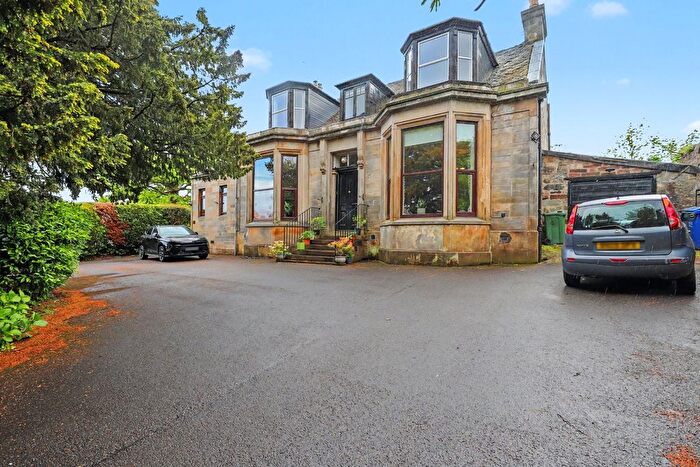
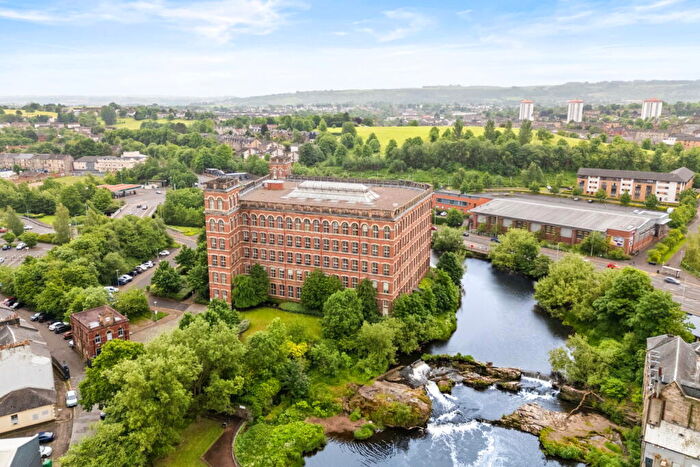
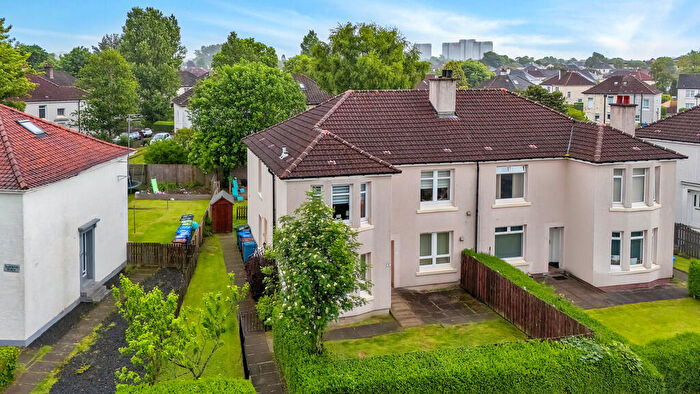
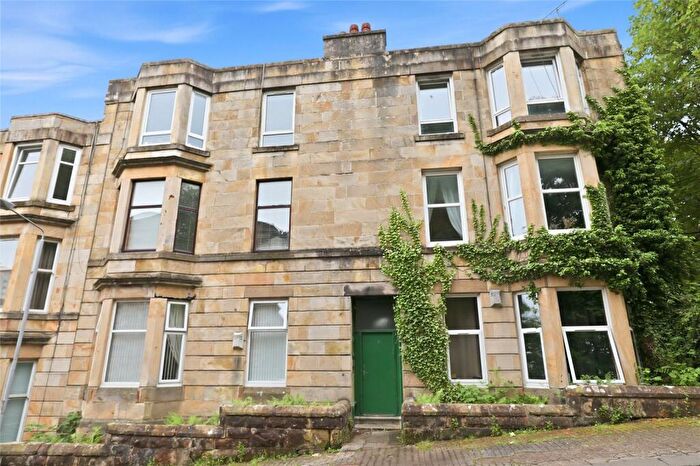
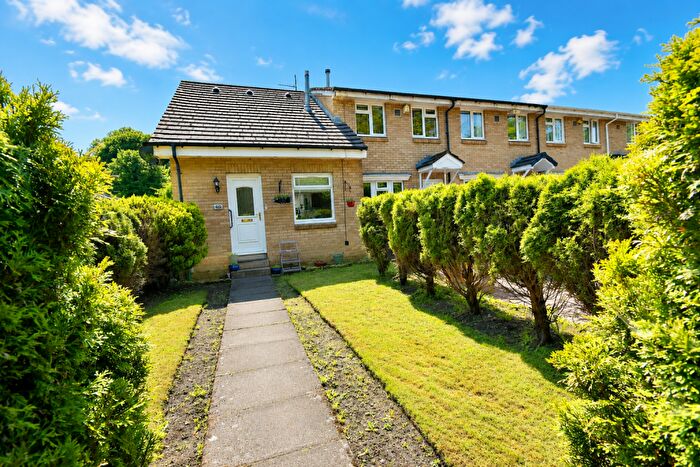
Properties for sale in Paisley
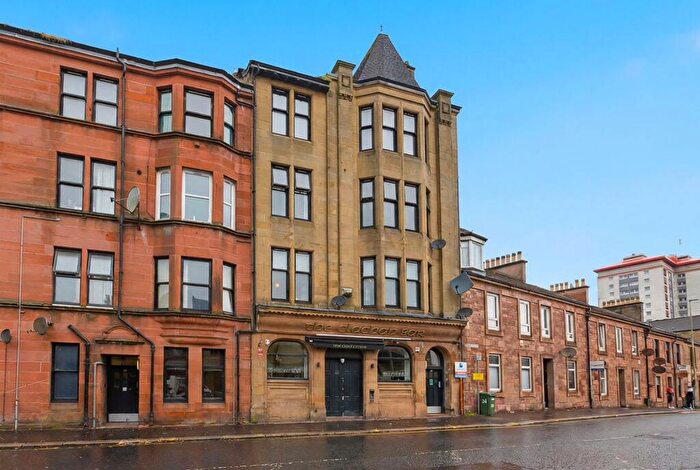
![]()
If you are looking to sell your house, let it out, or receive a property valuation, an expert can help you.
Click the button below to get started.


Neighbourhoods in Paisley
Navigate through our locations to find the location of your next house in Paisley, Renfrewshire for sale or to rent.
Transport in Paisley
Please see below transportation links in this area:
-
 Paisley Canal Station
 -
Paisley Gilmour Street Station
-
Paisley St.James Station
-
Hawkhead Station
-
Hillington West Station
-
Crookston Glasgow Station
-
Johnstone Station
-
Barrhead Station
- FAQ
- Price Paid By Year
Frequently asked questions about Paisley
What is the average price for a property for sale in Paisley?
The average price for a property for sale in Paisley is £152,527. This amount is 14% lower than the average price in Renfrewshire. There are more than 10,000 property listings for sale in Paisley.
What locations have the most expensive properties for sale in Paisley?
The locations with the most expensive properties for sale in Paisley are Paisley Northeast and Ralston at an average of £225,271, Johnstone South and Elderslie at an average of £211,619 and Paisley Southeast at an average of £162,047.
What locations have the most affordable properties for sale in Paisley?
The locations with the most affordable properties for sale in Paisley are Houston, Crosslee and Linwood at an average of £109,395, Renfrew South and Gallowhill at an average of £119,566 and Paisley Northwest at an average of £128,365.
Which train stations are available in or near Paisley?
Some of the train stations available in or near Paisley are Paisley Canal, Paisley Gilmour Street and Paisley St.James.
Property Price Paid in Paisley by Year
The average sold property price by year was:
| Year | Average Sold Price | Price Change |
Sold Properties
|
|---|---|---|---|
| 2025 | £164,379 | 3% |
634 Properties |
| 2024 | £160,058 | 14% |
622 Properties |
| 2023 | £137,336 | 5% |
803 Properties |
| 2022 | £131,048 | 4% |
1,749 Properties |
| 2021 | £125,236 | 3% |
2,013 Properties |
| 2020 | £122,041 | 4% |
1,416 Properties |
| 2019 | £116,929 | 4% |
1,743 Properties |
| 2018 | £111,963 | 2% |
1,611 Properties |
| 2017 | £110,112 | -1% |
1,710 Properties |
| 2016 | £111,756 | -2% |
1,738 Properties |
| 2015 | £114,255 | 7% |
1,556 Properties |
| 2014 | £106,285 | 6% |
1,455 Properties |
| 2013 | £99,498 | 2% |
1,253 Properties |
| 2012 | £97,124 | -10% |
1,093 Properties |
| 2011 | £106,545 | 2% |
981 Properties |
| 2010 | £104,417 | 3% |
1,039 Properties |
| 2009 | £101,548 | -20% |
1,142 Properties |
| 2008 | £122,123 | 1% |
1,847 Properties |
| 2007 | £120,428 | -3% |
2,474 Properties |
| 2006 | £123,765 | 26% |
2,741 Properties |
| 2005 | £91,898 | 6% |
2,651 Properties |
| 2004 | £86,525 | 16% |
2,463 Properties |
| 2003 | £72,529 | 20% |
2,439 Properties |
| 2002 | £57,896 | 20% |
2,391 Properties |
| 2001 | £46,271 | - |
168 Properties |