
Houses for sale in Jedburgh and District, Jedburgh
House Prices in Jedburgh and District
Properties in Jedburgh and District have an average house price of £161k and had 127 Property Transactions within the last 3 years¹.
Jedburgh and District is an area in Jedburgh, Scottish Borders with 2,809 households², where the most expensive property was sold for £660k.
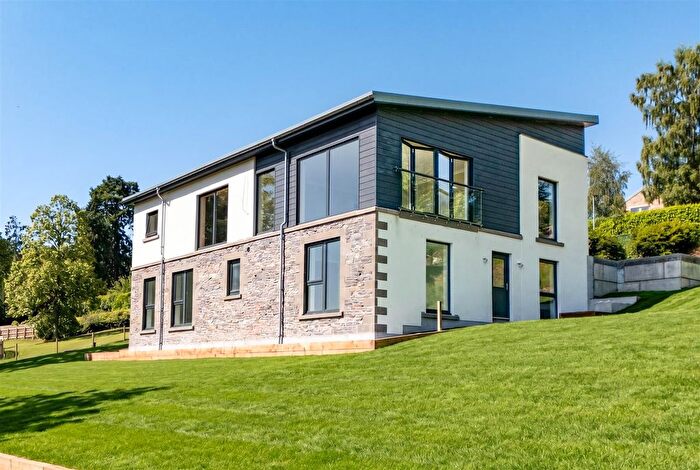
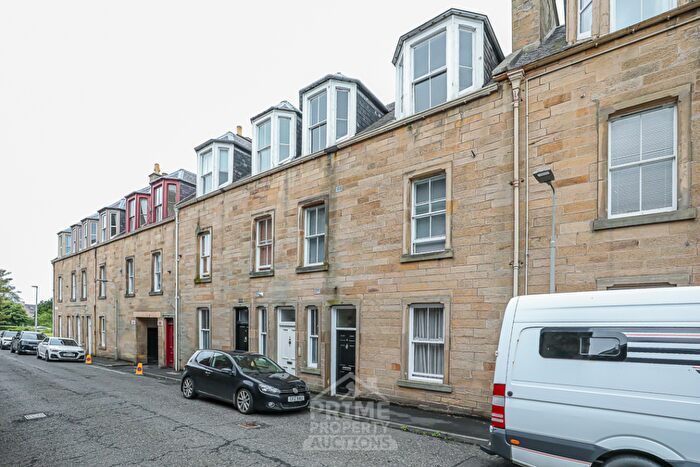
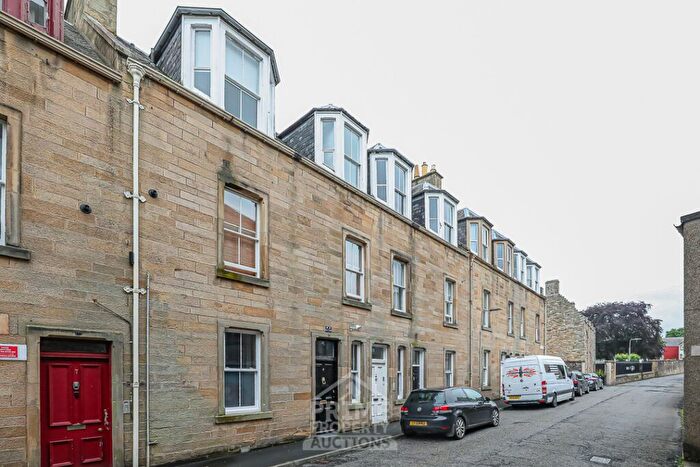
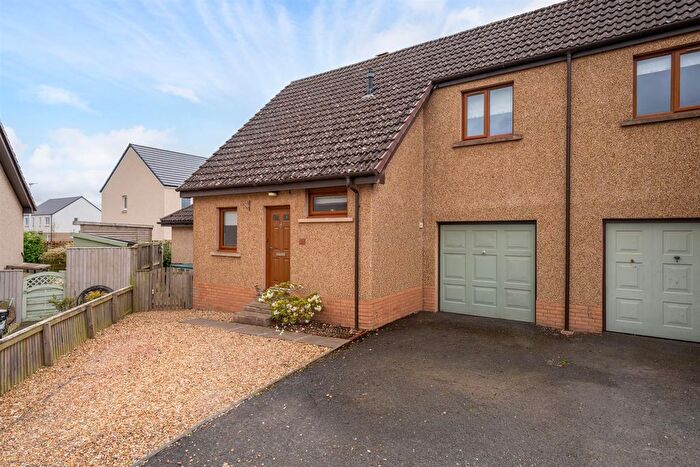
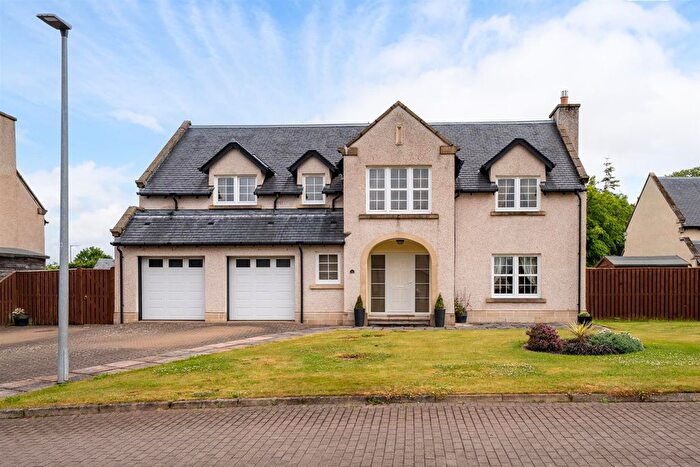
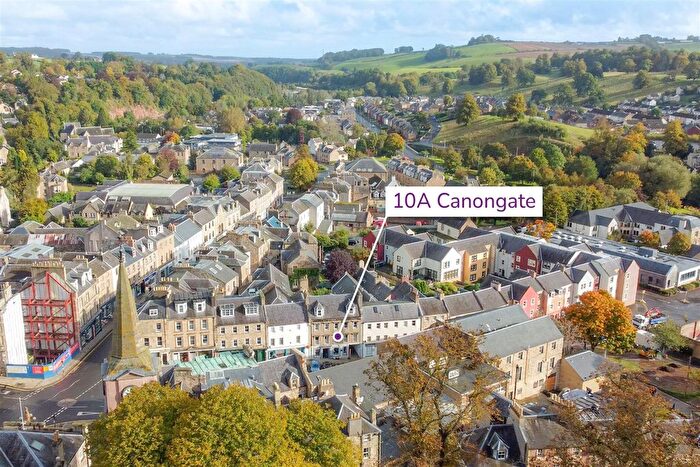
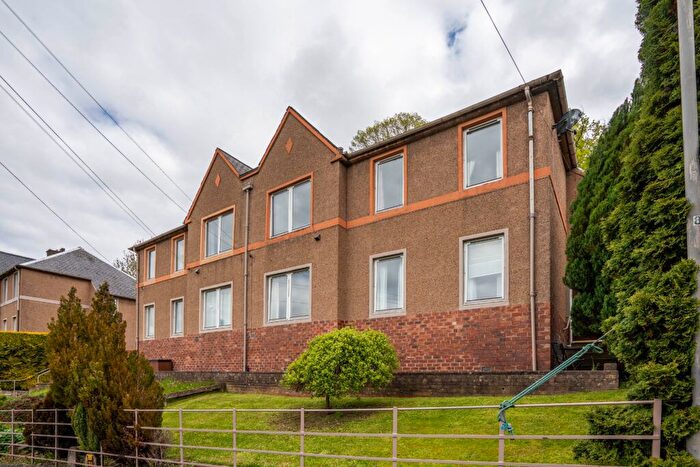
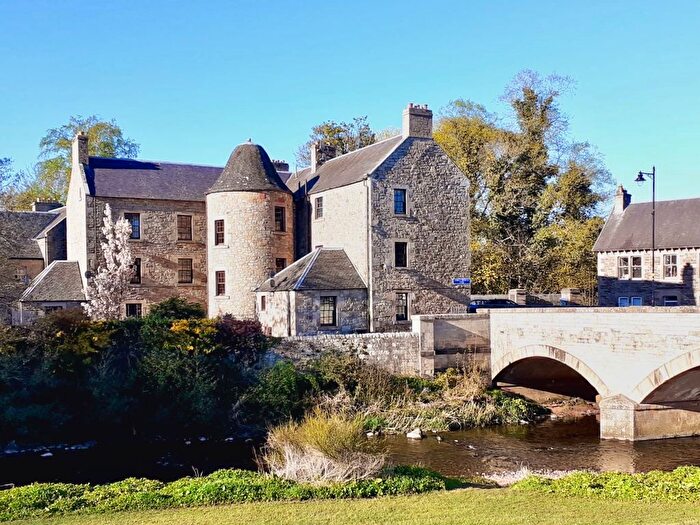
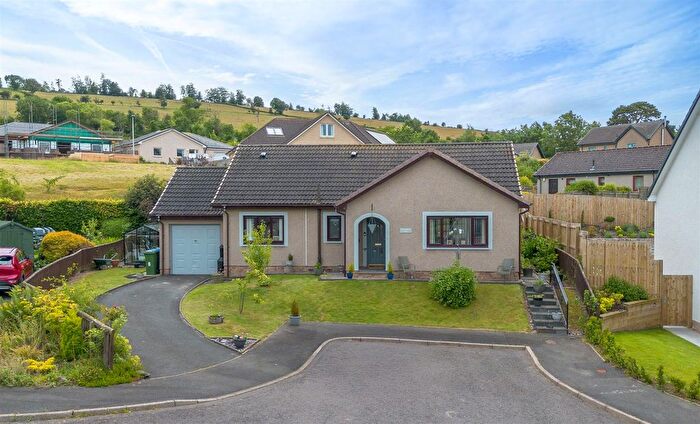
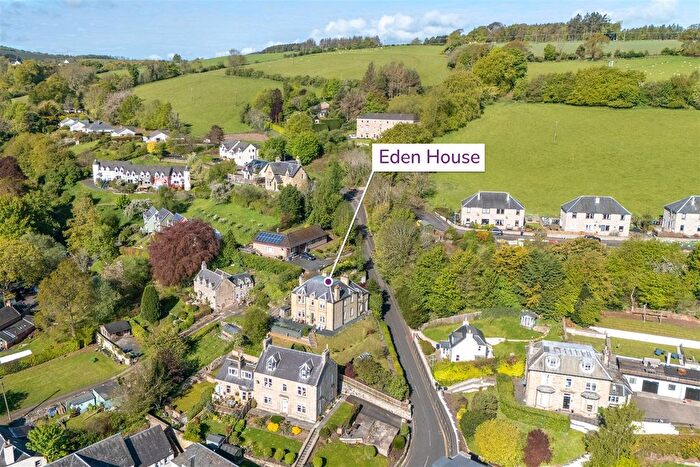
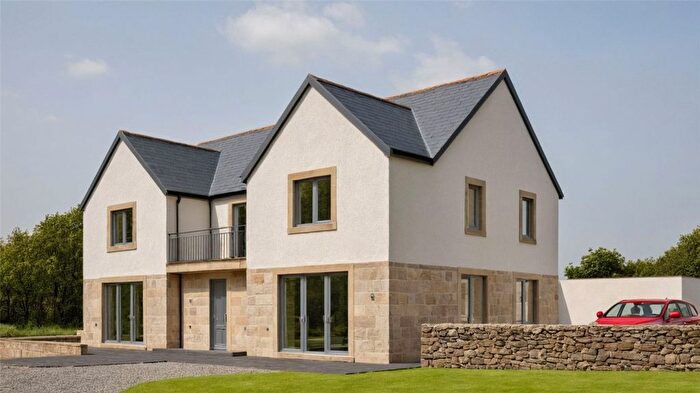
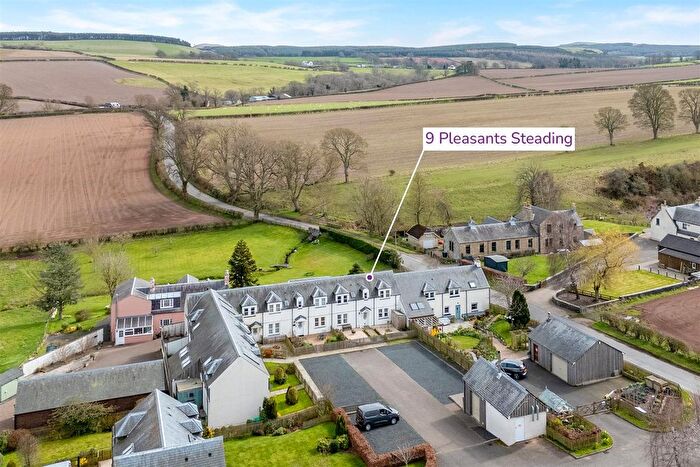
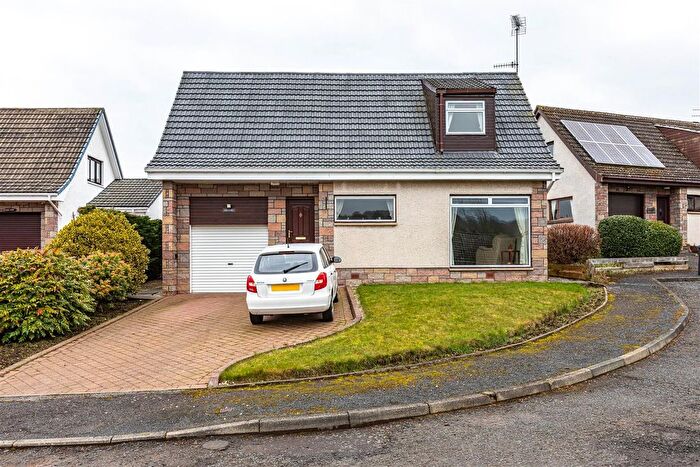
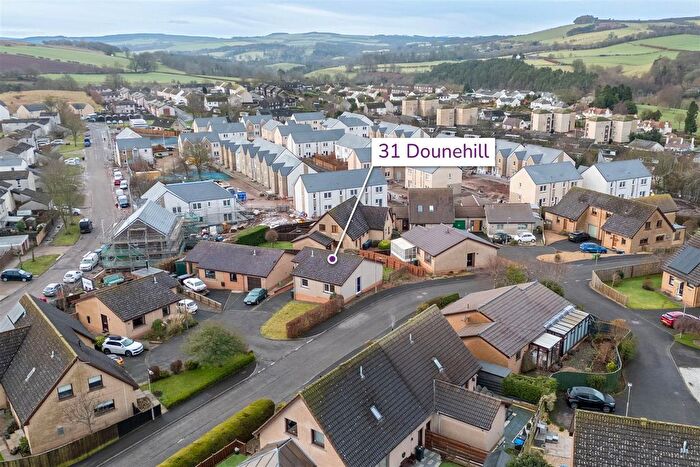
Properties for sale in Jedburgh and District
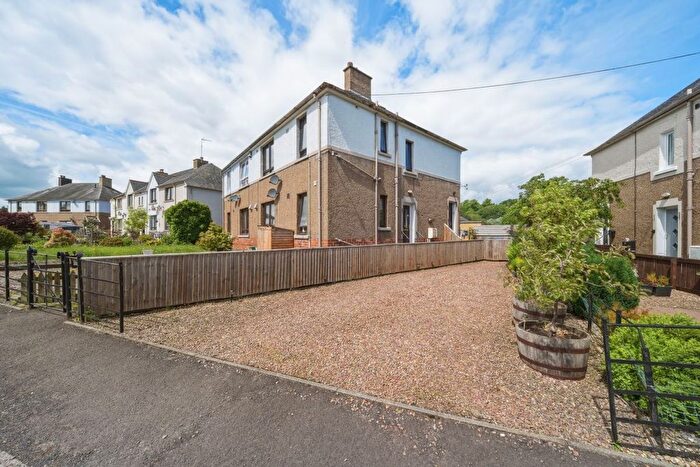
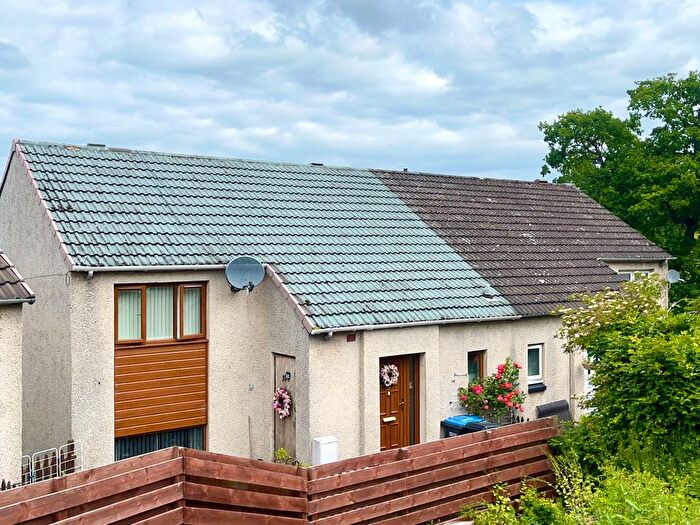
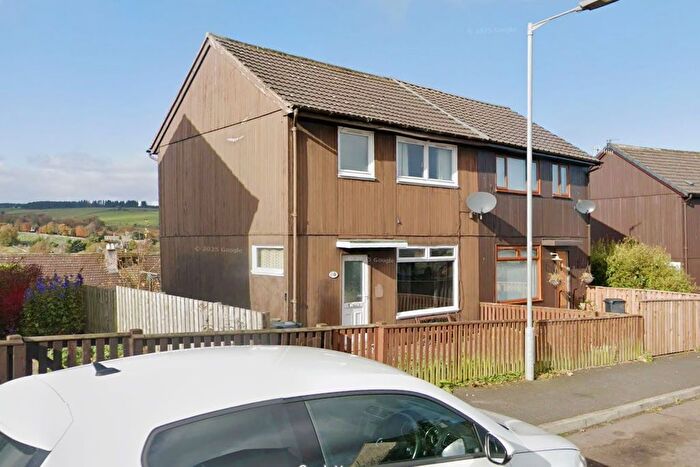
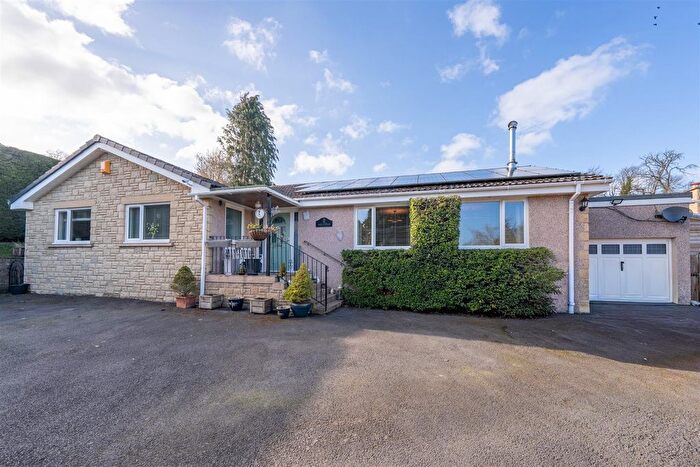
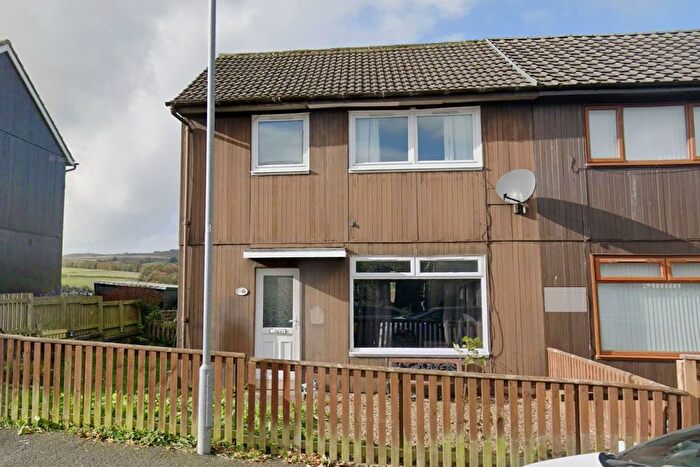
Previously listed properties in Jedburgh and District
![]()
If you are looking to sell your house, let it out, or receive a property valuation, an expert can help you.
Click the button below to get started.
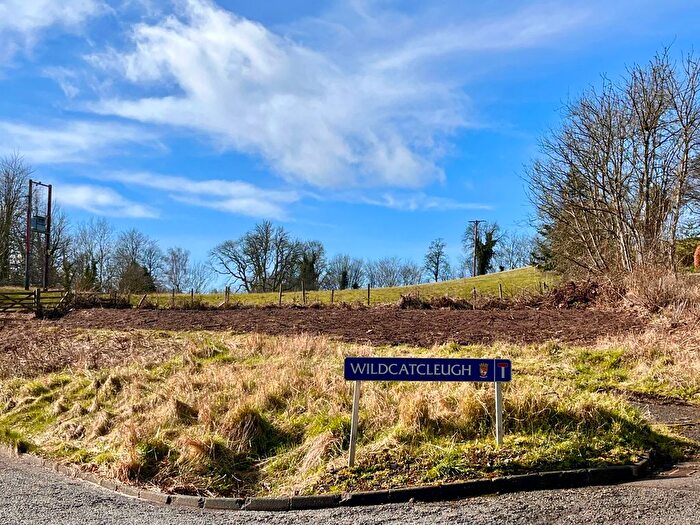


Roads and Postcodes in Jedburgh and District
Navigate through our locations to find the location of your next house in Jedburgh and District, Jedburgh for sale or to rent.
Property price trends in Jedburgh and District
According to the latest Registers of Scotland data, the average home in Jedburgh and District sold for £155,744 in 2025. That figure comes from 2,342 sales logged over the past 24 years.
Prices have fallen back over the last three years. Compared with 2022, when the typical sale came in around £223,504, that's a fall of roughly 30.3%.
Looking back five years, average prices are down about 22.6% since 2020, a drop of around £45,559 in cash terms.
Zoom out to the past decade for the fuller picture. Back in 2015, homes here averaged £154,631, so the typical sold price has climbed about 0.7% since then, roughly 0.1% a year. Stretch the view to fifteen years and that annual pace edges up closer to 0.3%.
Frequently asked questions about Jedburgh and District
What is the average price for a property for sale in Jedburgh and District?
The average price for a property for sale in Jedburgh and District is £161,456. There are 430 property listings for sale in Jedburgh and District.
What streets have the most expensive properties for sale in Jedburgh and District?
The streets with the most expensive properties for sale in Jedburgh and District are Galahill at an average of £660,000, Lanton Road at an average of £332,500 and Burn Wynd at an average of £320,000.
What streets have the most affordable properties for sale in Jedburgh and District?
The streets with the most affordable properties for sale in Jedburgh and District are Abbey Bridge End at an average of £64,625, Abbey Place at an average of £79,575 and Grieve Avenue at an average of £85,666.
Which train stations are available in or near Jedburgh and District?
Some of the train stations available in or near Jedburgh and District are Tweedbank, Galashiels and Stow.
Property Price Paid in Jedburgh and District by Year
The average sold property price by year was:
| Year | Average Sold Price | Price Change |
Sold Properties
|
|---|---|---|---|
| 2025 | £155,744 | -10% |
46 Properties |
| 2024 | £171,935 | 8% |
38 Properties |
| 2023 | £158,306 | -41% |
43 Properties |
| 2022 | £223,504 | 13% |
128 Properties |
| 2021 | £195,519 | -3% |
122 Properties |
| 2020 | £201,303 | 22% |
104 Properties |
| 2019 | £156,789 | -11% |
91 Properties |
| 2018 | £174,665 | 2% |
121 Properties |
| 2017 | £170,611 | -4% |
101 Properties |
| 2016 | £177,129 | 13% |
98 Properties |
