
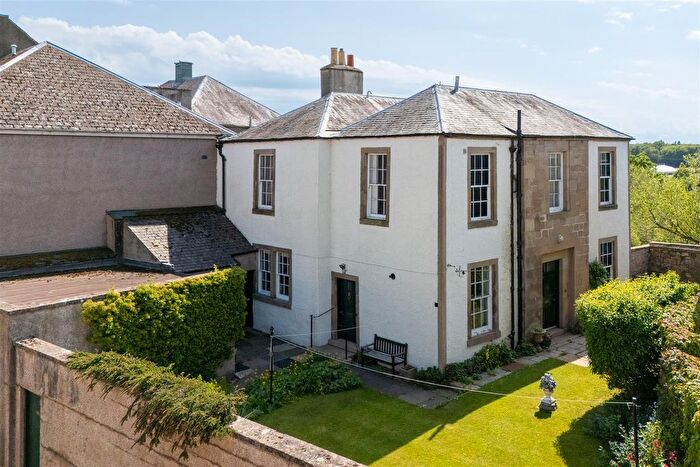
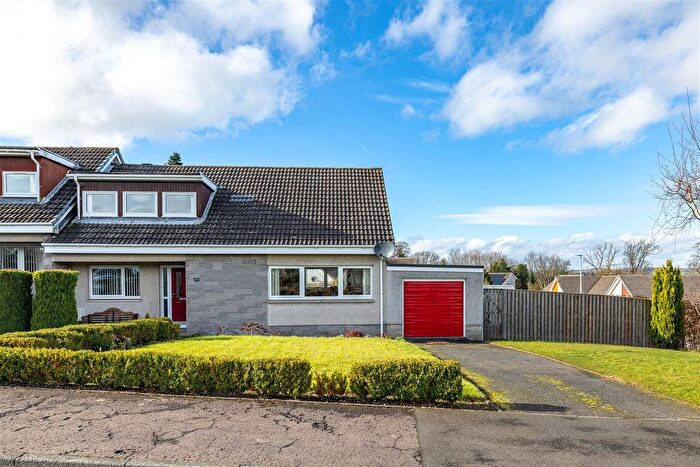
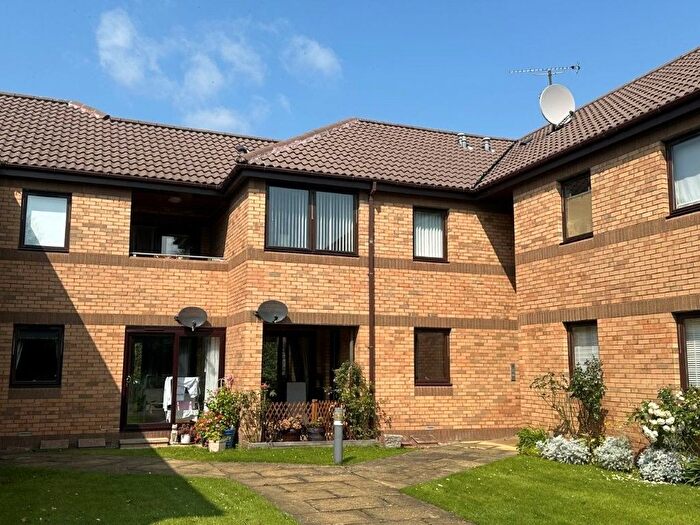
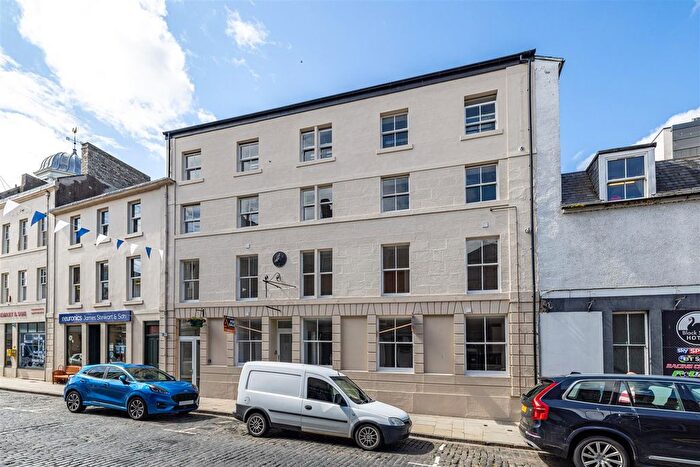
Houses for sale in TD5 8DS, Spylaw Park, Kelso And District, Kelso
House Prices in TD5 8DS, Spylaw Park, Kelso And District
Properties in TD5 8DS have an average house price of £350k and had 1 Property Transaction within the last 3 years.¹ TD5 8DS is a postcode in Spylaw Park located in Kelso And District, an area in Kelso, Scottish Borders, with 15 households², where the most expensive property was sold for £350k.
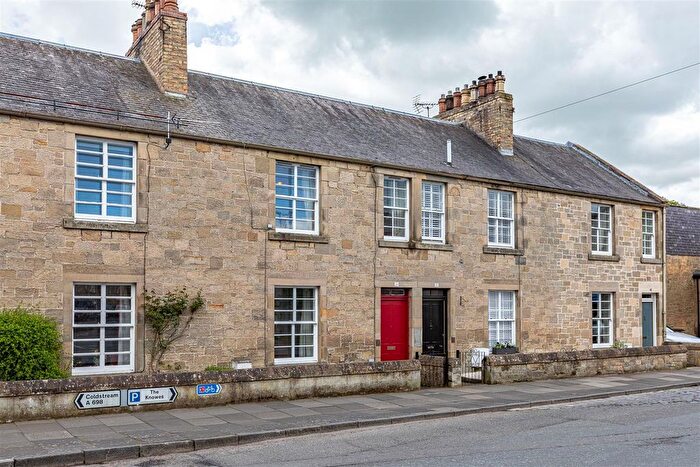
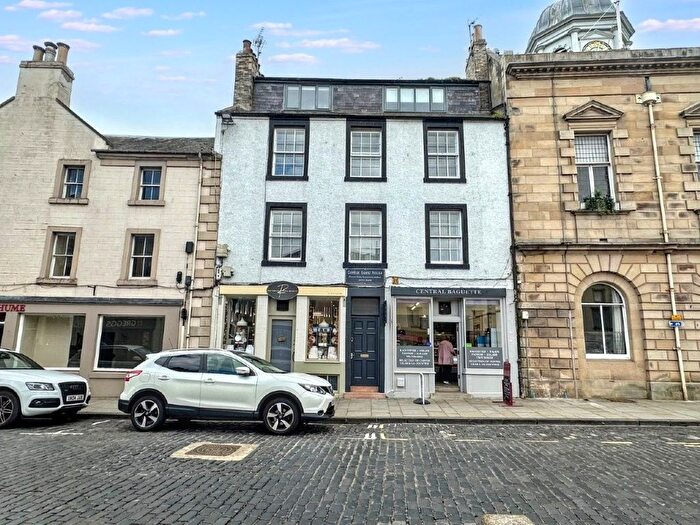
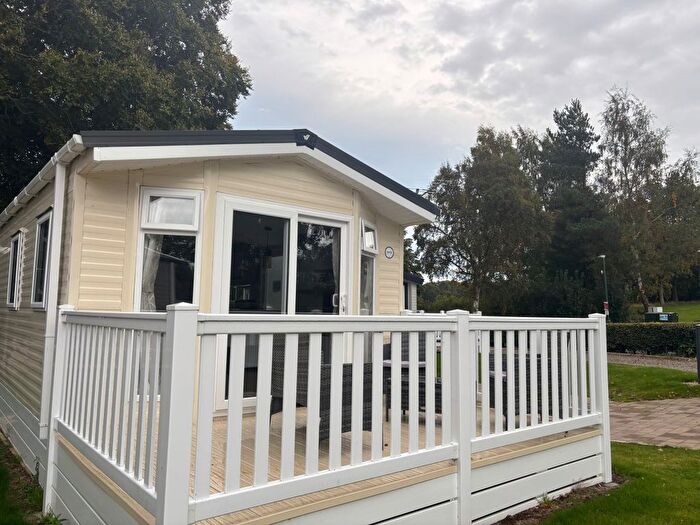
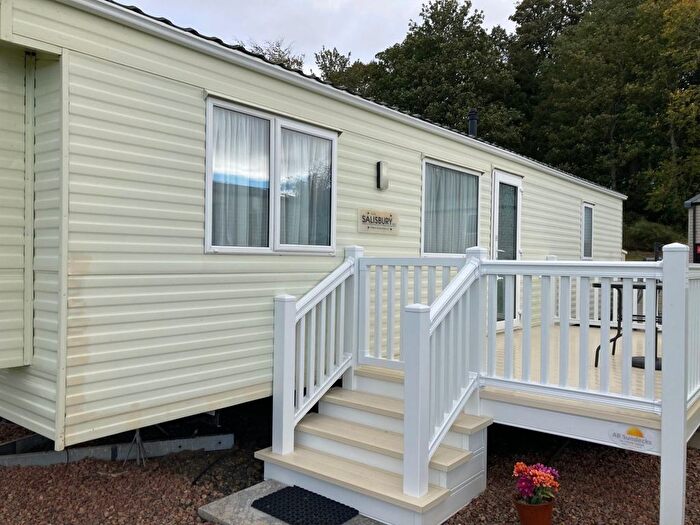
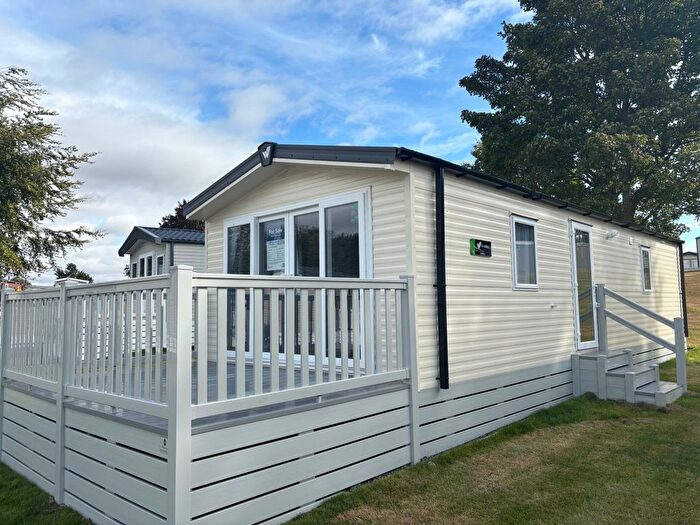
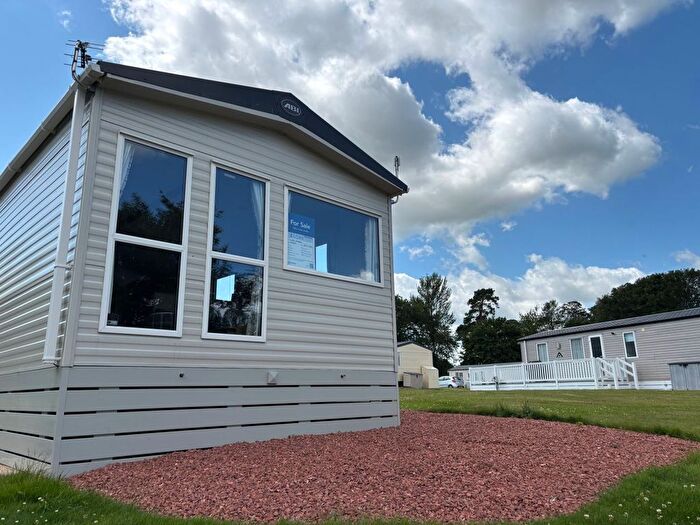
Properties for sale near TD5 8DS, Spylaw Park
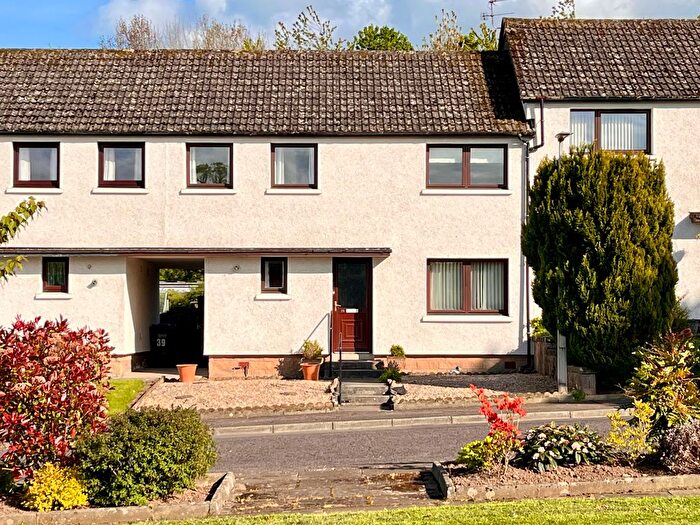
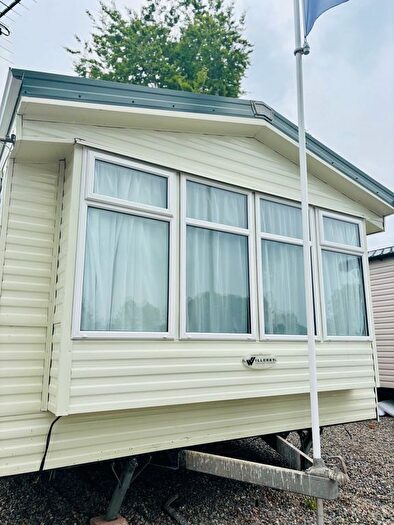
Previously listed properties near TD5 8DS, Spylaw Park

![]()
If you are looking to sell your house, let it out, or receive a property valuation, an expert can help you.
Click the button below to get started.


Price Paid in Spylaw Park, TD5 8DS, Kelso And District
1 Spylaw Park, TD5 8DS, Kelso And District Kelso
Property 1 has been sold 3 times. The last time it was sold was in 21/05/2025 and the sold price was £350,000.00.
This is a Property which was sold as a New Build in 21/05/2025
| Date | Price | Classification |
|---|---|---|
| 21/05/2025 | £350,000.00 | New Build |
| 23/10/2019 | £262,500.00 | Established Building |
| 09/03/2007 | £212,500.00 | New Build |
8 Spylaw Park, TD5 8DS, Kelso And District Kelso
Property 8 has been sold 1 time. The last time it was sold was in 10/11/2022 and the sold price was £425,000.00.
This is a Property which was sold as an Established Building in 10/11/2022
| Date | Price | Classification |
|---|---|---|
| 10/11/2022 | £425,000.00 | Established Building |
6 Spylaw Park, TD5 8DS, Kelso And District Kelso
Property 6 has been sold 1 time. The last time it was sold was in 02/03/2021 and the sold price was £325,500.00.
This is a Property which was sold as an Established Building in 02/03/2021
| Date | Price | Classification |
|---|---|---|
| 02/03/2021 | £325,500.00 | Established Building |
13 Spylaw Park, TD5 8DS, Kelso And District Kelso
Property 13 has been sold 1 time. The last time it was sold was in 19/07/2019 and the sold price was £285,000.00.
This is a Property which was sold as an Established Building in 19/07/2019
| Date | Price | Classification |
|---|---|---|
| 19/07/2019 | £285,000.00 | Established Building |
4 Spylaw Park, TD5 8DS, Kelso And District Kelso
Property 4 has been sold 1 time. The last time it was sold was in 27/10/2017 and the sold price was £264,000.00.
This is a Property which was sold as an Established Building in 27/10/2017
| Date | Price | Classification |
|---|---|---|
| 27/10/2017 | £264,000.00 | Established Building |
11 Spylaw Park, TD5 8DS, Kelso And District Kelso
Property 11 has been sold 4 times. The last time it was sold was in 03/11/2015 and the sold price was £262,500.00.
This is a Property which was sold as an Established Building in 03/11/2015
| Date | Price | Classification |
|---|---|---|
| 03/11/2015 | £262,500.00 | Established Building |
| 20/09/2010 | £265,000.00 | New Build |
| 28/11/2007 | £125,000.00 | Established Building |
| 12/09/2005 | £240,000.00 | Established Building |
3 Spylaw Park, TD5 8DS, Kelso And District Kelso
Property 3 has been sold 3 times. The last time it was sold was in 22/10/2012 and the sold price was £250,000.00.
This is a Property which was sold as an Established Building in 22/10/2012
| Date | Price | Classification |
|---|---|---|
| 22/10/2012 | £250,000.00 | Established Building |
| 27/08/2010 | £270,000.00 | Established Building |
| 30/10/2007 | £249,950.00 | Established Building |
Property price trends in TD5 8DS, Spylaw Park
According to the latest Registers of Scotland data, the average home in TD5 8DS, Spylaw Park sold for £350,000 in 2025. That figure comes from 14 sales logged over the past 20 years.
Prices have fallen back over the last three years. Compared with 2022, when the typical sale came in around £425,000, that's a fall of roughly 17.6%.
Looking back five years, average prices are up about 27.9% since 2019, a gain of around £76,250 in cash terms.
Zoom out to the past decade for the fuller picture. Back in 2015, homes here averaged £262,500, so the typical sold price has climbed about 33.3% since then, roughly 2.9% a year. Stretch the view to fifteen years and that annual pace eases back to about 1.8%.
Property Price Paid in TD5 8DS, Spylaw Park by Year
The average sold property price by year was:
| Year | Average Sold Price | Price Change |
Sold Properties
|
|---|---|---|---|
| 2025 | £350,000 | -21% |
1 Property |
| 2022 | £425,000 | 23% |
1 Property |
| 2021 | £325,500 | 16% |
1 Property |
| 2019 | £273,750 | 4% |
2 Properties |
| 2017 | £264,000 | 1% |
1 Property |
| 2015 | £262,500 | 5% |
1 Property |
| 2012 | £250,000 | -7% |
1 Property |
| 2010 | £267,500 | 27% |
2 Properties |
| 2007 | £195,816 | -23% |
3 Properties |
| 2005 | £240,000 | - |
1 Property |
