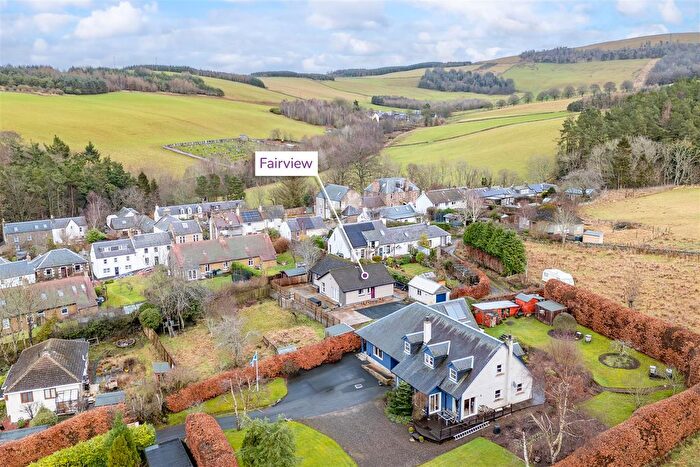
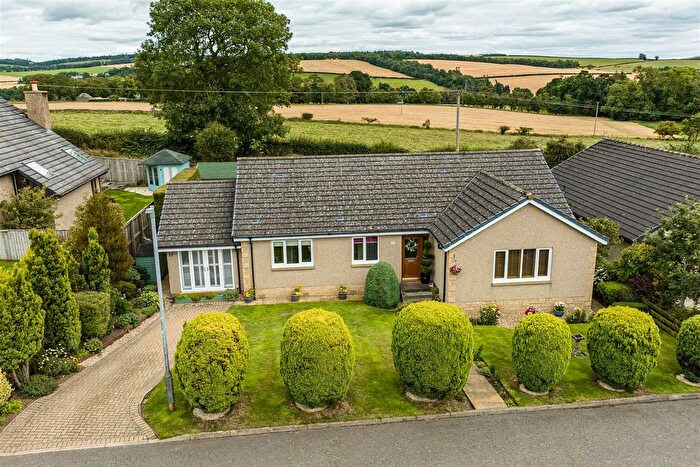
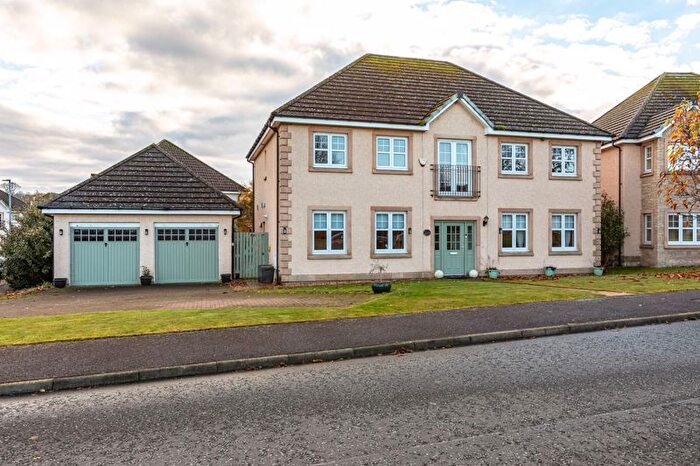
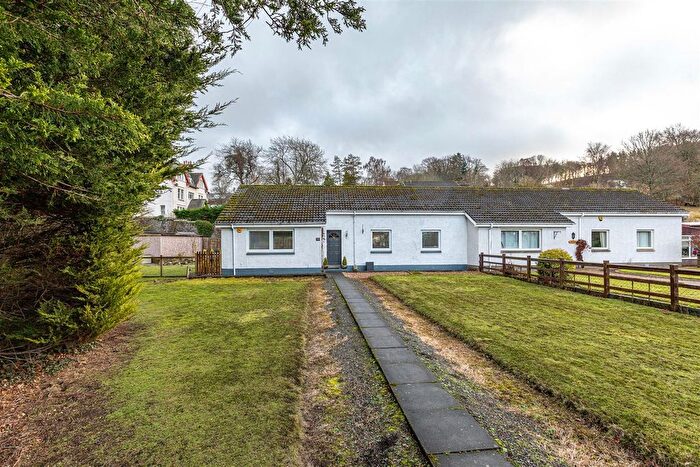
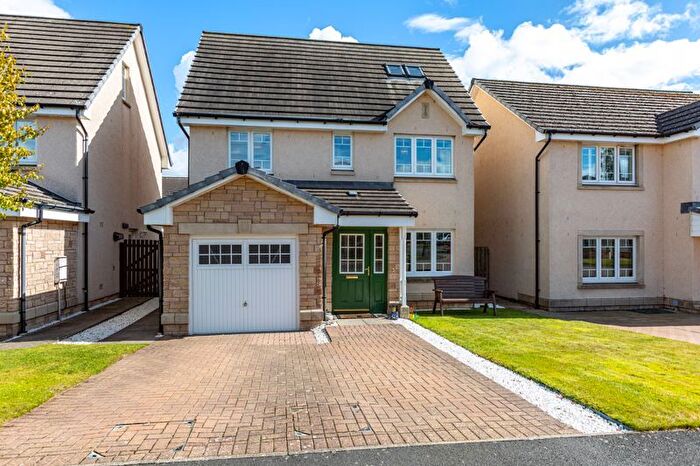
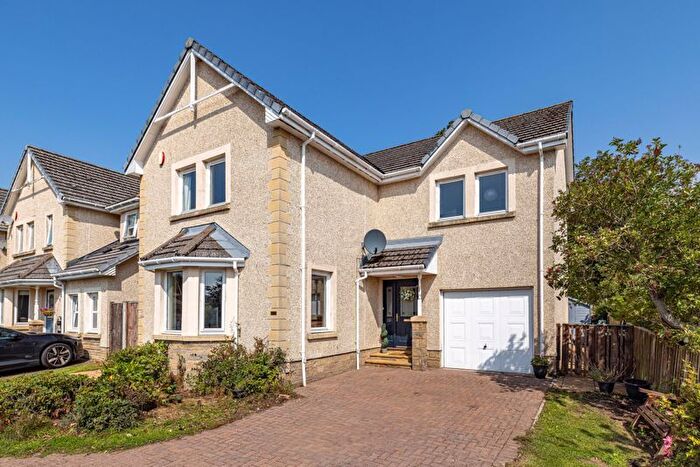
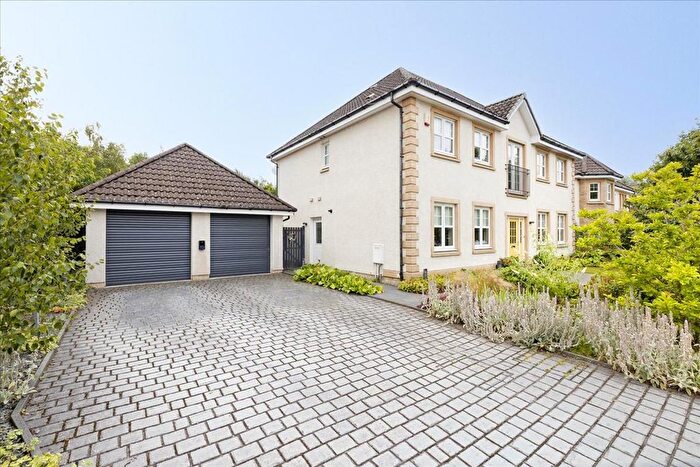
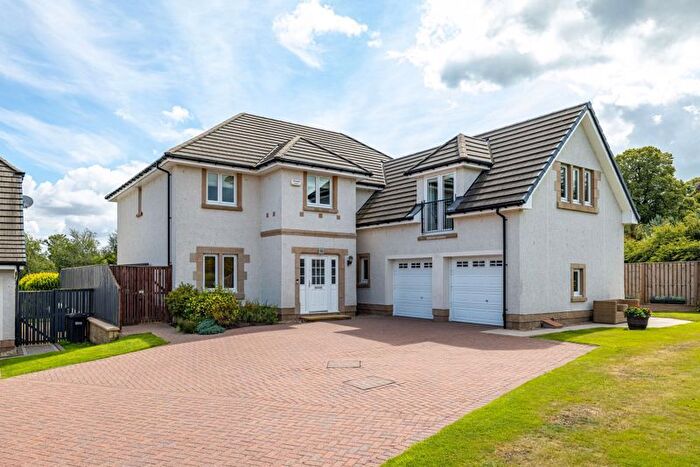
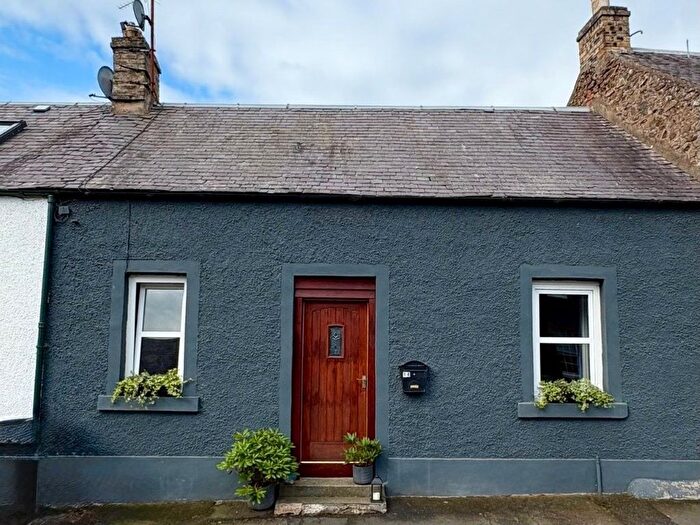
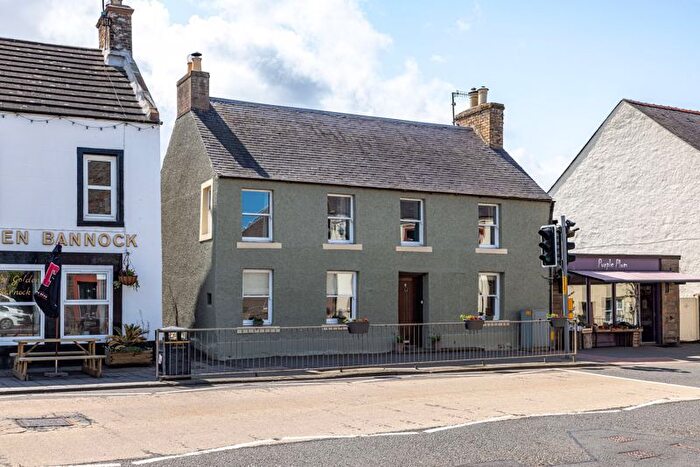
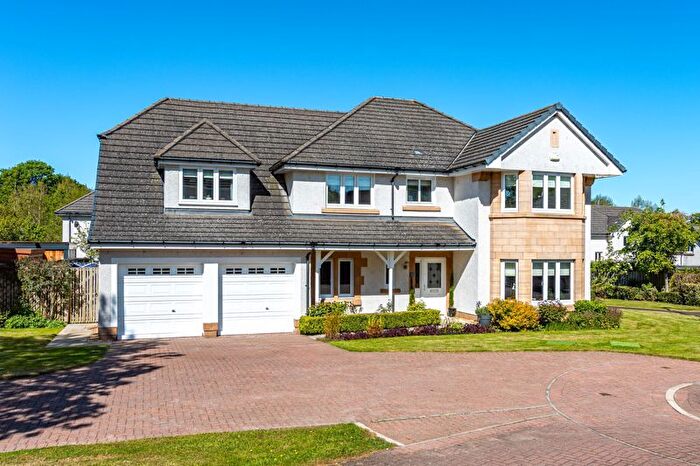
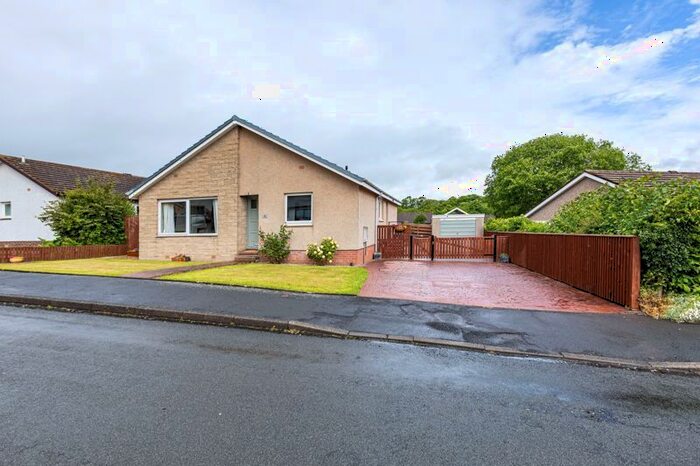
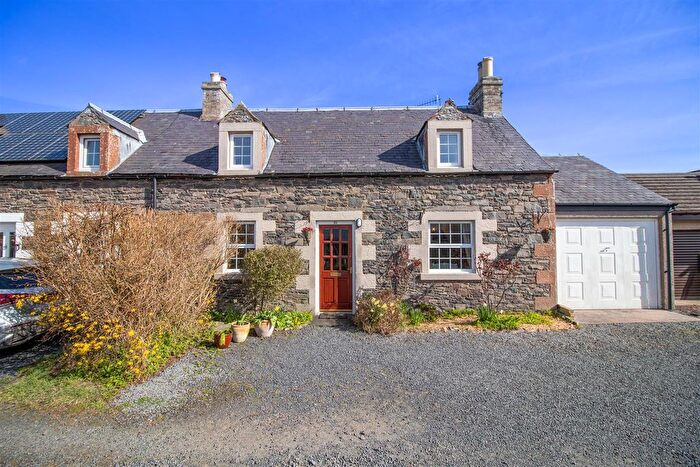
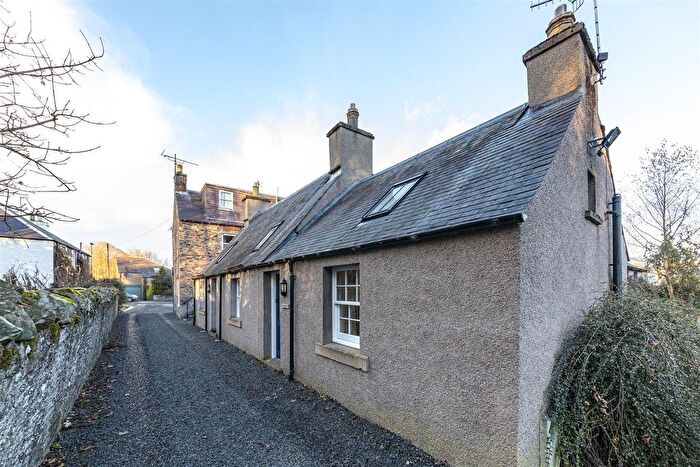
Houses for sale & to rent in Leaderdale and Melrose, Lauder
House Prices in Leaderdale and Melrose
Properties in Leaderdale and Melrose have an average house price of £292,646.00 and had 42 Property Transactions within the last 3 years¹.
Leaderdale and Melrose is an area in Lauder, Scottish Borders with 1,064 households², where the most expensive property was sold for £670,000.00.
Properties for sale in Leaderdale and Melrose
Previously listed properties in Leaderdale and Melrose
Roads and Postcodes in Leaderdale and Melrose
Navigate through our locations to find the location of your next house in Leaderdale and Melrose, Lauder for sale or to rent.
| Streets | Postcodes |
|---|---|
| Allanbank Gardens | TD2 6AB TD2 6AD |
| Brownsmuir Park | TD2 6QD |
| Calfward Park | TD2 6QF |
| Castle Wynd | TD2 6TH |
| Clora Brae | TD2 6AE |
| Cranston Crescent | TD2 6UB |
| Cranston Road | TD2 6TU |
| Crofts Road | TD2 6QJ |
| East High Street | TD2 6RP TD2 6SS TD2 6SU |
| Edinburgh Road | TD2 6PA TD2 6TW |
| Factors Park | TD2 6QW |
| Greenlaw Road | TD2 6QP |
| Hardie Court | TD2 6RL |
| Harryburn Road | TD2 6PB |
| Heriot Field | TD2 6PJ |
| Janefield Court | TD2 6SW |
| Janefield Rise | TD2 6SP |
| Justice Park | TD2 6NZ |
| Kirk Wynd | TD2 6ST |
| Lauderdale Drive | TD2 6SN |
| Loan View | TD2 6TJ |
| Main Street | TD2 6PN |
| Maitland Park | TD2 6UA |
| Maitland Road | TD2 6TX |
| Manse Road | TD2 6QL |
| Market Place | TD2 6SR |
| Mid Row | TD2 6SZ TD2 6TB |
| Mill Wynd | TD2 6QN TD2 6SY |
| Millburn Park | TD2 6SL |
| Old Causeway | TD2 6SX |
| Old School Place | TD2 6QG |
| Scott Road | TD2 6QH |
| Smithy Croft | TD2 6RQ |
| South Gardens | TD2 6RJ |
| St Cuthbert's View | TD2 6RN |
| Station Road | TD2 6AA TD2 6PW |
| Stow Road | TD2 6TN |
| Symington Place | TD2 6TG |
| The Avenue | TD2 6TD |
| The Loan | TD2 6PL TD2 6TL |
| The Orchard | TD2 6QE |
| The Row | TD2 6PH TD2 6TQ |
| Thirlestane Crescent | TD2 6TT |
| Thirlestane Drive | TD2 6TS |
| Under Loan Park | TD2 6TP |
| Upper Loan Park | TD2 6TR |
| West High Street | TD2 6TE TD2 6TF |
| Wyndhead Way | TD2 6TY |
| TD2 6AW TD2 6PD TD2 6PE TD2 6PF TD2 6PG TD2 6PP TD2 6PQ TD2 6PR TD2 6PS TD2 6PT TD2 6PU TD2 6PX TD2 6PY TD2 6PZ TD2 6QA TD2 6QB TD2 6QQ TD2 6QR TD2 6QS TD2 6QT TD2 6QU TD2 6QX TD2 6QY TD2 6QZ TD2 6RA TD2 6RB TD2 6RD TD2 6RE TD2 6RF TD2 6RG TD2 6RS TD2 6RT TD2 6RU TD2 6RW TD2 6RX TD2 6RY TD2 6RZ TD2 6SA TD2 6SB TD2 6SD TD2 6SF TD2 6SG TD2 6SJ TD2 6UD TD2 6WA TD2 6XZ TD2 6YS TD2 6YZ TD2 6AF TD2 6YG TD2 6YW |
Transport near Leaderdale and Melrose
- FAQ
- Price Paid By Year
Frequently asked questions about Leaderdale and Melrose
What is the average price for a property for sale in Leaderdale and Melrose?
The average price for a property for sale in Leaderdale and Melrose is £292,646. There are 118 property listings for sale in Leaderdale and Melrose.
What streets have the most expensive properties for sale in Leaderdale and Melrose?
The streets with the most expensive properties for sale in Leaderdale and Melrose are Harryburn Road at an average of £640,000, Allanbank Gardens at an average of £626,000 and Cranston Crescent at an average of £537,500.
What streets have the most affordable properties for sale in Leaderdale and Melrose?
The streets with the most affordable properties for sale in Leaderdale and Melrose are Manse Road at an average of £110,000, The Loan at an average of £111,500 and The Row at an average of £150,600.
Which train stations are available in or near Leaderdale and Melrose?
Some of the train stations available in or near Leaderdale and Melrose are Stow, Galashiels and Tweedbank.
Property Price Paid in Leaderdale and Melrose by Year
The average sold property price by year was:
| Year | Average Sold Price | Price Change |
Sold Properties
|
|---|---|---|---|
| 2025 | £263,700 | -19% |
10 Properties |
| 2024 | £314,010 | 6% |
12 Properties |
| 2023 | £294,302 | 9% |
20 Properties |
| 2022 | £268,205 | 3% |
36 Properties |
| 2021 | £258,839 | 14% |
71 Properties |
| 2020 | £222,265 | 4% |
46 Properties |
| 2019 | £214,213 | 6% |
43 Properties |
| 2018 | £201,603 | -19% |
43 Properties |
| 2017 | £240,836 | 11% |
41 Properties |
| 2016 | £213,892 | 10% |
44 Properties |
| 2015 | £192,202 | -21% |
46 Properties |
| 2014 | £233,221 | 20% |
30 Properties |
| 2013 | £185,753 | -11% |
26 Properties |
| 2012 | £206,967 | 3% |
28 Properties |
| 2011 | £201,640 | 4% |
32 Properties |
| 2010 | £193,092 | -16% |
35 Properties |
| 2009 | £224,548 | -6% |
41 Properties |
| 2008 | £237,531 | 18% |
38 Properties |
| 2007 | £195,424 | 8% |
64 Properties |
| 2006 | £180,437 | 12% |
70 Properties |
| 2005 | £158,381 | -73% |
49 Properties |
| 2004 | £273,583 | 59% |
39 Properties |
| 2003 | £113,058 | 16% |
65 Properties |
| 2002 | £95,510 | 22% |
57 Properties |
| 2001 | £74,190 | - |
5 Properties |

