
Houses for sale & to rent in Glasgow, South Lanarkshire
House Prices in Glasgow
Properties in Glasgow have an average house price of £185k and had 5,702 Property Transactions within the last 3 years.¹
Glasgow is an area in South Lanarkshire with 73,933 households², where the most expensive property was sold for £1.5M.
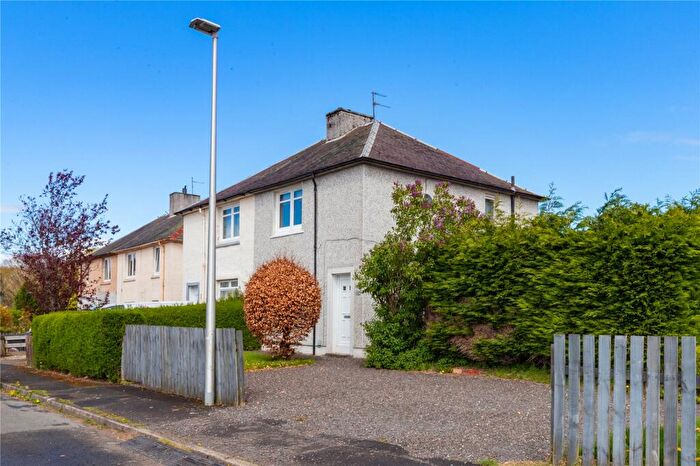
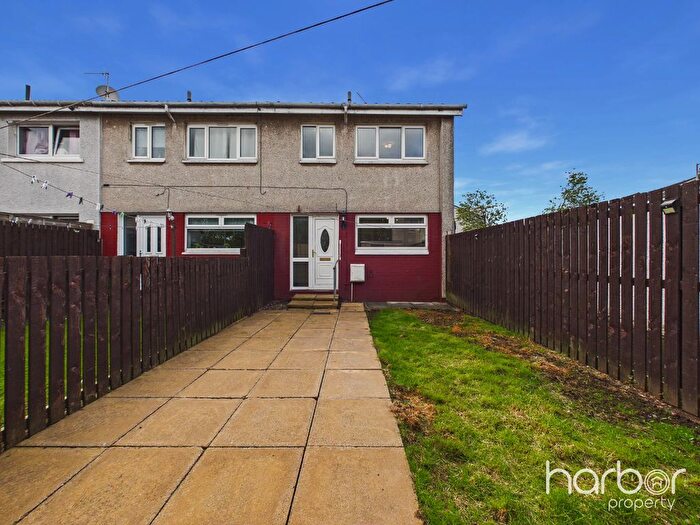
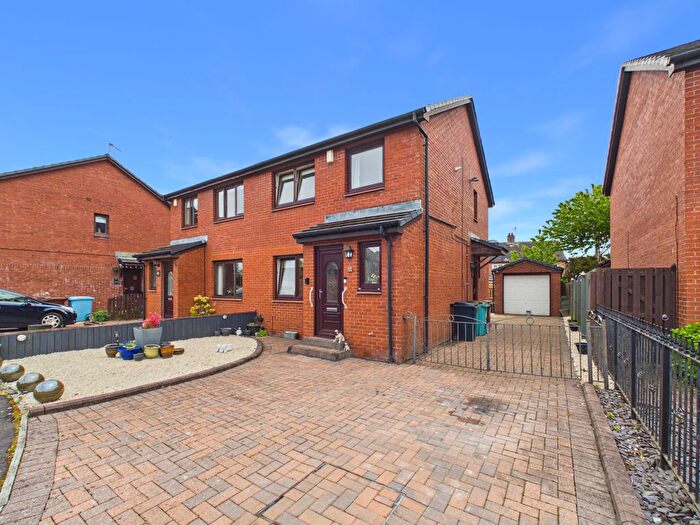
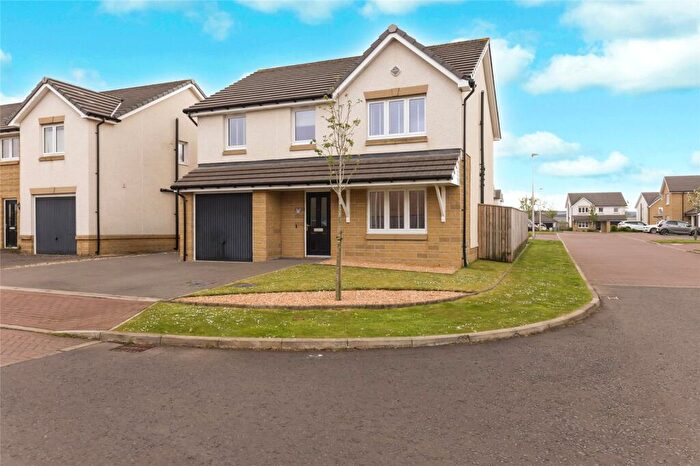
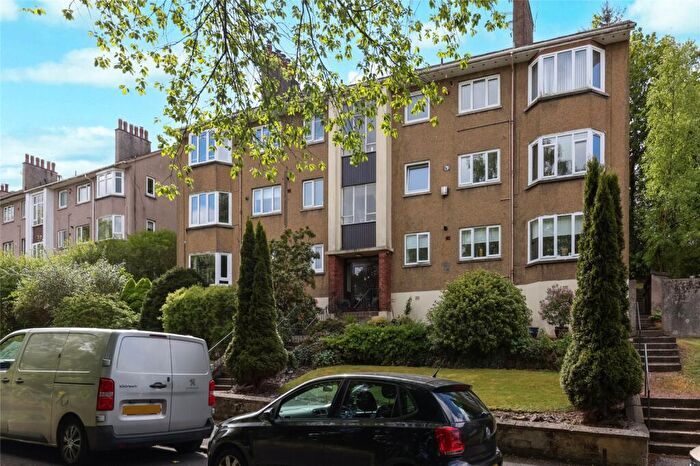
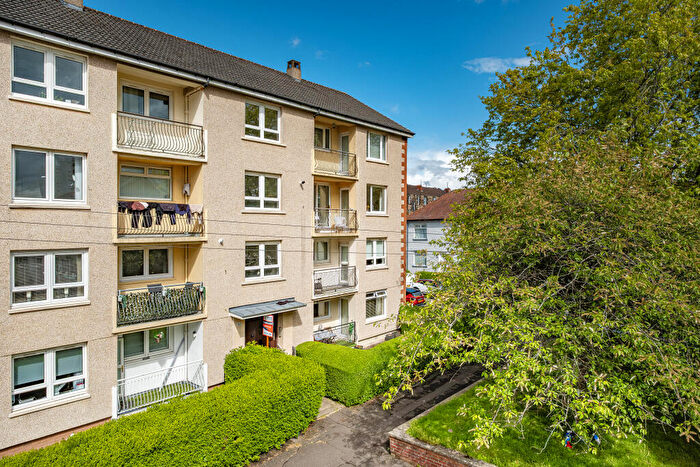
Properties for sale in Glasgow
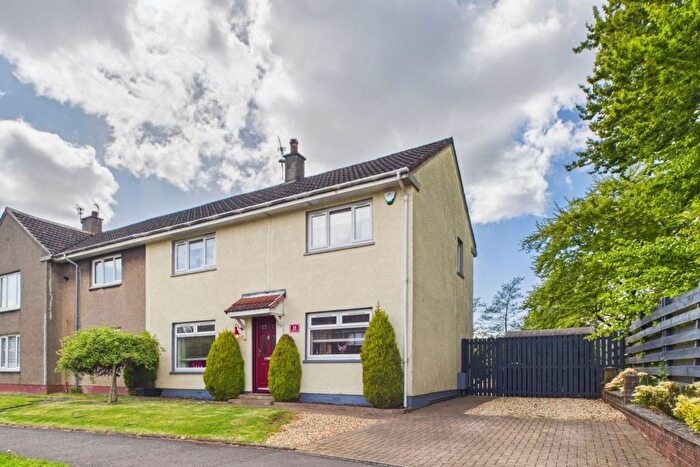
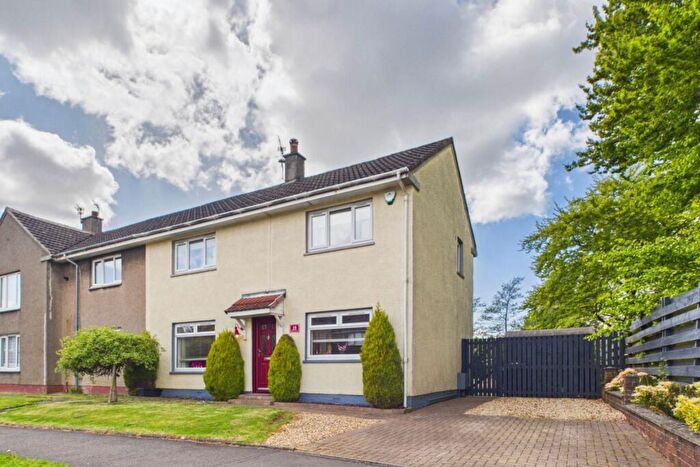
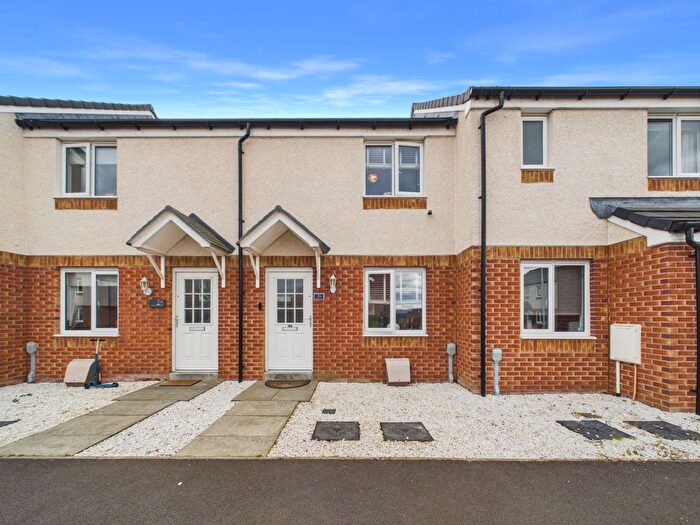
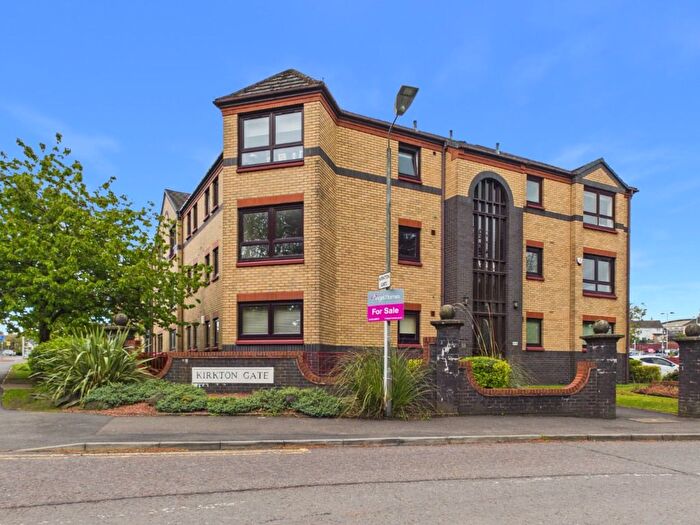
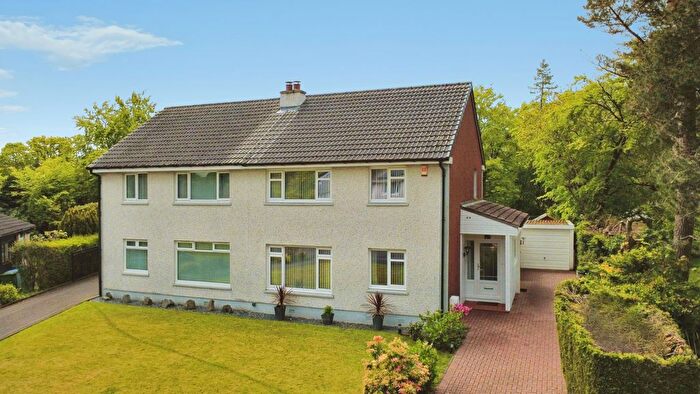
![]()
If you are looking to sell your house, let it out, or receive a property valuation, an expert can help you.
Click the button below to get started.


Neighbourhoods in Glasgow
Navigate through our locations to find the location of your next house in Glasgow, South Lanarkshire for sale or to rent.
Transport in Glasgow
Please see below transportation links in this area:
-
 Kirkhill Station
 -
East Kilbride Station
-
Cambuslang Station
-
Newton Station
-
Burnside Station
-
Hairmyres Station
- FAQ
- Price Paid By Year
Frequently asked questions about Glasgow
What is the average price for a property for sale in Glasgow?
The average price for a property for sale in Glasgow is £185,040. This amount is 3% higher than the average price in South Lanarkshire. There are more than 10,000 property listings for sale in Glasgow.
What locations have the most expensive properties for sale in Glasgow?
The locations with the most expensive properties for sale in Glasgow are Bothwell and Uddingston at an average of £292,716, Avondale and Stonehouse at an average of £291,090 and East Kilbride West at an average of £279,307.
What locations have the most affordable properties for sale in Glasgow?
The locations with the most affordable properties for sale in Glasgow are Hamilton North and East at an average of £84,276, East Kilbride Central South at an average of £114,895 and East Kilbride East at an average of £128,900.
Which train stations are available in or near Glasgow?
Some of the train stations available in or near Glasgow are Kirkhill, East Kilbride and Cambuslang.
Property Price Paid in Glasgow by Year
The average sold property price by year was:
| Year | Average Sold Price | Price Change |
Sold Properties
|
|---|---|---|---|
| 2025 | £198,200 | 9% |
1,848 Properties |
| 2024 | £180,400 | 2% |
1,887 Properties |
| 2023 | £177,127 | -3% |
1,967 Properties |
| 2022 | £183,028 | 4% |
3,504 Properties |
| 2021 | £175,470 | 5% |
4,101 Properties |
| 2020 | £167,502 | 0,4% |
3,069 Properties |
| 2019 | £166,872 | 7% |
4,064 Properties |
| 2018 | £155,527 | -2% |
3,865 Properties |
| 2017 | £158,661 | 5% |
3,554 Properties |
| 2016 | £150,844 | 4% |
3,431 Properties |
| 2015 | £144,252 | 5% |
3,200 Properties |
| 2014 | £136,556 | 6% |
3,359 Properties |
| 2013 | £128,090 | -4% |
2,714 Properties |
| 2012 | £133,416 | -9% |
2,518 Properties |
| 2011 | £145,519 | -6% |
2,222 Properties |
| 2010 | £153,728 | 5% |
2,252 Properties |
| 2009 | £145,968 | -9% |
2,173 Properties |
| 2008 | £158,671 | 8% |
3,086 Properties |
| 2007 | £146,479 | 9% |
4,583 Properties |
| 2006 | £132,905 | 7% |
4,885 Properties |
| 2005 | £123,511 | -75% |
4,298 Properties |
| 2004 | £216,019 | 60% |
4,507 Properties |
| 2003 | £85,482 | 6% |
4,971 Properties |
| 2002 | £80,391 | 18% |
4,616 Properties |
| 2001 | £66,080 | 55% |
302 Properties |
| 2000 | £29,540 | 64% |
2 Properties |
| 1999 | £10,650 | -65% |
1 Property |
| 1998 | £17,600 | -18% |
1 Property |
| 1997 | £20,750 | - |
3 Properties |