
Houses for sale & to rent in Strathaven, South Lanarkshire
House Prices in Strathaven
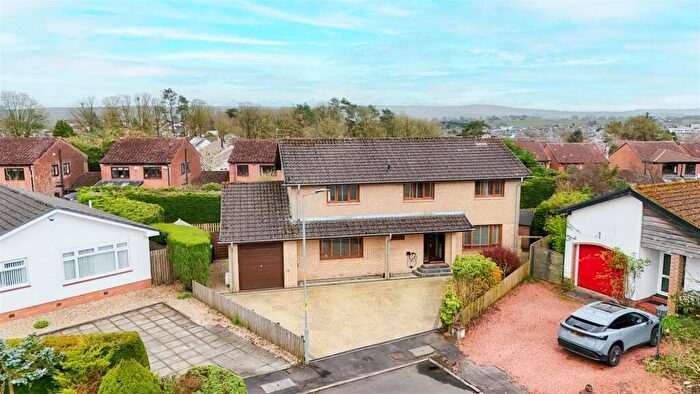
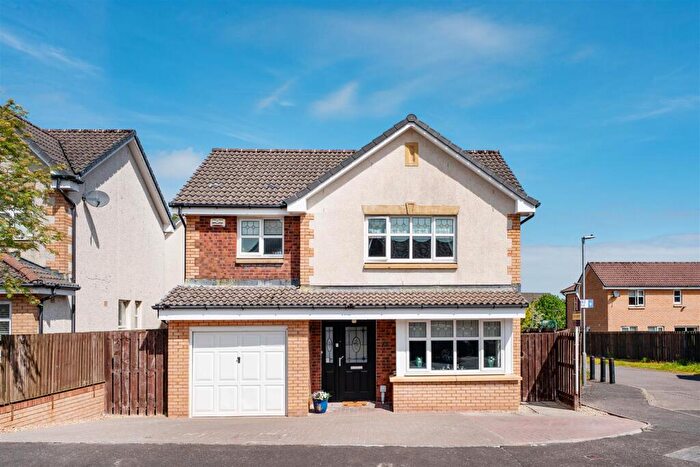
Properties in Strathaven have an average house price of £238k and had 335 Property Transactions within the last 3 years.¹
Strathaven is an area in South Lanarkshire with 4,394 households², where the most expensive property was sold for £718k.
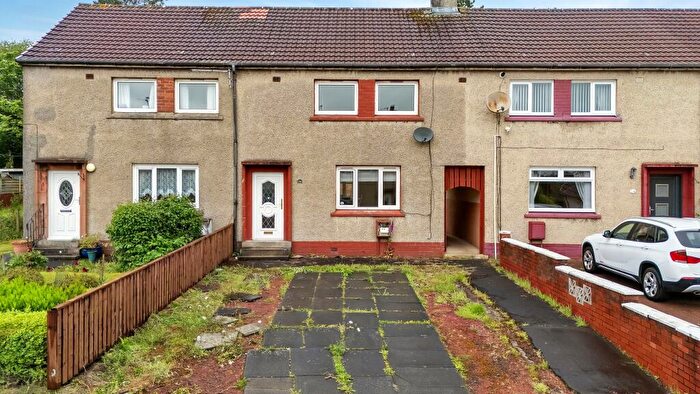
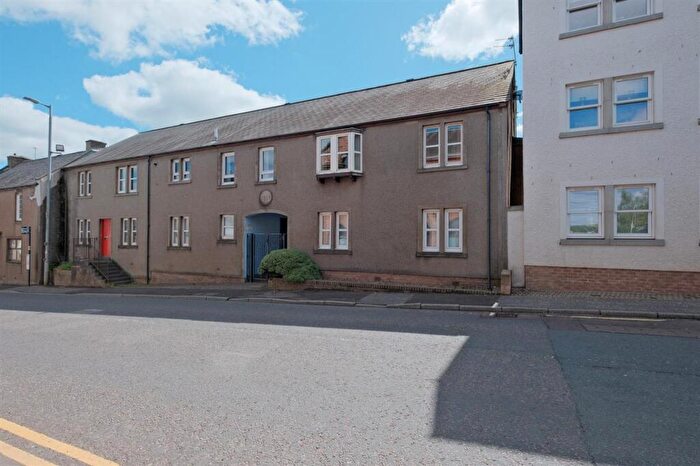
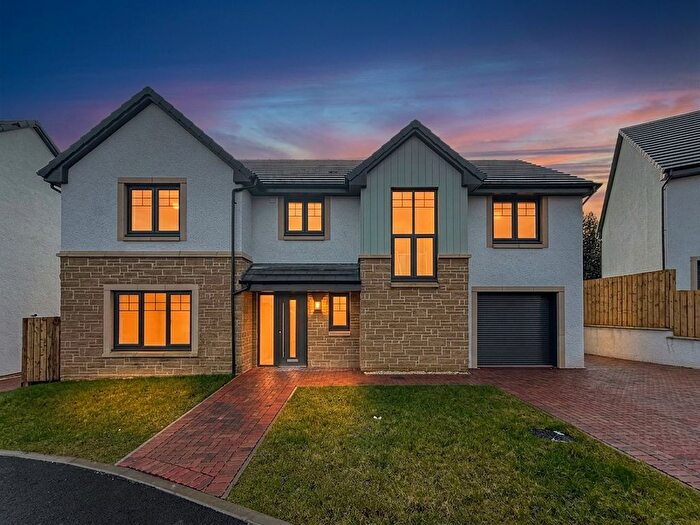
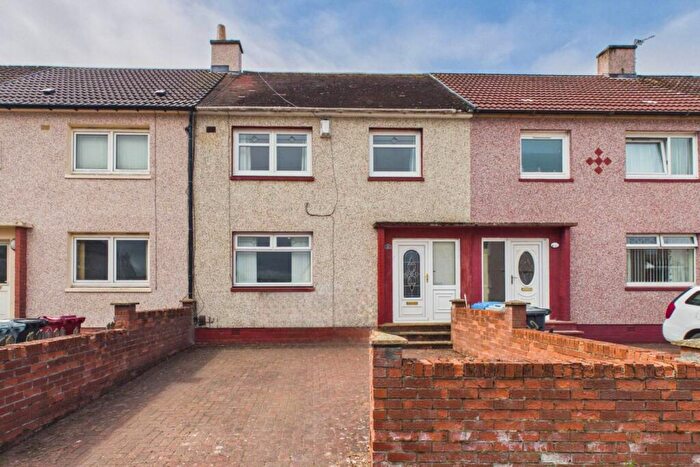
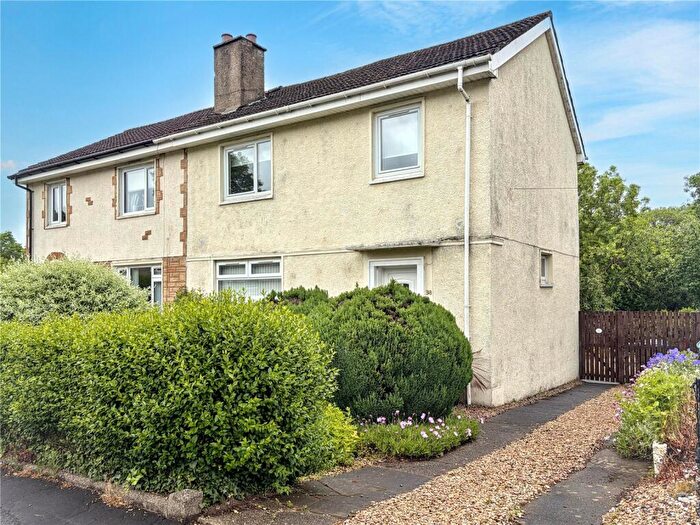
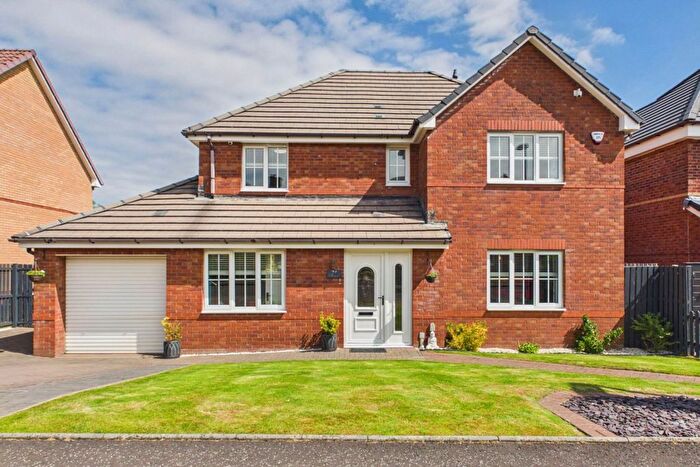
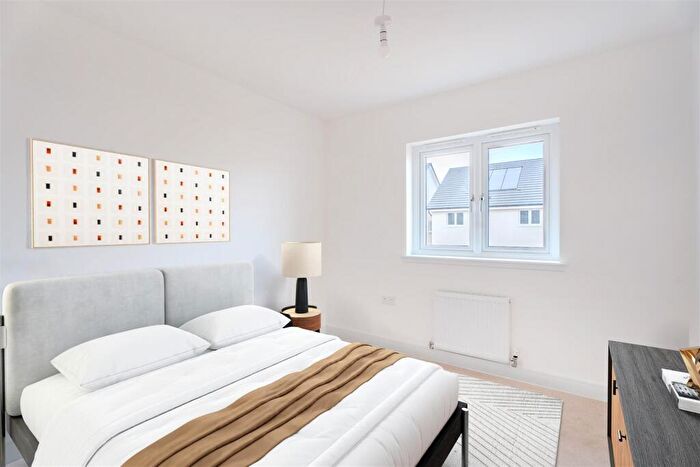
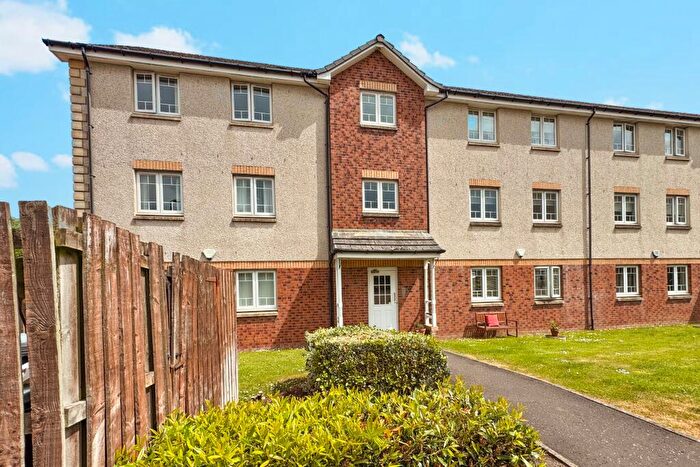
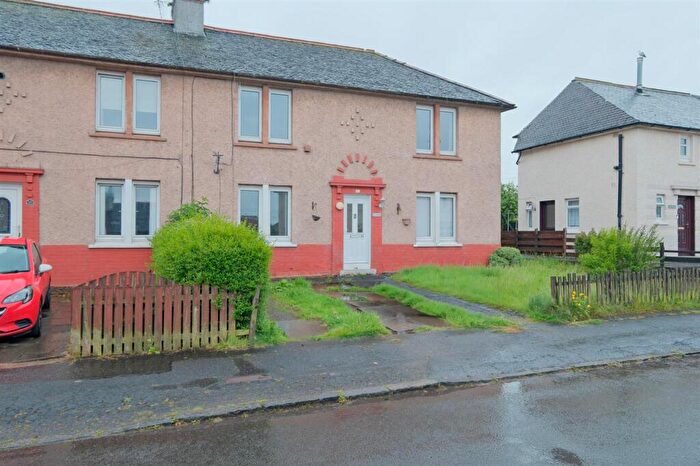
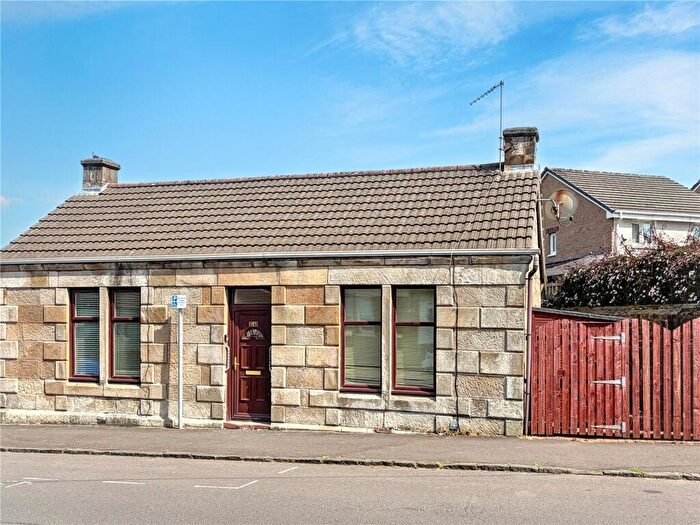
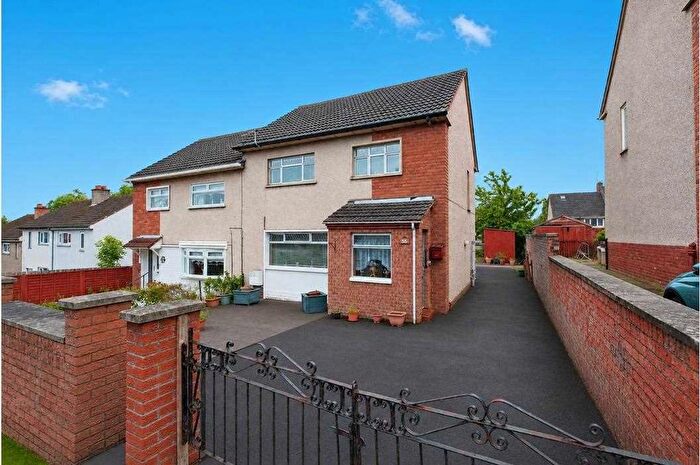
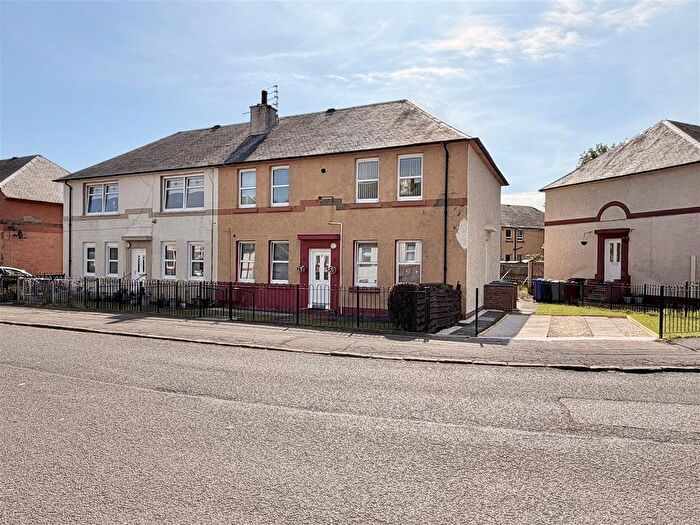
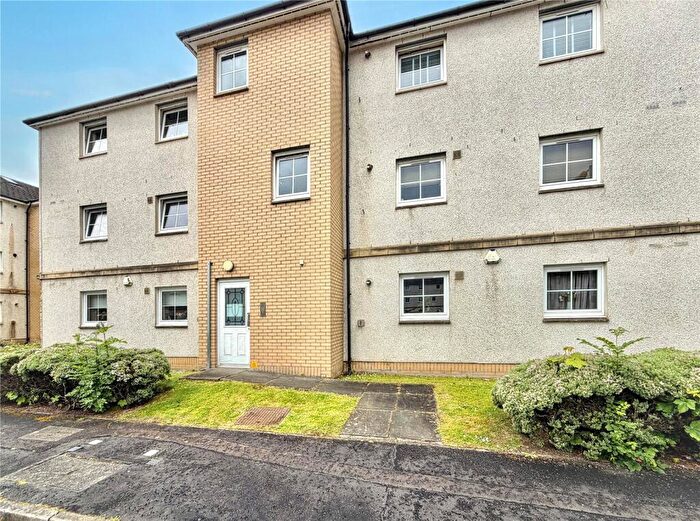
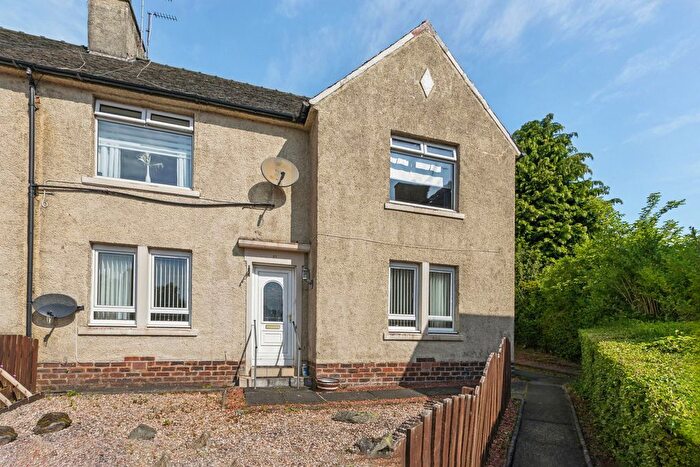
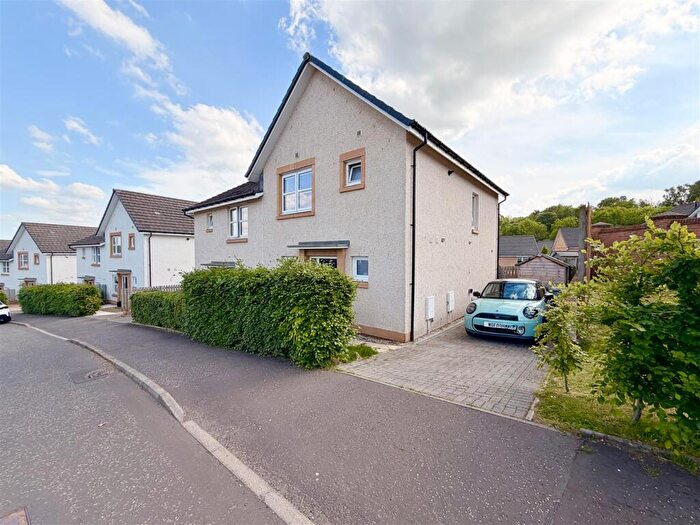
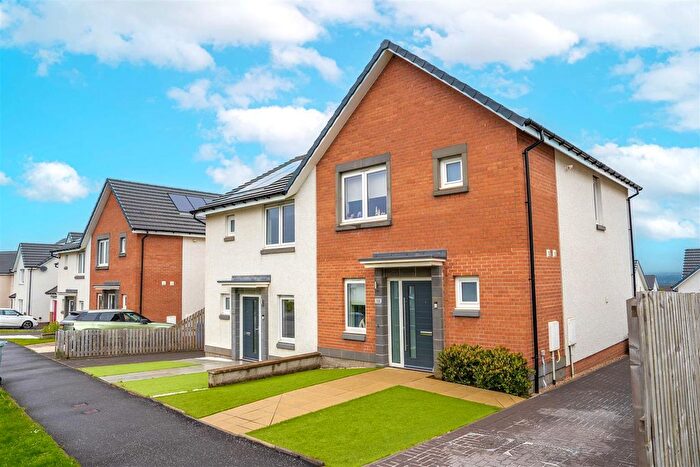
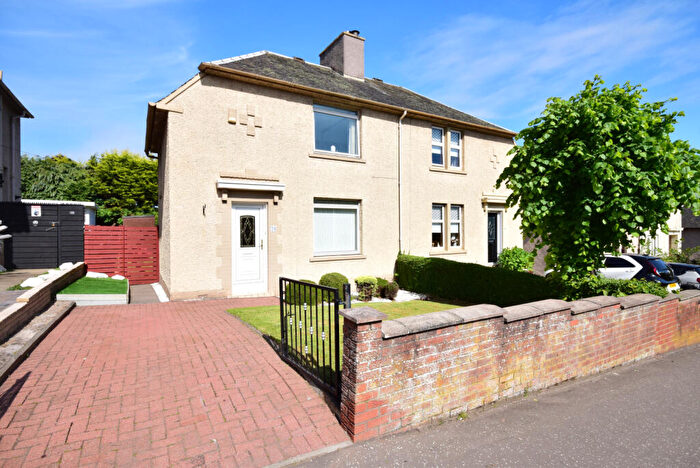
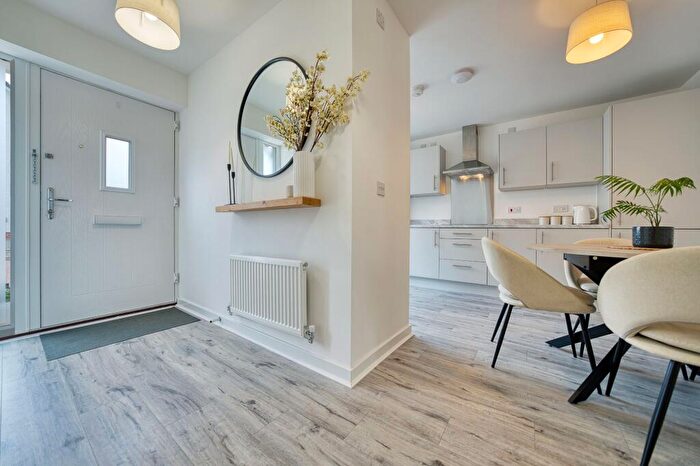
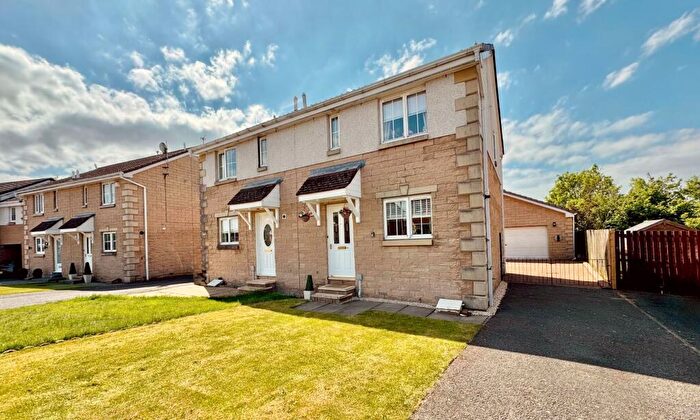
Properties for sale in Strathaven
![]()
If you are looking to sell your house, let it out, or receive a property valuation, an expert can help you.
Click the button below to get started.
Neighbourhoods in Strathaven
Navigate through our locations to find the location of your next house in Strathaven, South Lanarkshire for sale or to rent.
Transport in Strathaven
Please see below transportation links in this area:
-
 Larkhall Station
 -
Merryton Station
-
Chatelherault Station
-
Hamilton Central Station
-
Hamilton West Station
-
East Kilbride Station
-
Airbles Station
-
Shieldmuir Station
-
Hairmyres Station
-
Blantyre Station
- FAQ
- Price Paid By Year
Frequently asked questions about Strathaven
What is the average price for a property for sale in Strathaven?
The average price for a property for sale in Strathaven is £237,917. This amount is 32% higher than the average price in South Lanarkshire. There are 4,670 property listings for sale in Strathaven.
Which train stations are available in or near Strathaven?
Some of the train stations available in or near Strathaven are Larkhall, Merryton and Chatelherault.
Property Price Paid in Strathaven by Year
The average sold property price by year was:
| Year | Average Sold Price | Price Change |
Sold Properties
|
|---|---|---|---|
| 2025 | £216,239 | -16% |
104 Properties |
| 2024 | £249,856 | 2% |
109 Properties |
| 2023 | £245,729 | -3% |
122 Properties |
| 2022 | £253,184 | 7% |
205 Properties |
| 2021 | £234,523 | 7% |
277 Properties |
| 2020 | £217,934 | -4% |
250 Properties |
| 2019 | £226,815 | 7% |
354 Properties |
| 2018 | £209,887 | -1% |
396 Properties |
| 2017 | £212,468 | 21% |
314 Properties |
| 2016 | £168,601 | -2% |
202 Properties |
| 2015 | £172,623 | 3% |
224 Properties |
| 2014 | £167,360 | 8% |
161 Properties |
| 2013 | £153,852 | -5% |
133 Properties |
| 2012 | £161,548 | -11% |
137 Properties |
| 2011 | £178,959 | 1% |
105 Properties |
| 2010 | £177,680 | 1% |
132 Properties |
| 2009 | £176,659 | 4% |
127 Properties |
| 2008 | £169,914 | -24% |
161 Properties |
| 2007 | £211,313 | 24% |
275 Properties |
| 2006 | £161,074 | 20% |
261 Properties |
| 2005 | £129,343 | 14% |
281 Properties |
| 2004 | £111,775 | 17% |
231 Properties |
| 2003 | £92,813 | 13% |
238 Properties |
| 2002 | £80,690 | 37% |
225 Properties |
| 2001 | £50,674 | - |
18 Properties |