
Houses for sale & to rent in Carluke, South Lanarkshire
House Prices in Carluke
Properties in Carluke have an average house price of £165k and had 1,023 Property Transactions within the last 3 years.¹
Carluke is an area in South Lanarkshire with 16,544 households², where the most expensive property was sold for £2.15M.
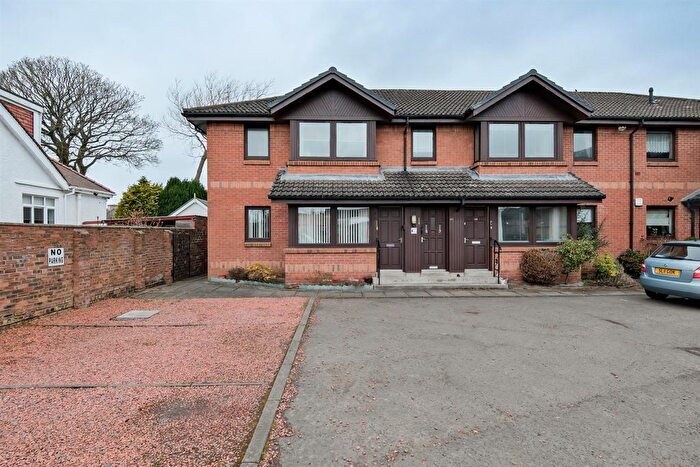
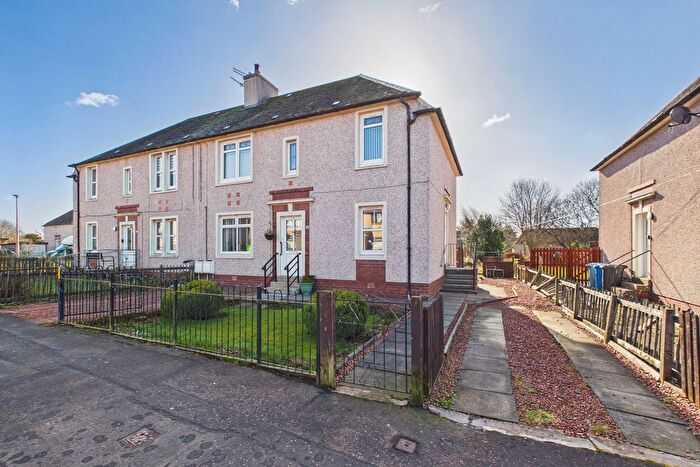
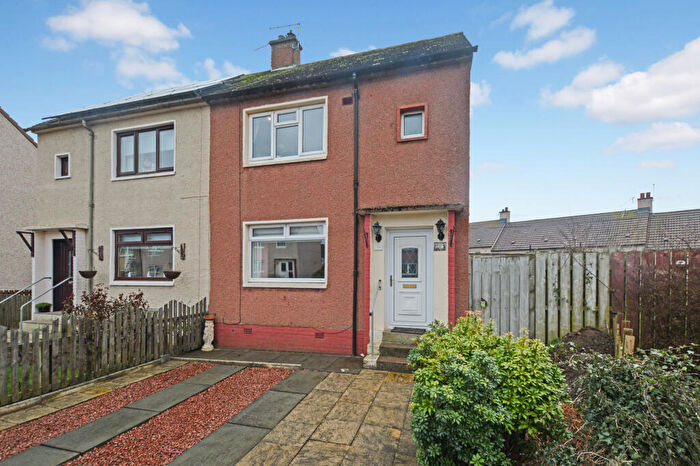
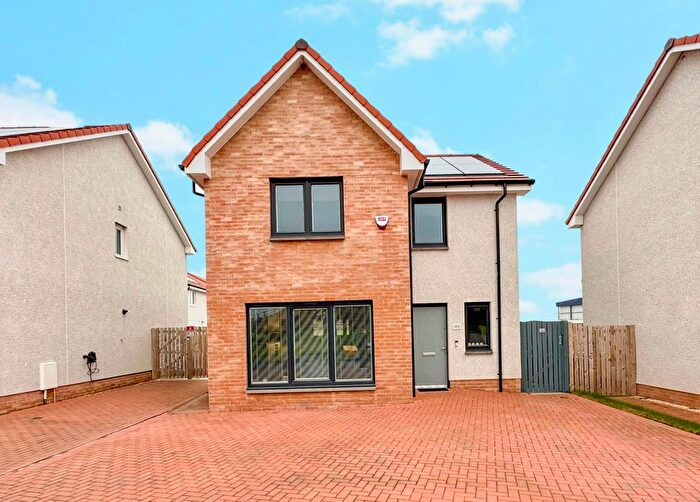
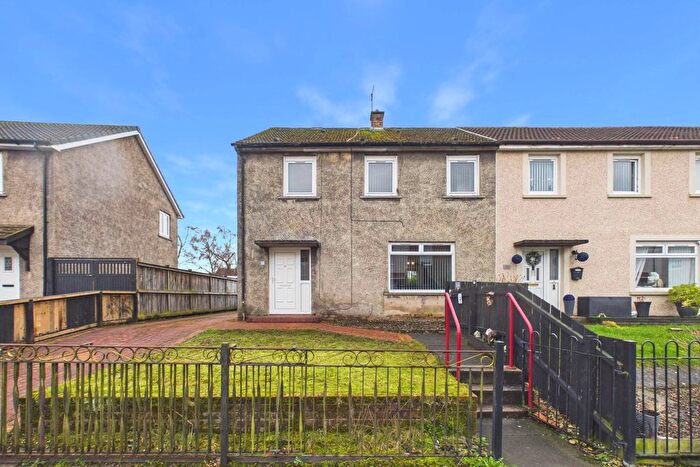
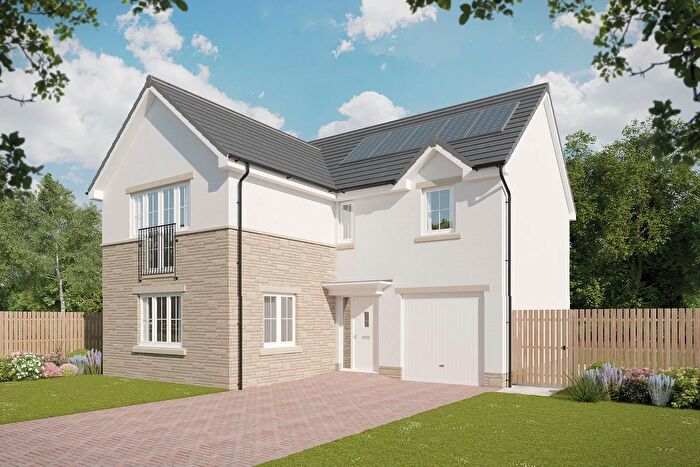
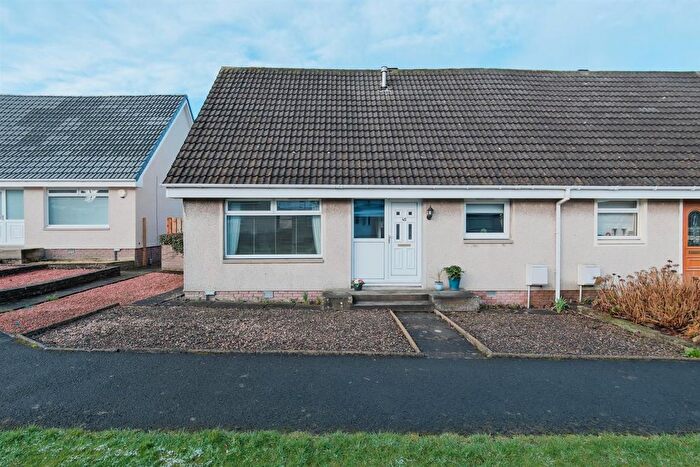
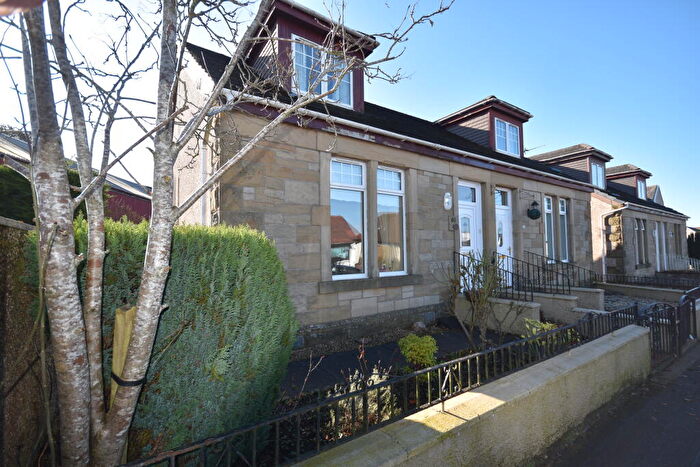
Properties for sale in Carluke
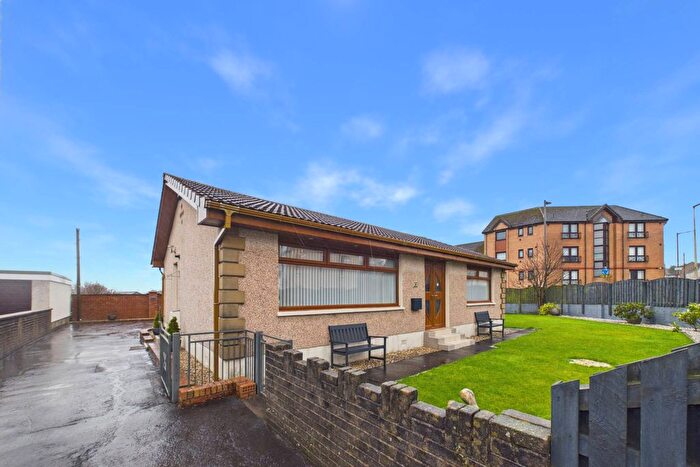
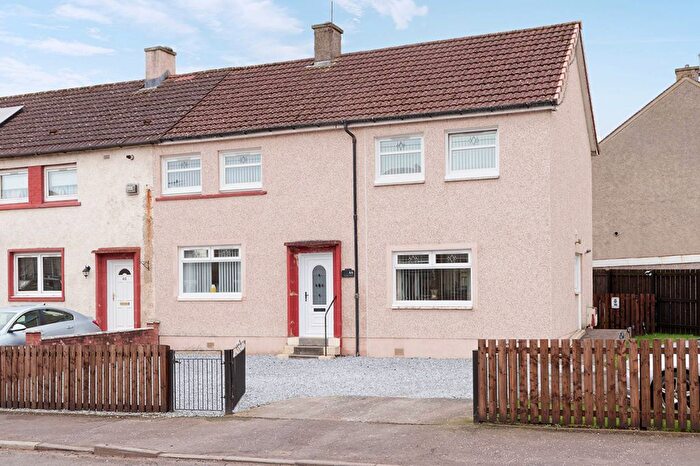
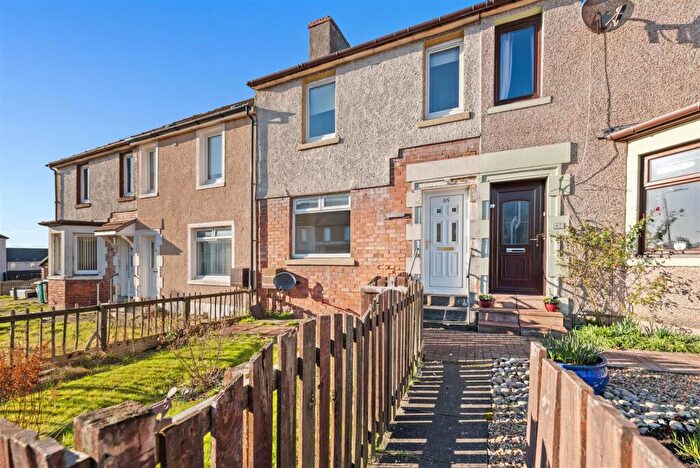
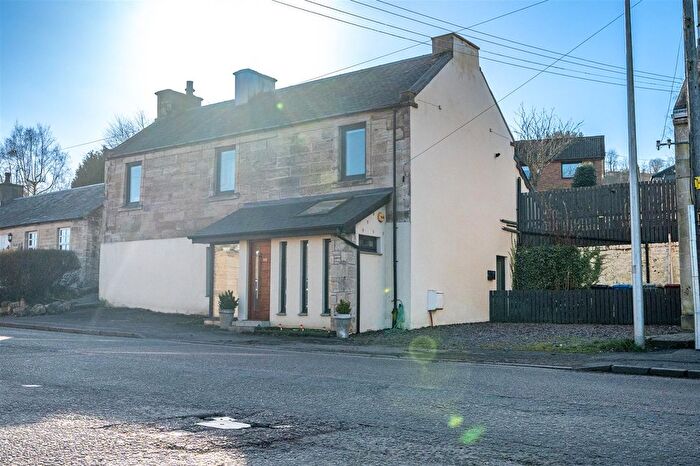
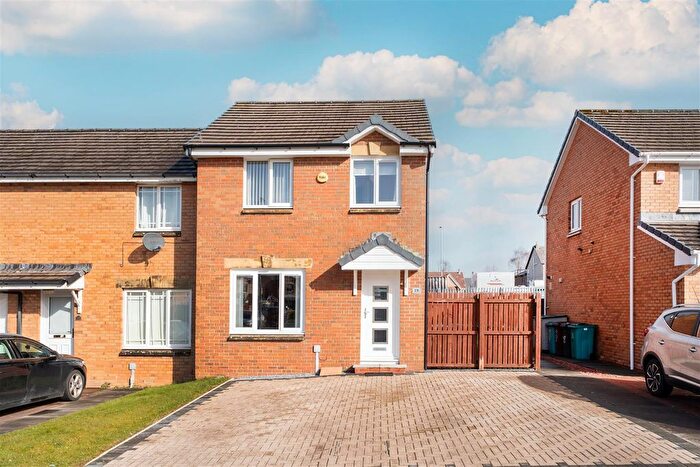

![]()
If you are looking to sell your house, let it out, or receive a property valuation, an expert can help you.
Click the button below to get started.


Neighbourhoods in Carluke
Navigate through our locations to find the location of your next house in Carluke, South Lanarkshire for sale or to rent.
Transport in Carluke
Please see below transportation links in this area:

- FAQ
- Price Paid By Year
Frequently asked questions about Carluke
What is the average price for a property for sale in Carluke?
The average price for a property for sale in Carluke is £164,678. This amount is 8% lower than the average price in South Lanarkshire. There are more than 10,000 property listings for sale in Carluke.
What locations have the most expensive properties for sale in Carluke?
The location with the most expensive properties for sale in Carluke is Clydesdale West at an average of £174,556.
What locations have the most affordable properties for sale in Carluke?
The location with the most affordable properties for sale in Carluke is Larkhall at an average of £154,306.
Which train stations are available in or near Carluke?
Some of the train stations available in or near Carluke are Carluke, Larkhall and Wishaw.
Property Price Paid in Carluke by Year
The average sold property price by year was:
| Year | Average Sold Price | Price Change |
Sold Properties
|
|---|---|---|---|
| 2025 | £172,025 | 5% |
256 Properties |
| 2024 | £164,058 | 2% |
354 Properties |
| 2023 | £160,656 | -2% |
413 Properties |
| 2022 | £164,120 | 1% |
674 Properties |
| 2021 | £162,589 | 9% |
818 Properties |
| 2020 | £147,579 | 8% |
648 Properties |
| 2019 | £135,195 | -3% |
731 Properties |
| 2018 | £139,562 | 5% |
752 Properties |
| 2017 | £132,816 | 12% |
739 Properties |
| 2016 | £117,141 | 1% |
591 Properties |
| 2015 | £115,875 | 5% |
618 Properties |
| 2014 | £109,749 | -3% |
576 Properties |
| 2013 | £113,297 | -0,1% |
421 Properties |
| 2012 | £113,465 | -8% |
380 Properties |
| 2011 | £122,209 | 11% |
438 Properties |
| 2010 | £109,108 | -44% |
458 Properties |
| 2009 | £156,813 | 24% |
444 Properties |
| 2008 | £119,938 | 10% |
696 Properties |
| 2007 | £108,461 | 7% |
905 Properties |
| 2006 | £100,444 | 13% |
974 Properties |
| 2005 | £87,406 | -0,4% |
851 Properties |
| 2004 | £87,772 | 31% |
908 Properties |
| 2003 | £60,197 | 11% |
898 Properties |
| 2002 | £53,564 | 4% |
930 Properties |
| 2001 | £51,197 | -189% |
69 Properties |
| 2000 | £148,000 | - |
1 Property |