
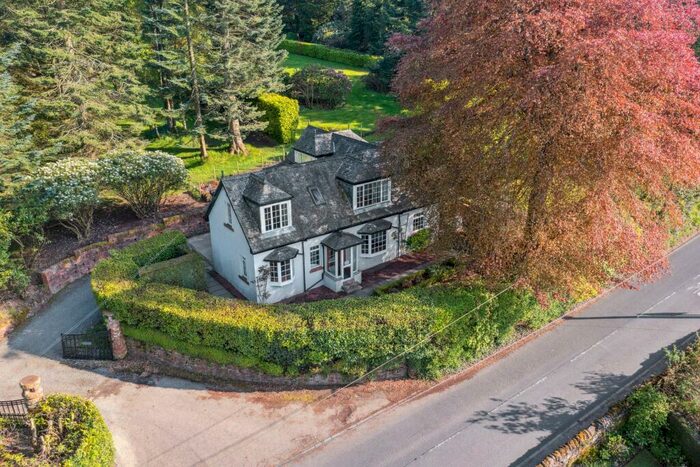
Houses for sale & to rent in FK8 3DW, Wingate Place, Forth and Endrick, Stirling
House Prices in FK8 3DW, Wingate Place, Forth and Endrick
Properties in FK8 3DW have no sales history available within the last 3 years. FK8 3DW is a postcode in Wingate Place located in Forth and Endrick, an area in Stirling, Stirling, with 4 households².
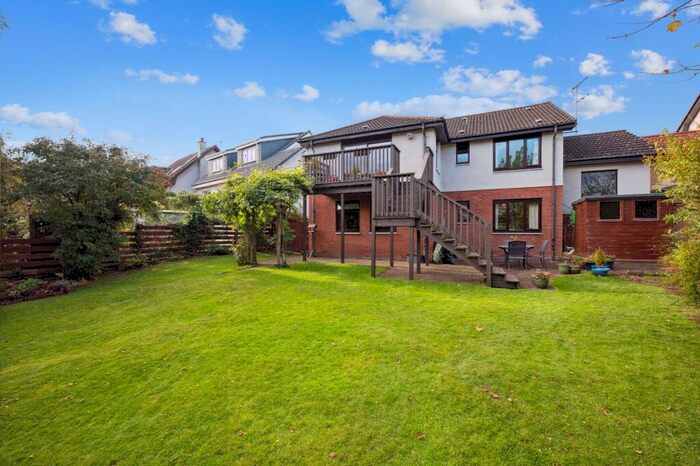
Properties for sale near FK8 3DW, Wingate Place


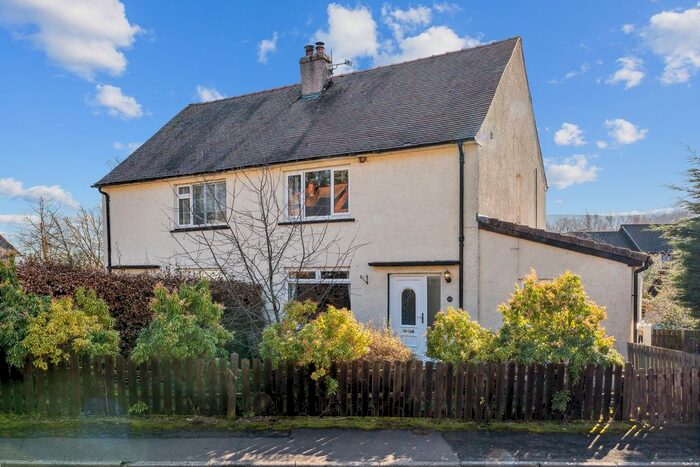
Previously listed properties near FK8 3DW, Wingate Place


Price Paid in Wingate Place, FK8 3DW, Forth and Endrick
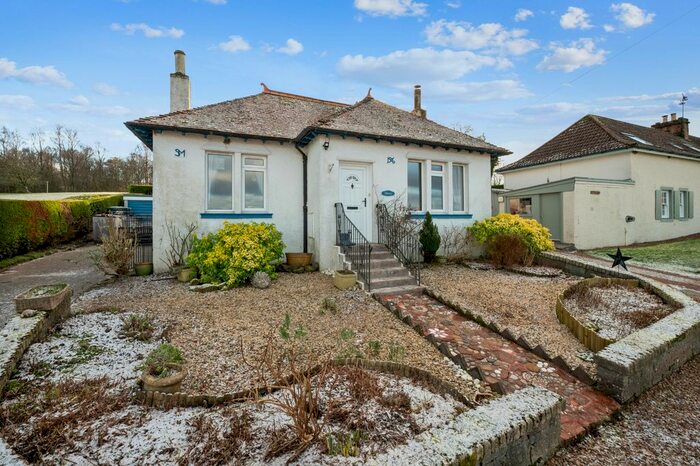
2 Wingate Place, FK8 3DW, Forth and Endrick Stirling
Property 2 has been sold 3 times. The last time it was sold was in 25/01/2018 and the sold price was £128,500.00.
This is a Property which was sold as an Established Building in 25/01/2018
| Date | Price | New Build |
|---|---|---|
| 25/01/2018 | £128,500.00 | Established Building |
| 15/08/2013 | £113,500.00 | Established Building |
| 27/06/2006 | £115,724.00 | Established Building |
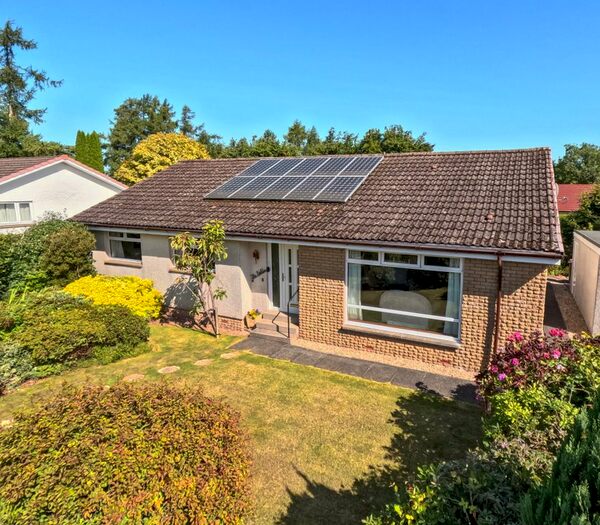
1 Wingate Place, FK8 3DW, Forth and Endrick Stirling
Property 1 has been sold 4 times. The last time it was sold was in 04/05/2017 and the sold price was £135,000.00.
This is a Property which was sold as an Established Building in 04/05/2017
| Date | Price | New Build |
|---|---|---|
| 04/05/2017 | £135,000.00 | Established Building |
| 22/09/2015 | £141,500.00 | Established Building |
| 09/06/2011 | £52,000.00 | Established Building |
| 24/11/2003 | £60,000.00 | Established Building |
3 Wingate Place, FK8 3DW, Forth and Endrick Stirling
Property 3 has been sold 1 time. The last time it was sold was in 23/10/2014 and the sold price was £57,200.00.
This is a Property which was sold as an Established Building in 23/10/2014
| Date | Price | New Build |
|---|---|---|
| 23/10/2014 | £57,200.00 | Established Building |
Transport near FK8 3DW, Wingate Place

House price paid reports for FK8 3DW, Wingate Place
Click on the buttons below to see price paid reports by year or property price:
- Price Paid By Year
Property Price Paid in FK8 3DW, Wingate Place by Year
The average sold property price by year was:
| Year | Average Sold Price | Price Change |
Sold Properties
|
|---|---|---|---|
| 2018 | £128,500 | -5% |
1 Property |
| 2017 | £135,000 | -5% |
1 Property |
| 2015 | £141,500 | 60% |
1 Property |
| 2014 | £57,200 | -98% |
1 Property |
| 2013 | £113,500 | 54% |
1 Property |
| 2011 | £52,000 | -123% |
1 Property |
| 2006 | £115,724 | 48% |
1 Property |
| 2003 | £60,000 | - |
1 Property |