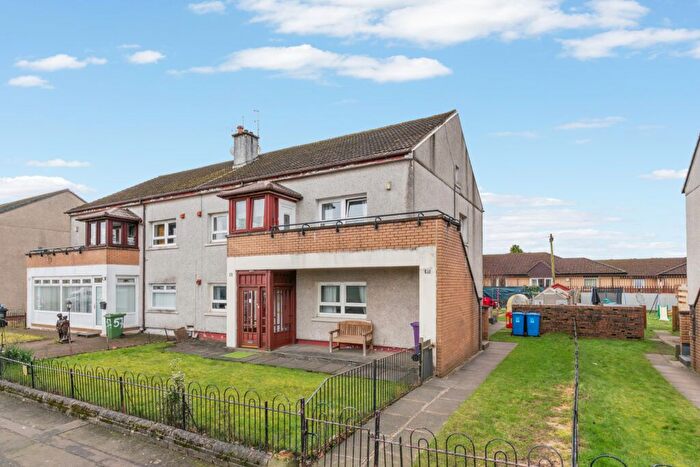
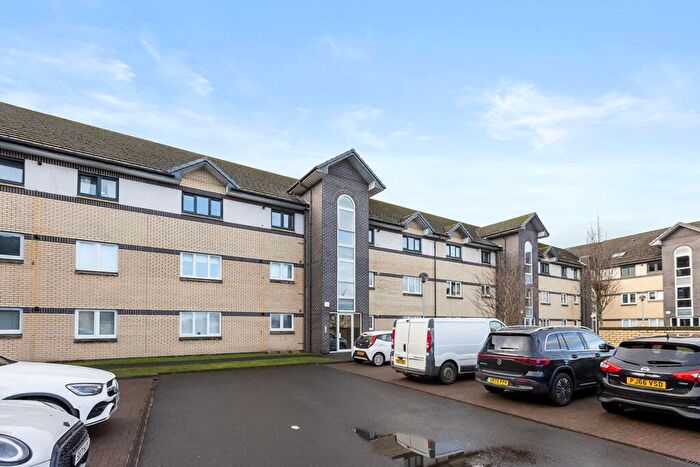
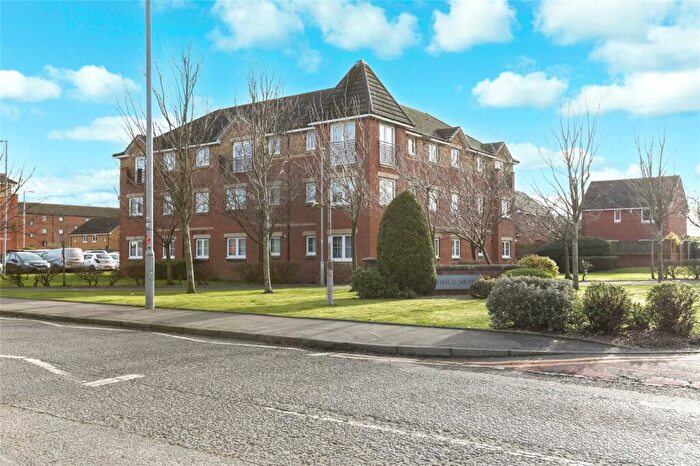
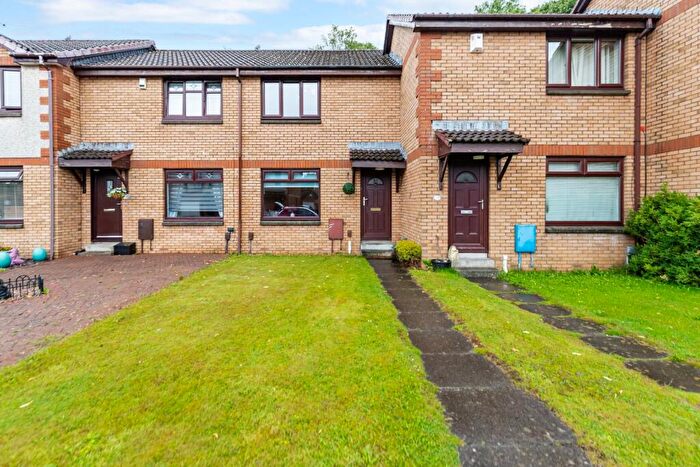
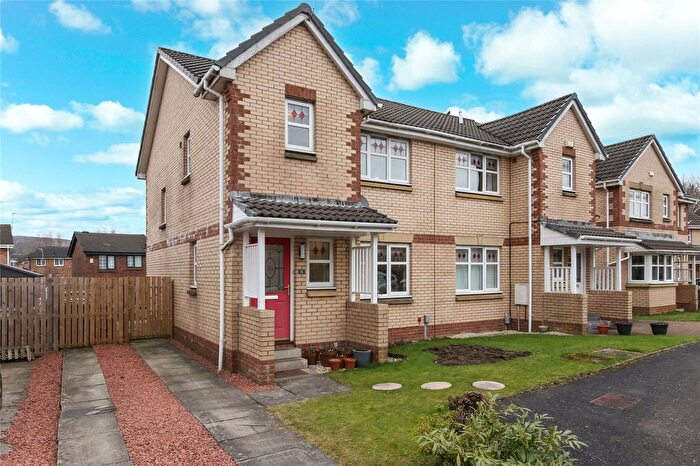
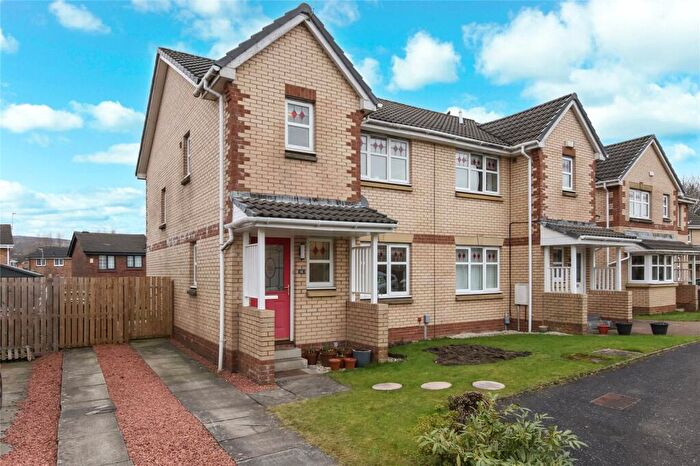
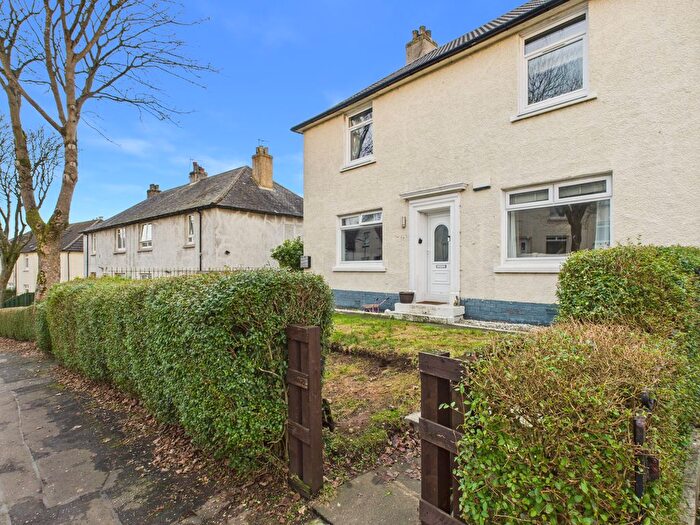
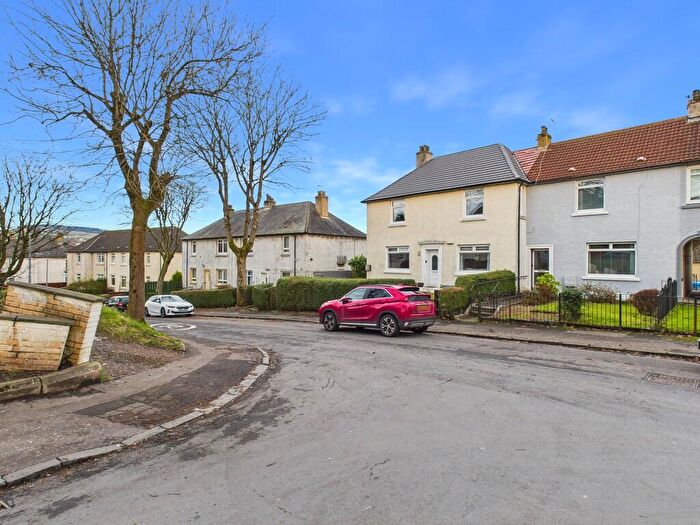
Houses for sale & to rent in Clydebank, West Dunbartonshire
House Prices in Clydebank
Properties in Clydebank have an average house price of £143,340.00 and had 637 Property Transactions within the last 3 years.¹
Clydebank is an area in West Dunbartonshire with 18,202 households², where the most expensive property was sold for £550,000.00.
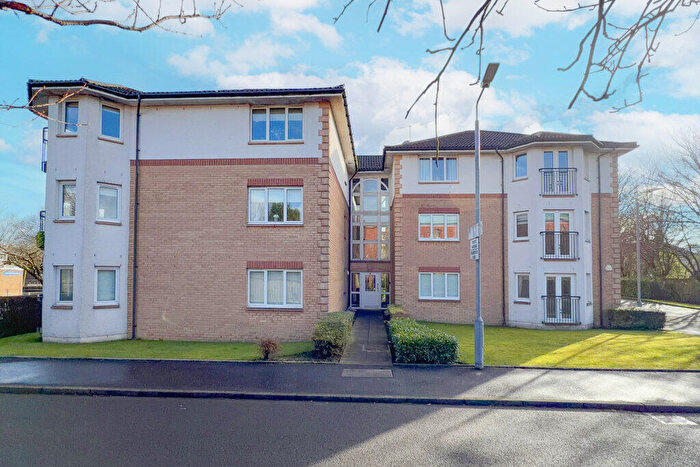
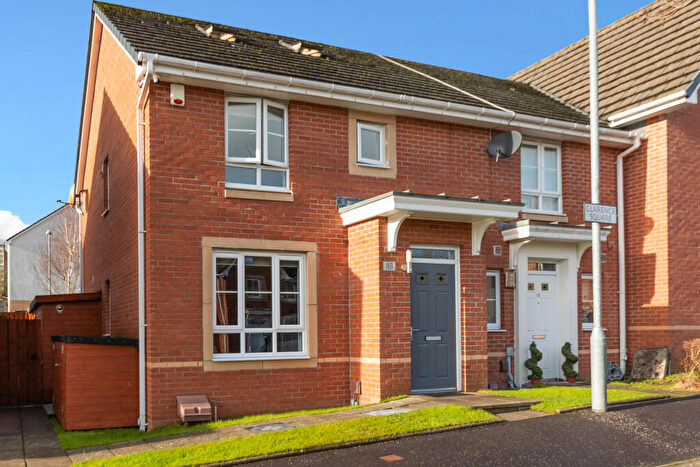
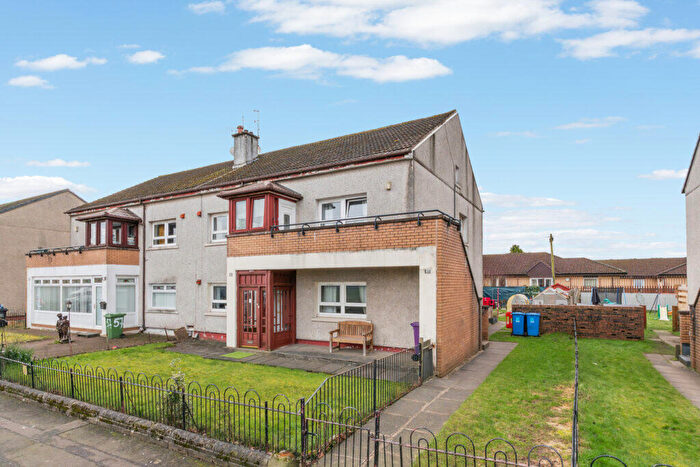
Properties for sale in Clydebank
Neighbourhoods in Clydebank
Navigate through our locations to find the location of your next house in Clydebank, West Dunbartonshire for sale or to rent.
Transport in Clydebank
Please see below transportation links in this area:
-
Singer Station
-
Dalmuir Station
-
Clydebank Station
-
Drumry Station
-
Yoker Station
-
Drumchapel Station
-
Kilpatrick Station
-
Garscadden Station
-
Westerton Station
-
Scotstounhill Station
- FAQ
- Price Paid By Year
Frequently asked questions about Clydebank
What is the average price for a property for sale in Clydebank?
The average price for a property for sale in Clydebank is £143,340. This amount is 9% lower than the average price in West Dunbartonshire. There are 4,198 property listings for sale in Clydebank.
What locations have the most expensive properties for sale in Clydebank?
The locations with the most expensive properties for sale in Clydebank are Kilpatrick at an average of £150,105 and Clydebank Central at an average of £145,980.
What locations have the most affordable properties for sale in Clydebank?
The location with the most affordable properties for sale in Clydebank is Clydebank Waterfront at an average of £126,434.
Which train stations are available in or near Clydebank?
Some of the train stations available in or near Clydebank are Singer, Dalmuir and Clydebank.
Property Price Paid in Clydebank by Year
The average sold property price by year was:
| Year | Average Sold Price | Price Change |
Sold Properties
|
|---|---|---|---|
| 2025 | £159,249 | 8% |
180 Properties |
| 2024 | £146,497 | 12% |
221 Properties |
| 2023 | £128,248 | 2% |
236 Properties |
| 2022 | £125,513 | 0,4% |
499 Properties |
| 2021 | £124,952 | 6% |
612 Properties |
| 2020 | £117,332 | 1% |
467 Properties |
| 2019 | £115,911 | 9% |
530 Properties |
| 2018 | £105,687 | 7% |
526 Properties |
| 2017 | £98,058 | 4% |
523 Properties |
| 2016 | £94,068 | -3% |
505 Properties |
| 2015 | £96,539 | -5% |
472 Properties |
| 2014 | £100,897 | 16% |
524 Properties |
| 2013 | £85,020 | -4% |
358 Properties |
| 2012 | £88,007 | -11% |
296 Properties |
| 2011 | £97,348 | -3% |
281 Properties |
| 2010 | £100,177 | -2% |
381 Properties |
| 2009 | £102,141 | -15% |
346 Properties |
| 2008 | £117,507 | 14% |
705 Properties |
| 2007 | £101,001 | -0,4% |
715 Properties |
| 2006 | £101,371 | 26% |
801 Properties |
| 2005 | £75,292 | 15% |
855 Properties |
| 2004 | £64,128 | 14% |
820 Properties |
| 2003 | £55,063 | -77% |
880 Properties |
| 2002 | £97,518 | 58% |
832 Properties |
| 2001 | £41,275 | - |
53 Properties |

