
Houses for sale in West Dunbartonshire, Scotland
House Prices in West Dunbartonshire
Properties in West Dunbartonshire have
an average house price of
£161k
and had 1,952 Property Transactions
within the last 3 years.¹
West Dunbartonshire is a location in
Scotland with
41,791 households², where the most expensive property was sold for £750k.
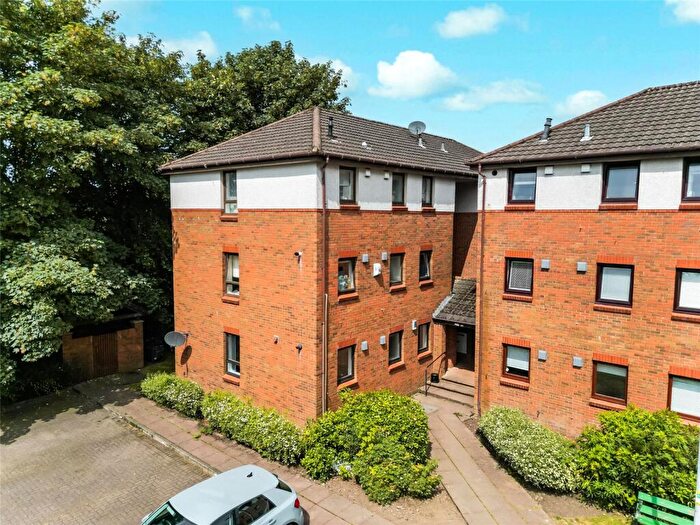
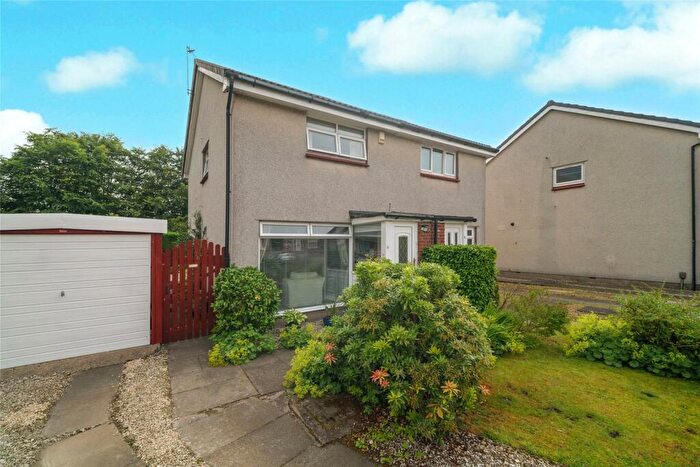
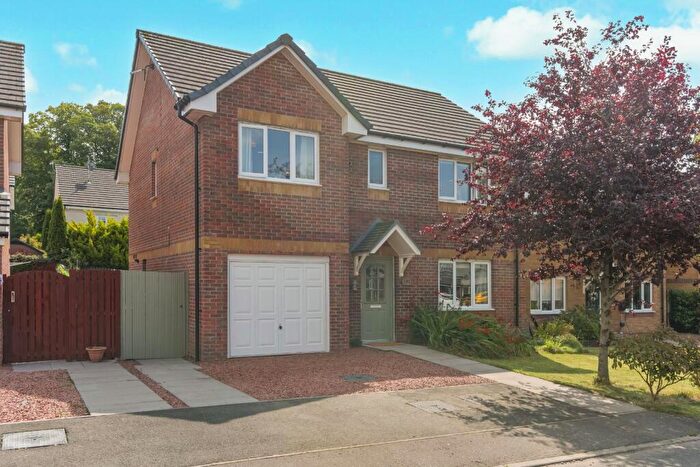
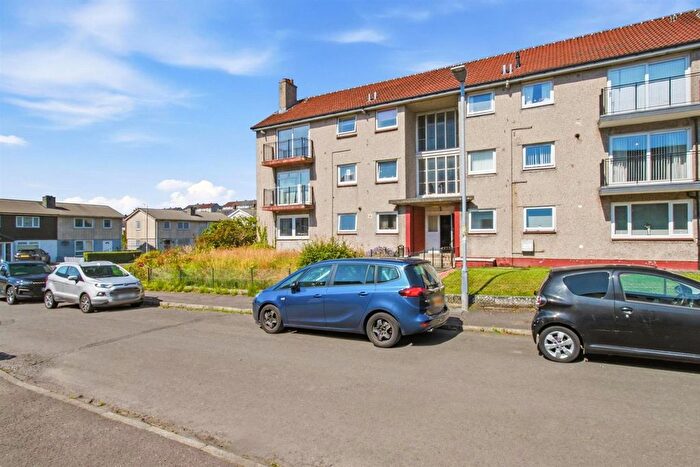
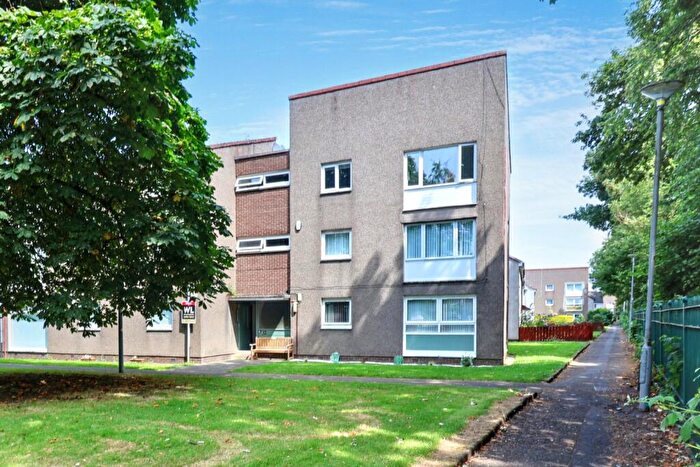
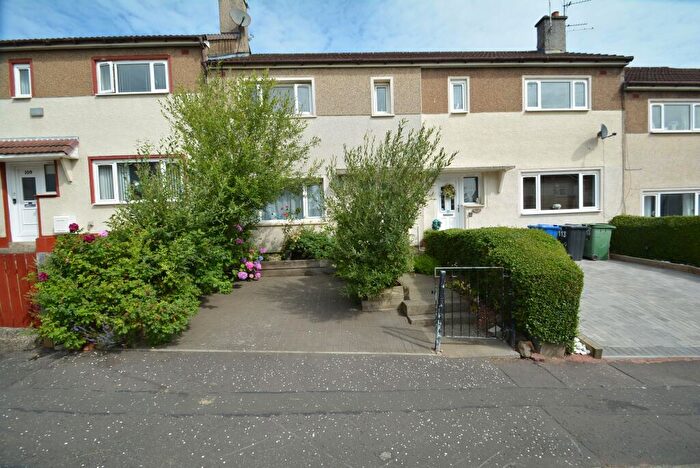
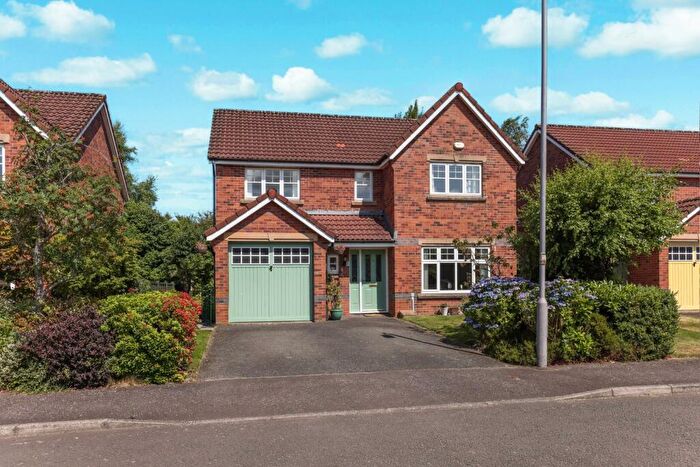
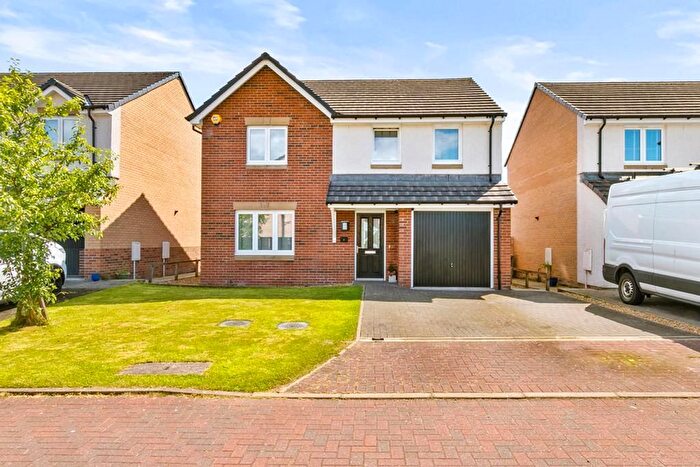
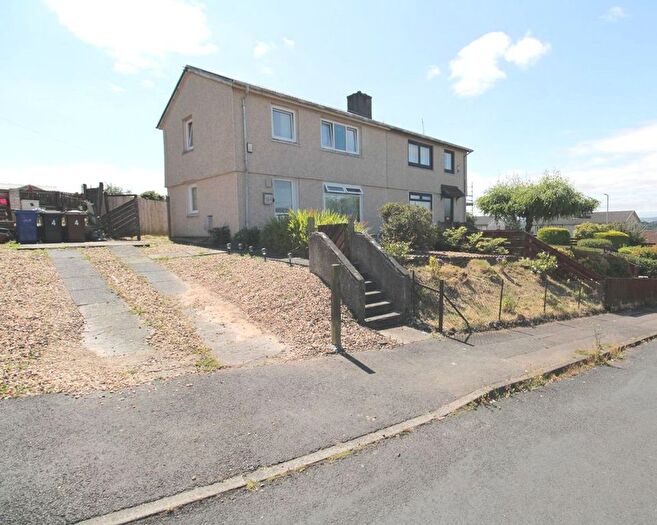
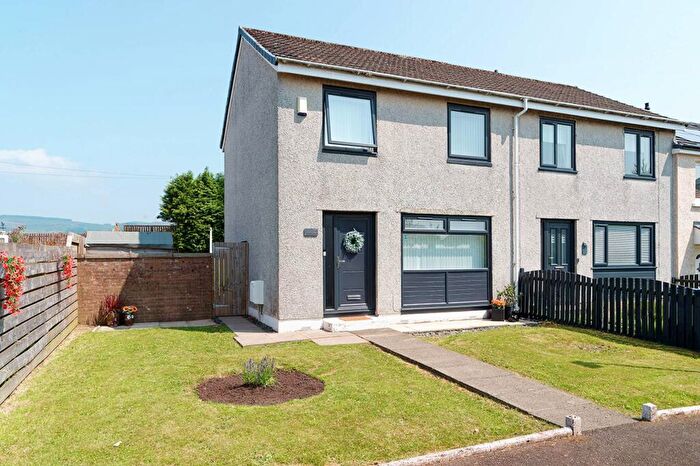
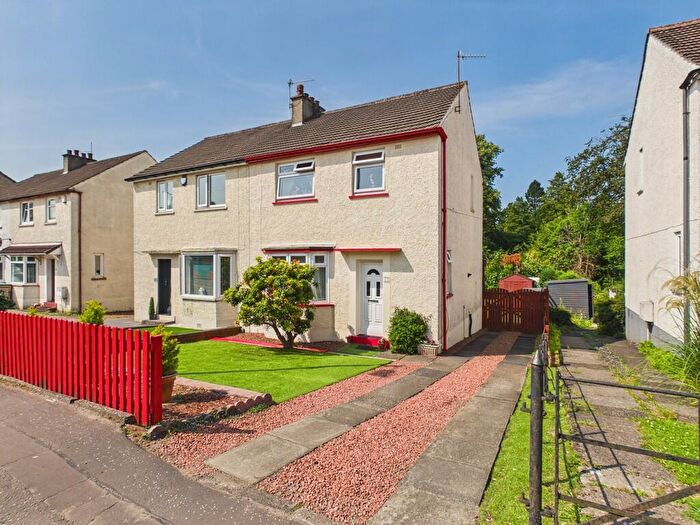
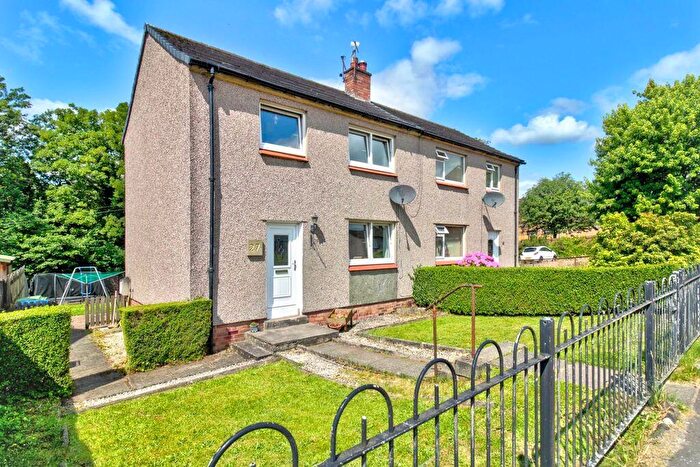
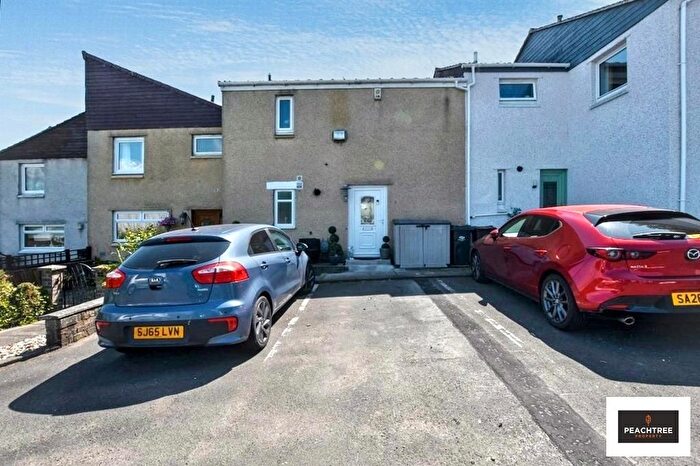
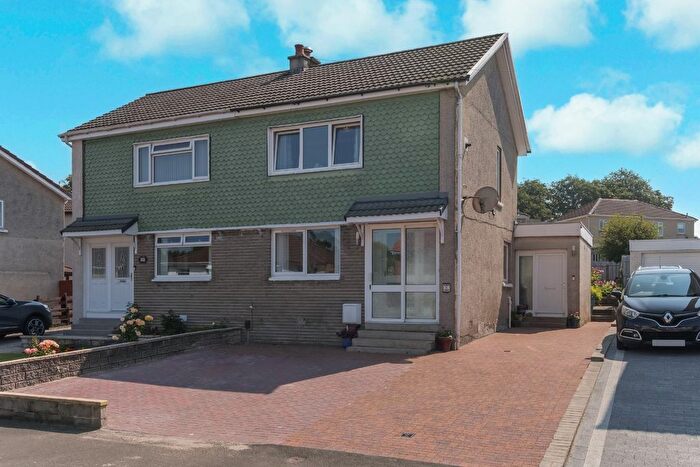
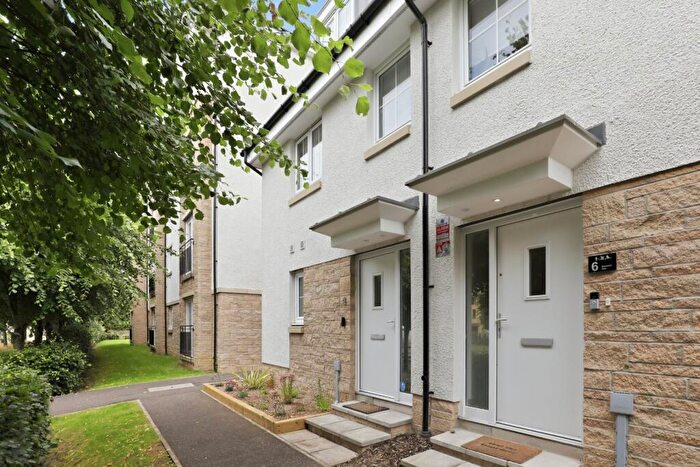
Properties for sale in West Dunbartonshire
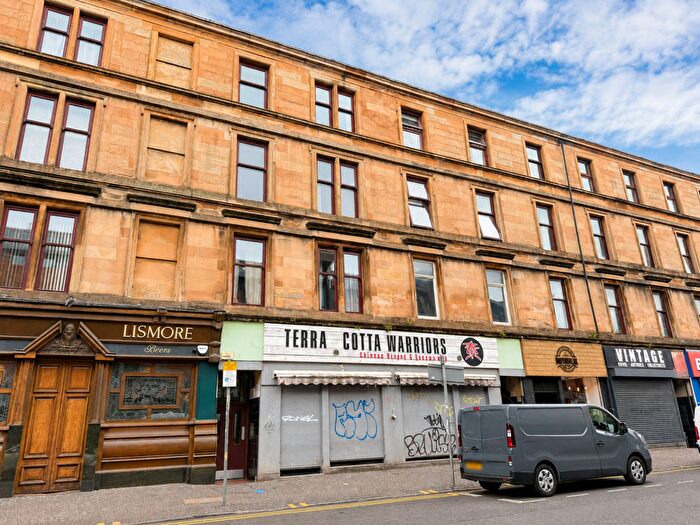
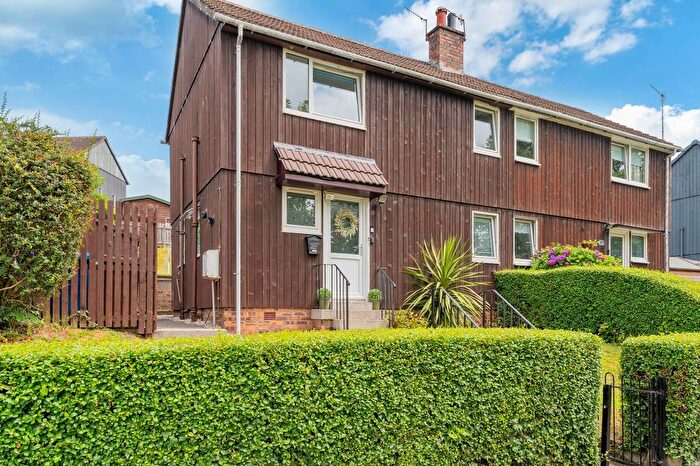
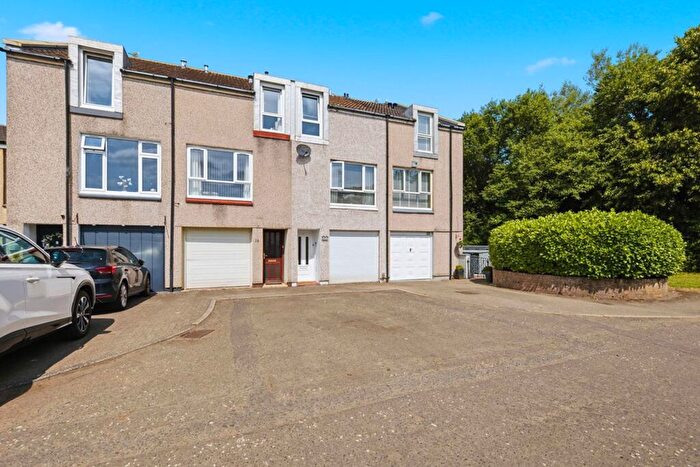
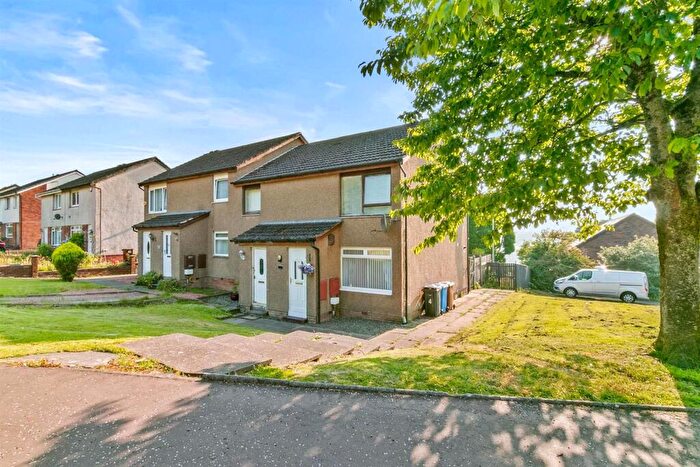
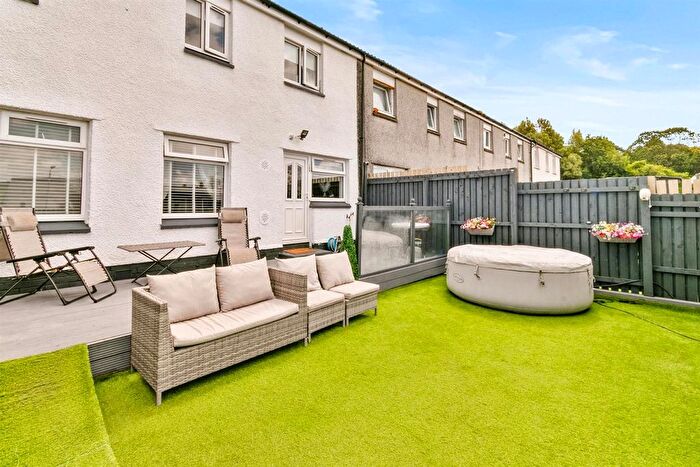
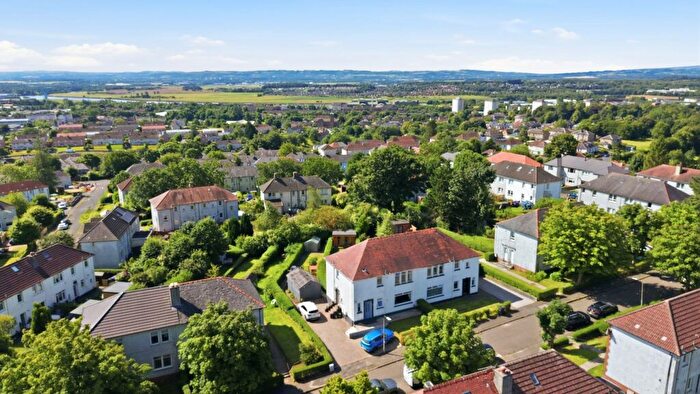
![]()
If you are looking to sell your house, let it out, or receive a property valuation, an expert can help you.
Click the button below to get started.


Towns in West Dunbartonshire
Navigate through our locations to find the location of your next house in West Dunbartonshire, Scotland for sale or to rent.
Property price trends in West Dunbartonshire
According to the latest Registers of Scotland data, the average home in West Dunbartonshire sold for £177,247 in 2026. That figure comes from a substantial record of 34,201 sales logged over the past 25 years.
Prices have continued to climb over the last three years. Compared with 2023, when the typical sale came in around £148,810, that's a rise of roughly 19.1%.
Looking back five years, average prices are up about 34.6% since 2021, a gain of around £45,575 in cash terms.
Zoom out to the past decade for the fuller picture. Back in 2016, homes here averaged £109,857, so the typical sold price has climbed about 61.3% since then, roughly 4.9% a year. Stretch the view to fifteen years and that annual pace eases back to about 2.9%.
Frequently asked questions about West Dunbartonshire
What is the average price for a property for sale in West Dunbartonshire?
The average price for a property for sale in West Dunbartonshire is £160,968. This amount is 20% lower than the average price in Scotland. There are more than 10,000 property listings for sale in West Dunbartonshire.
What locations have the most expensive properties for sale in West Dunbartonshire?
The locations with the most expensive properties for sale in West Dunbartonshire are Glasgow at an average of £199,608 and Dumbarton at an average of £179,057.
What locations have the most affordable properties for sale in West Dunbartonshire?
The locations with the most affordable properties for sale in West Dunbartonshire are Clydebank at an average of £144,959 and Alexandria at an average of £150,336.
Which train stations are available in or near West Dunbartonshire?
Some of the train stations available in or near West Dunbartonshire are Bowling, Kilpatrick and Dumbarton East.
Property Price Paid in West Dunbartonshire by Year
The average sold property price by year was:
| Year | Average Sold Price | Price Change |
Sold Properties
|
|---|---|---|---|
| 2026 | £177,247 | 5% |
132 Properties |
| 2025 | £168,236 | 3% |
626 Properties |
| 2024 | £162,794 | 9% |
559 Properties |
| 2023 | £148,810 | 7% |
635 Properties |
| 2022 | £138,855 | 5% |
1,282 Properties |
| 2021 | £131,672 | 3% |
1,505 Properties |
| 2020 | £127,861 | 1% |
1,266 Properties |
| 2019 | £126,767 | 3% |
1,495 Properties |
| 2018 | £122,550 | 7% |
1,423 Properties |
| 2017 | £113,766 | 3% |
1,392 Properties |
Transport in West Dunbartonshire
Please see below transportation links in this area:
