
Houses for sale & to rent in EH47 0BZ, Kings Road, Whitburn and Blackburn, Bathgate
House Prices in EH47 0BZ, Kings Road, Whitburn and Blackburn
Properties in EH47 0BZ have an average house price of £130k and had 1 Property Transaction within the last 3 years.¹ EH47 0BZ is a postcode in Kings Road located in Whitburn and Blackburn, an area in Bathgate, West Lothian, with 9 households², where the most expensive property was sold for £130k.
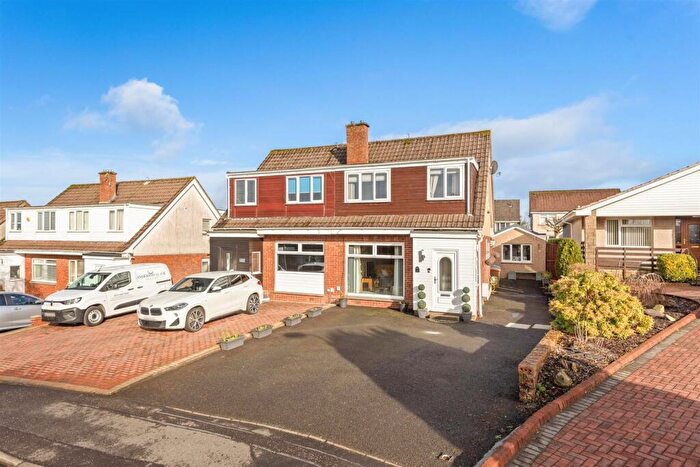
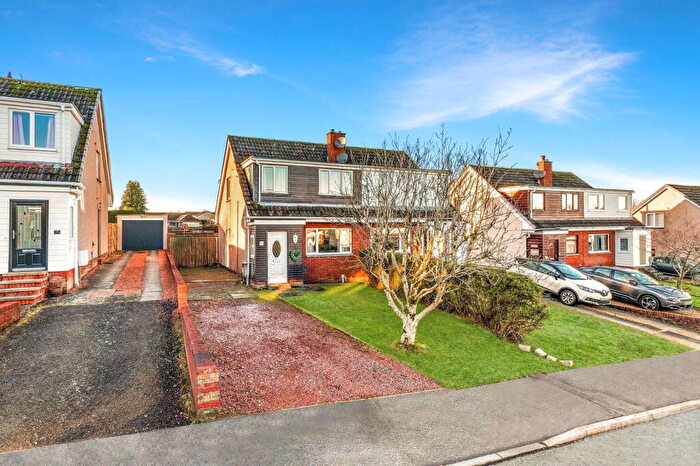
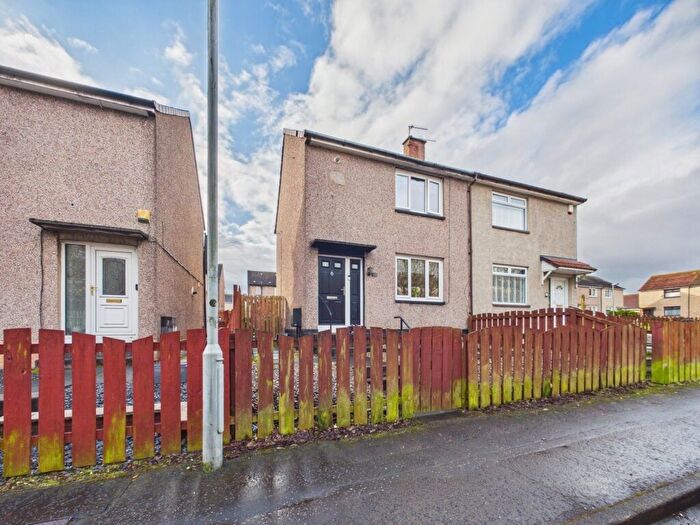
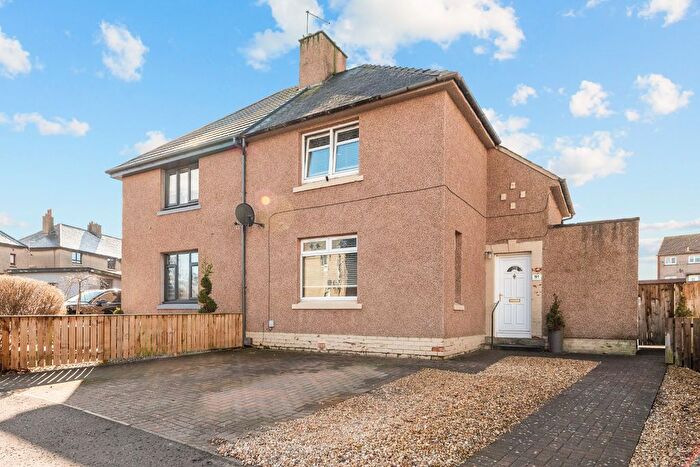
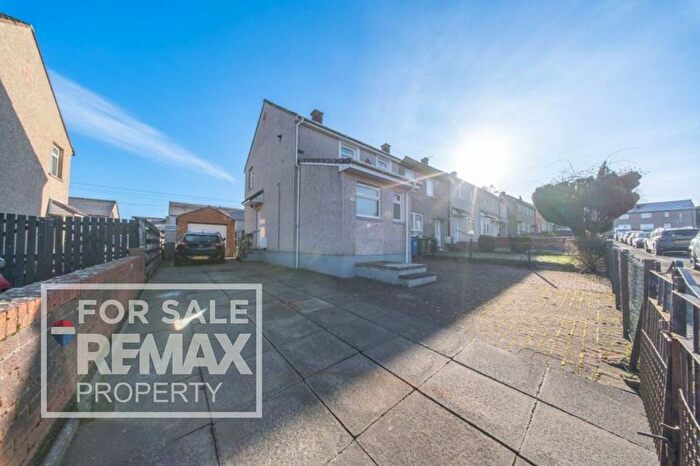
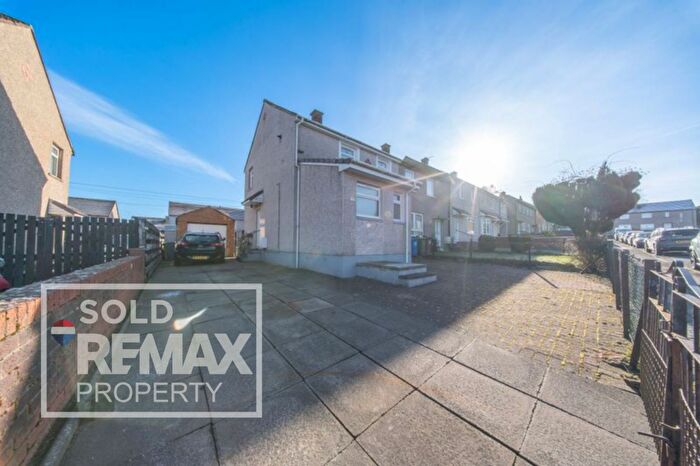
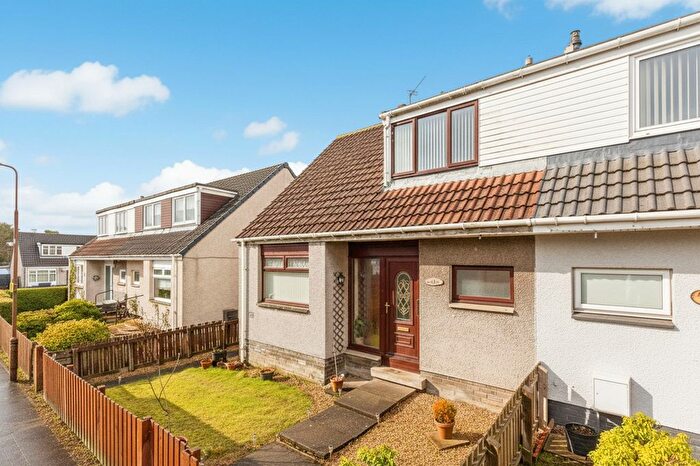
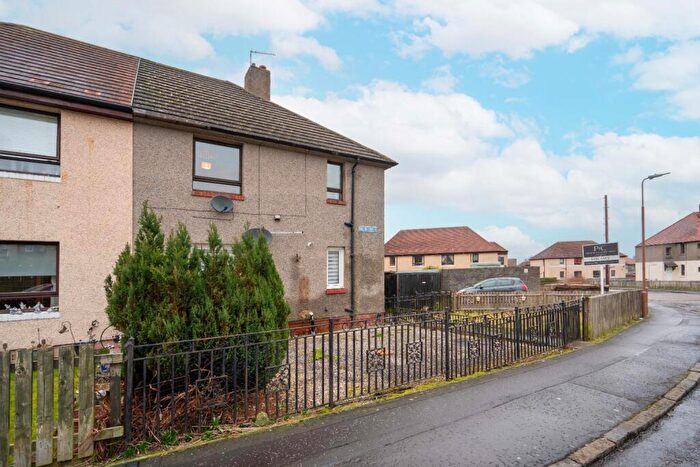
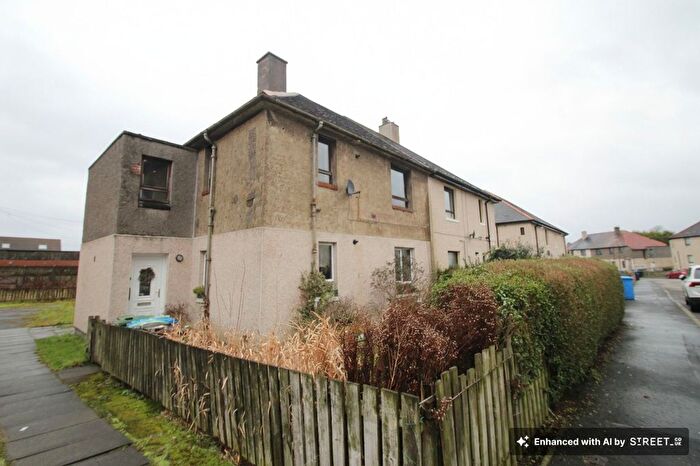
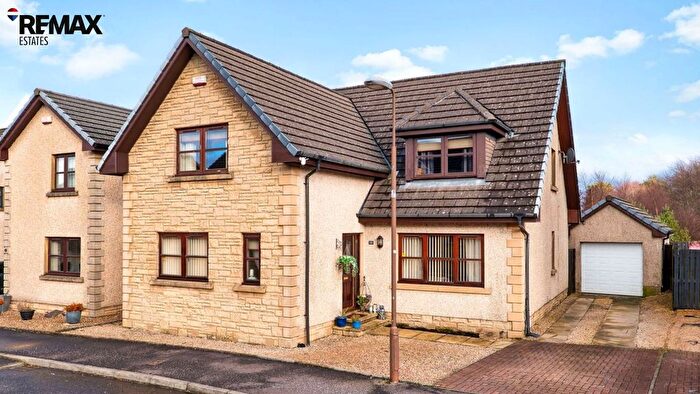
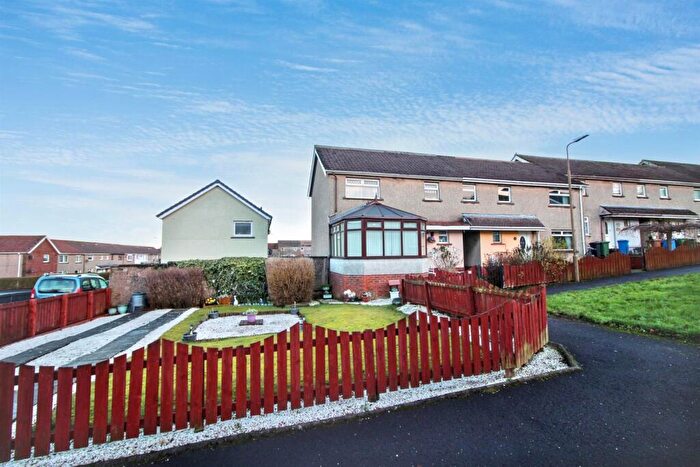
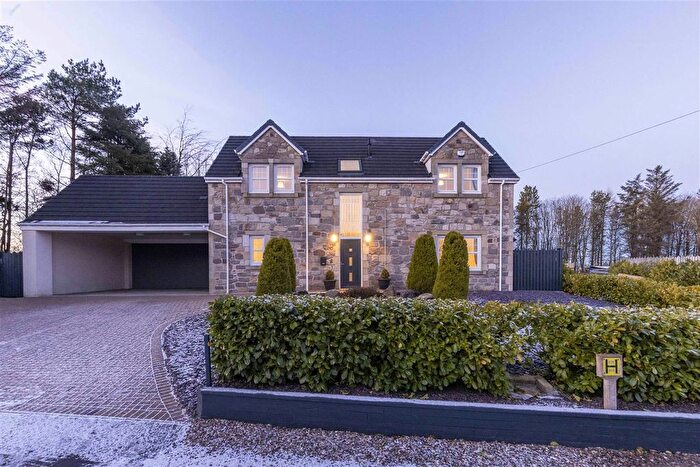
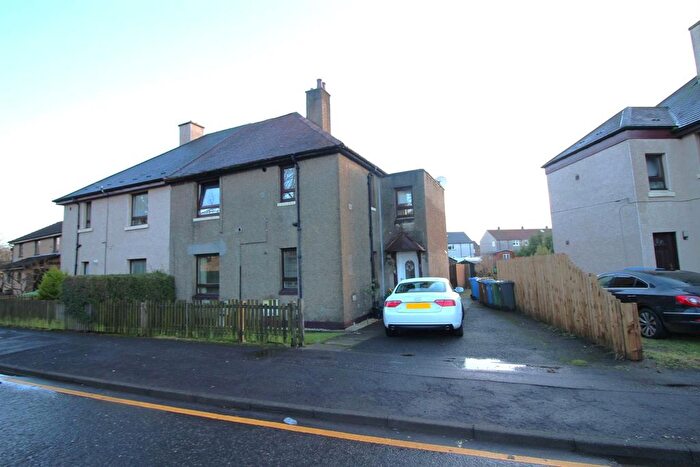
Properties for sale near EH47 0BZ, Kings Road
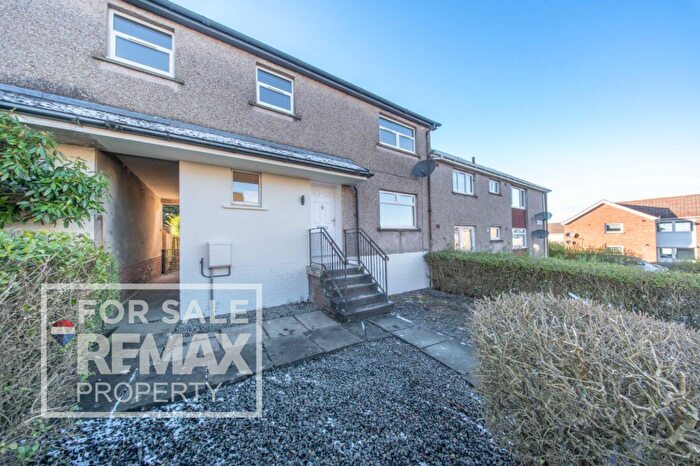
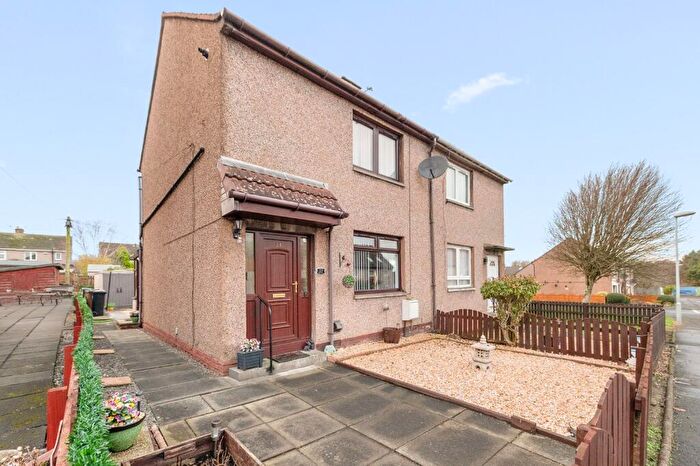
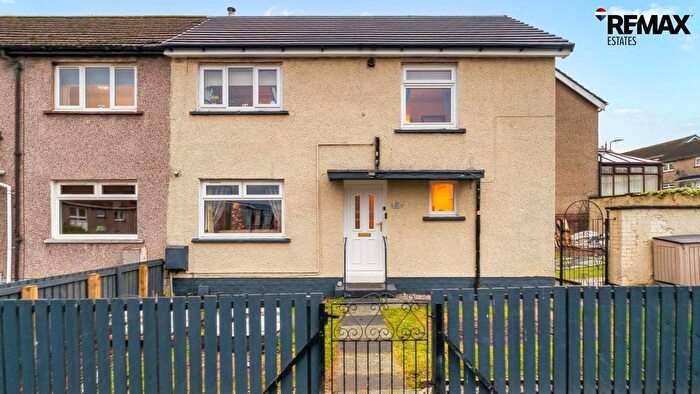
Previously listed properties near EH47 0BZ, Kings Road
![]()
If you are looking to sell your house, let it out, or receive a property valuation, an expert can help you.
Click the button below to get started.


Price Paid in Kings Road, EH47 0BZ, Whitburn and Blackburn
2 Kings Road, EH47 0BZ, Whitburn and Blackburn Bathgate
Property 2 has been sold 9 times. The last time it was sold was in 19/02/2025 and the sold price was £130,000.00.
This is a Property which was sold as a New Build in 19/02/2025
| Date | Price | Classification |
|---|---|---|
| 19/02/2025 | £130,000.00 | New Build |
| 14/09/2020 | £105,000.00 | Established Building |
| 08/11/2013 | £58,000.00 | Established Building |
| 03/08/2012 | £44,000.00 | Established Building |
| 07/01/2009 | £120,000.00 | Established Building |
| 06/03/2007 | £100,000.00 | New Build |
| 20/10/2006 | £82,000.00 | Established Building |
| 07/04/2006 | £76,000.00 | Established Building |
| 21/10/2004 | £72,500.00 | Established Building |
1 Kings Road, EH47 0BZ, Whitburn and Blackburn Bathgate
Property 1 has been sold 2 times. The last time it was sold was in 05/04/2007 and the sold price was £99,995.00.
This is a Property which was sold as an Established Building in 05/04/2007
| Date | Price | Classification |
|---|---|---|
| 05/04/2007 | £99,995.00 | Established Building |
| 14/05/2004 | £75,000.00 | Established Building |
Transport near EH47 0BZ, Kings Road

House price paid reports for EH47 0BZ, Kings Road
Click on the buttons below to see price paid reports by year or property price:
- Price Paid By Year
Property Price Paid in EH47 0BZ, Kings Road by Year
The average sold property price by year was:
| Year | Average Sold Price | Price Change |
Sold Properties
|
|---|---|---|---|
| 2025 | £130,000 | 19% |
1 Property |
| 2020 | £105,000 | 45% |
1 Property |
| 2013 | £58,000 | 24% |
1 Property |
| 2012 | £44,000 | -173% |
1 Property |
| 2009 | £120,000 | 17% |
1 Property |
| 2007 | £99,997 | 21% |
2 Properties |
| 2006 | £79,000 | 7% |
2 Properties |
| 2004 | £73,750 | - |
2 Properties |