
Houses for sale & to rent in EH47 0HS, Redmill View, Whitburn and Blackburn, Bathgate
House Prices in EH47 0HS, Redmill View, Whitburn and Blackburn
Properties in EH47 0HS have an average house price of £260k and had 1 Property Transaction within the last 3 years.¹ EH47 0HS is a postcode in Redmill View located in Whitburn and Blackburn, an area in Bathgate, West Lothian, with 4 households², where the most expensive property was sold for £260k.
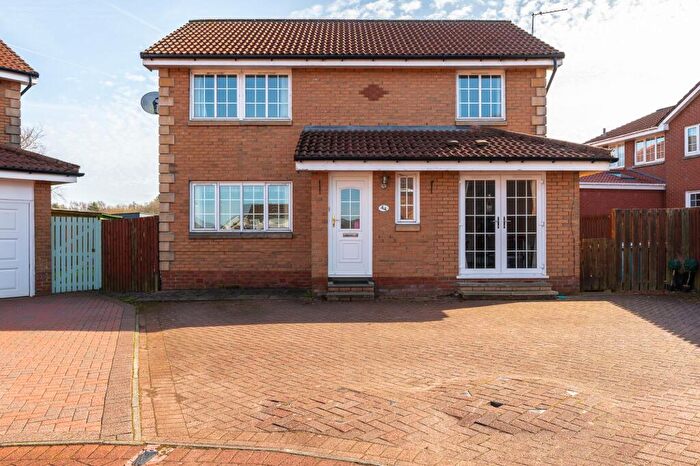
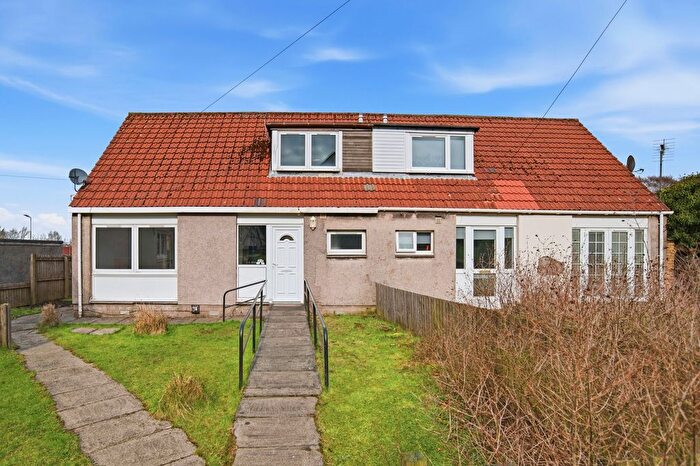
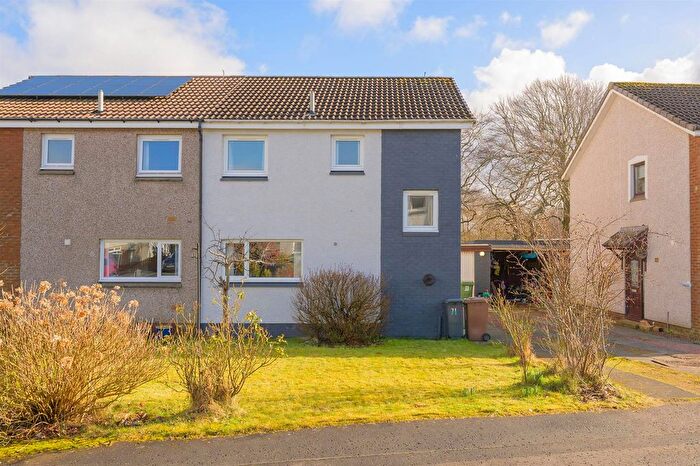
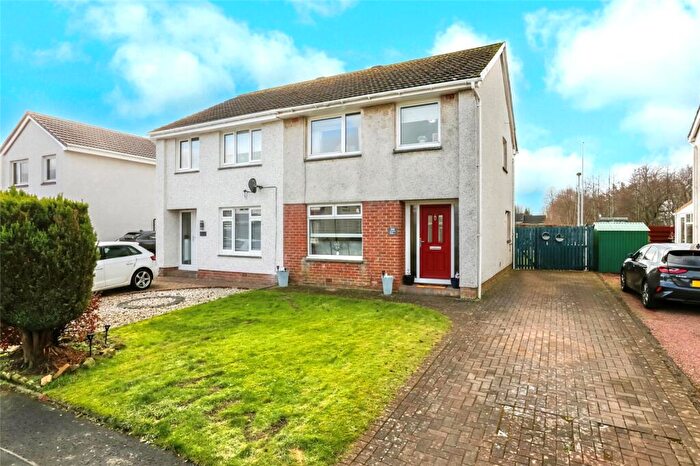
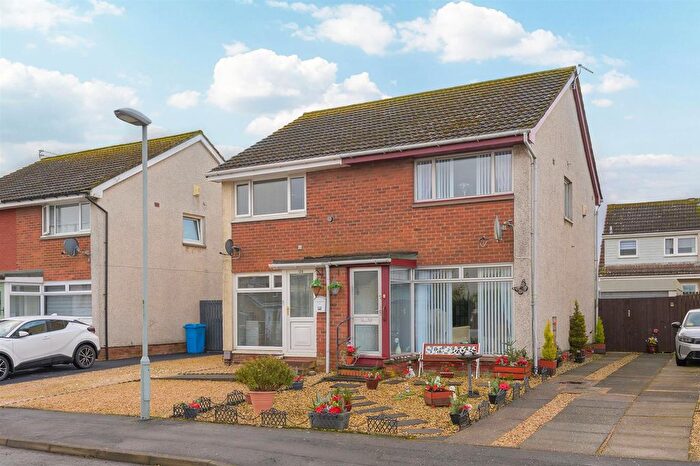
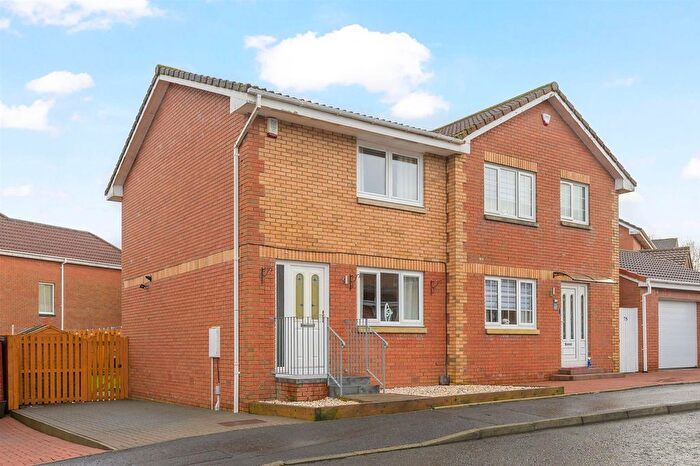
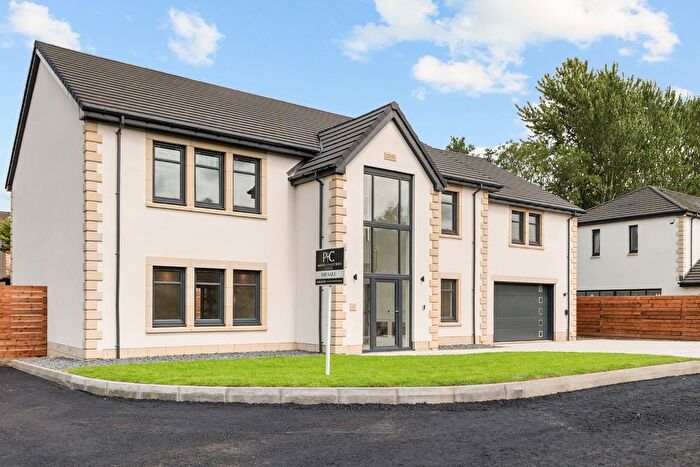
Properties for sale near EH47 0HS, Redmill View

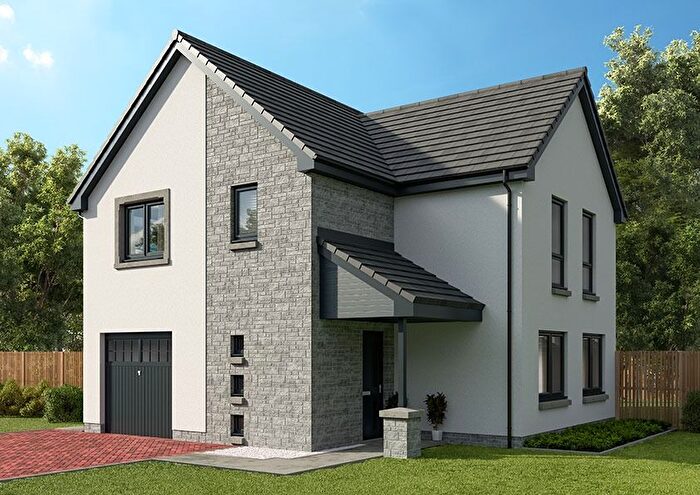
![]()
If you are looking to sell your house, let it out, or receive a property valuation, an expert can help you.
Click the button below to get started.
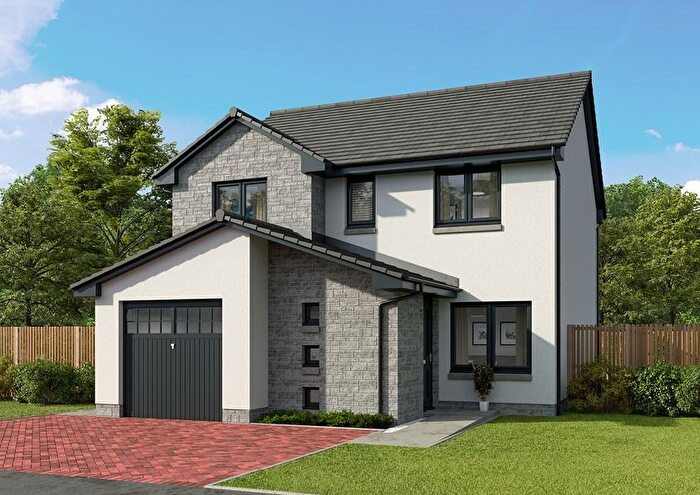
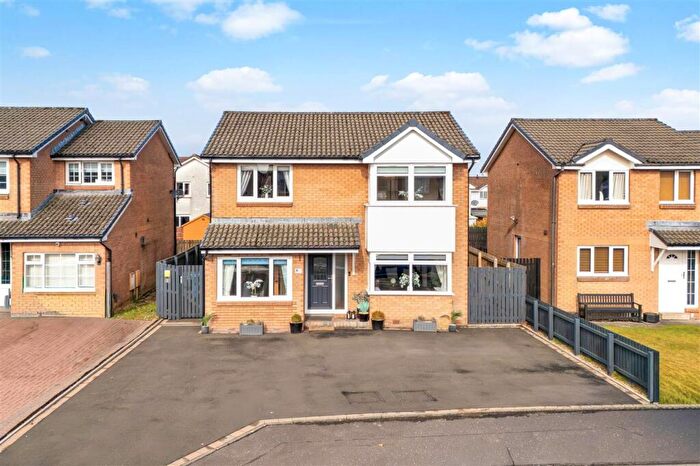
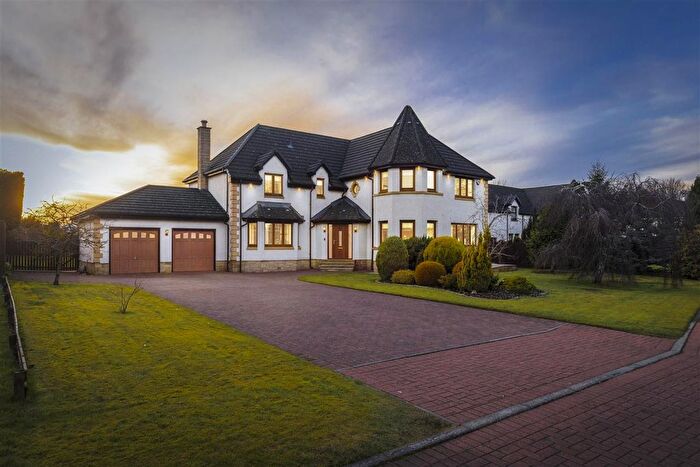
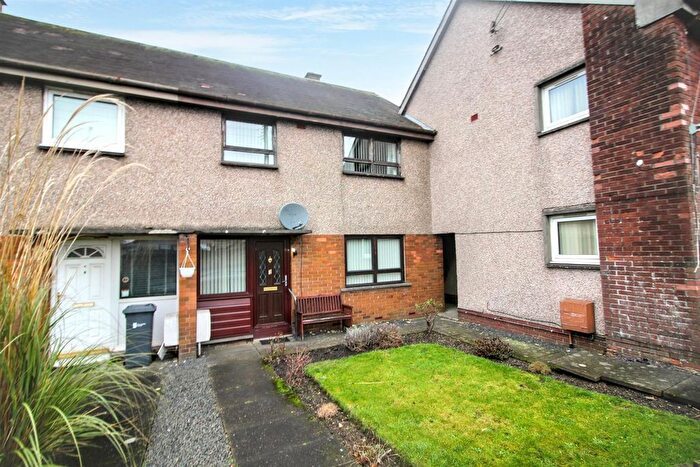
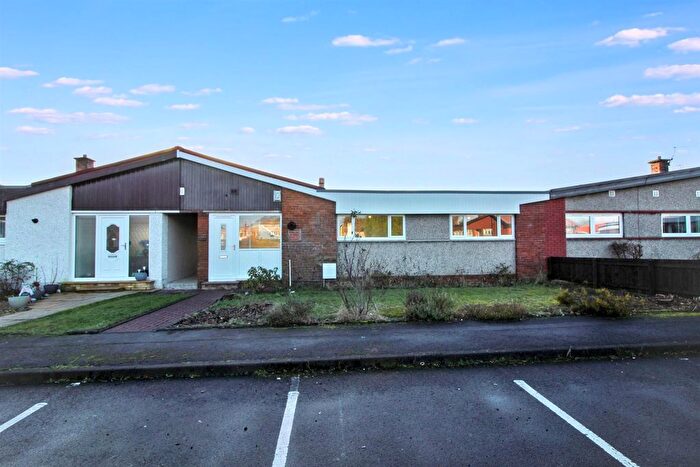
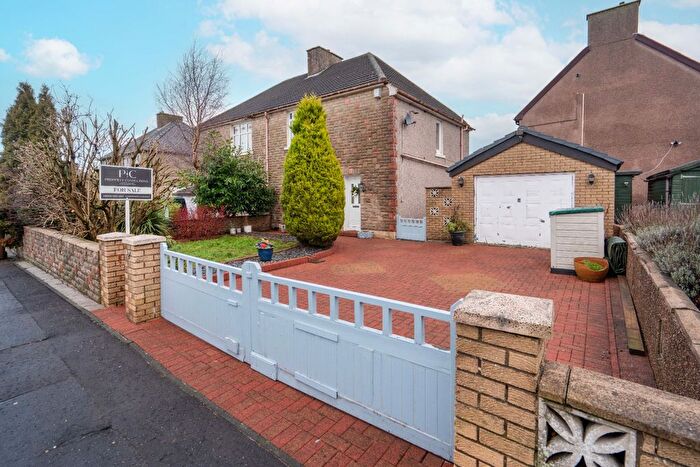
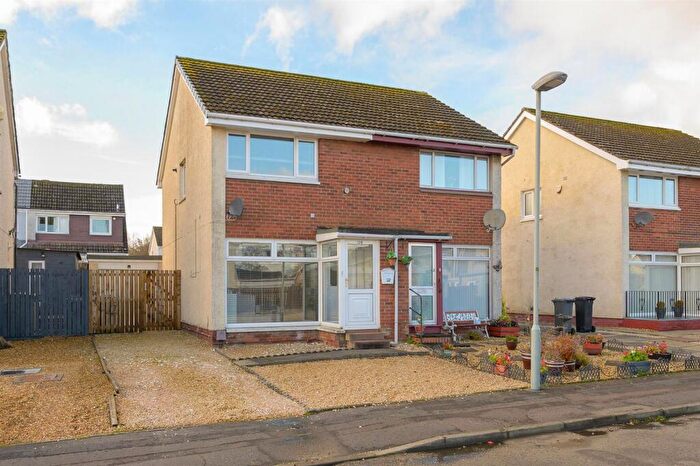
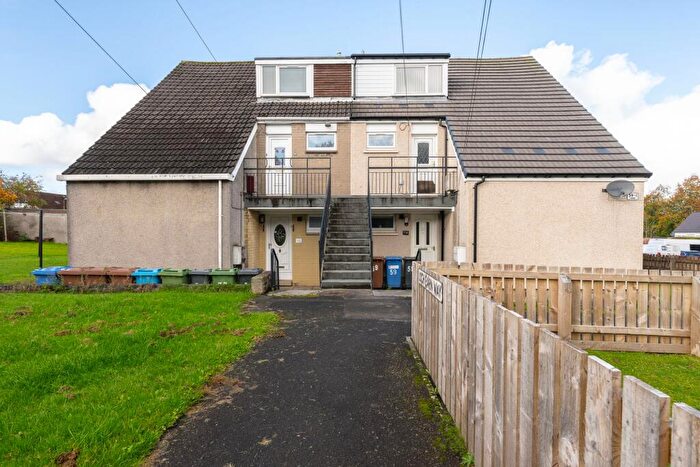
Previously listed properties near EH47 0HS, Redmill View

![]()
If you are looking to sell your house, let it out, or receive a property valuation, an expert can help you.
Click the button below to get started.

Price Paid in Redmill View, EH47 0HS, Whitburn and Blackburn
1 Redmill View, EH47 0HS, Whitburn and Blackburn Bathgate
Property 1 has been sold 4 times. The last time it was sold was in 24/06/2024 and the sold price was £260,000.00.
This is a Property which was sold as a New Build in 24/06/2024
| Date | Price | Classification |
|---|---|---|
| 24/06/2024 | £260,000.00 | New Build |
| 12/05/2009 | £47,000.00 | Established Building |
| 06/01/2005 | £60,000.00 | Established Building |
| 24/09/2004 | £118,000.00 | Established Building |
4 Redmill View, EH47 0HS, Whitburn and Blackburn Bathgate
Property 4 has been sold 1 time. The last time it was sold was in 27/04/2011 and the sold price was £153,000.00.
This is a Property which was sold as an Established Building in 27/04/2011
| Date | Price | Classification |
|---|---|---|
| 27/04/2011 | £153,000.00 | Established Building |
2 Redmill View, EH47 0HS, Whitburn and Blackburn Bathgate
Property 2 has been sold 1 time. The last time it was sold was in 19/07/2004 and the sold price was £105,000.00.
This is a Property which was sold as an Established Building in 19/07/2004
| Date | Price | Classification |
|---|---|---|
| 19/07/2004 | £105,000.00 | Established Building |
Transport near EH47 0HS, Redmill View

House price paid reports for EH47 0HS, Redmill View
Click on the buttons below to see price paid reports by year or property price:
- Price Paid By Year
Property Price Paid in EH47 0HS, Redmill View by Year
The average sold property price by year was:
| Year | Average Sold Price | Price Change |
Sold Properties
|
|---|---|---|---|
| 2024 | £260,000 | 41% |
1 Property |
| 2011 | £153,000 | 69% |
1 Property |
| 2009 | £47,000 | -28% |
1 Property |
| 2005 | £60,000 | -86% |
1 Property |
| 2004 | £111,500 | - |
2 Properties |