
Houses for sale & to rent in EH47 7QB, Redhouse Place, Whitburn and Blackburn, Bathgate
House Prices in EH47 7QB, Redhouse Place, Whitburn and Blackburn
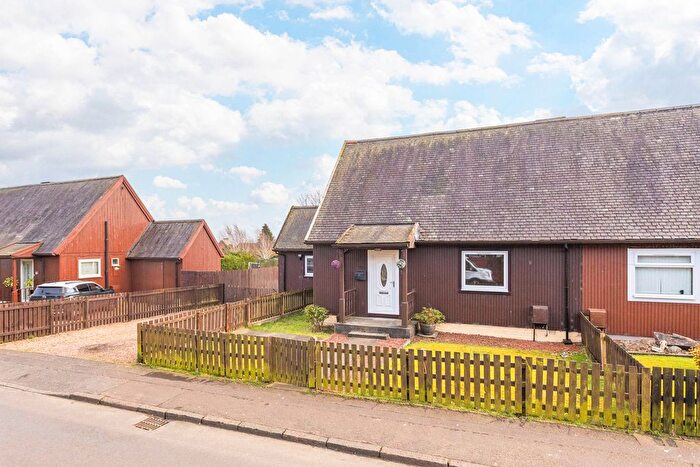
Properties in EH47 7QB have an average house price of £119k and had 2 Property Transactions within the last 3 years.¹ EH47 7QB is a postcode in Redhouse Place located in Whitburn and Blackburn, an area in Bathgate, West Lothian, with 8 households², where the most expensive property was sold for £125k.
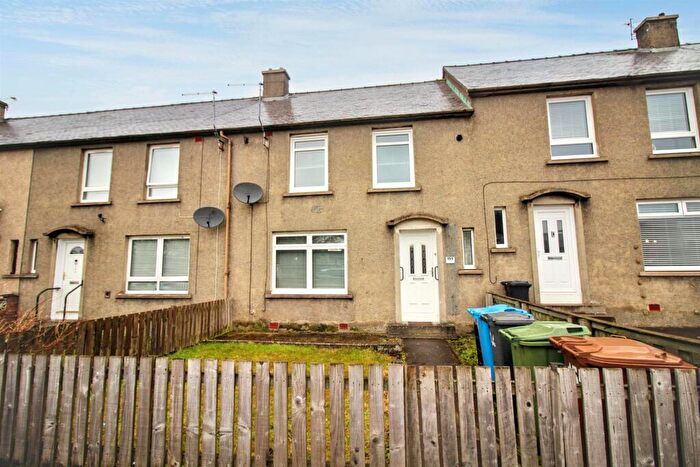
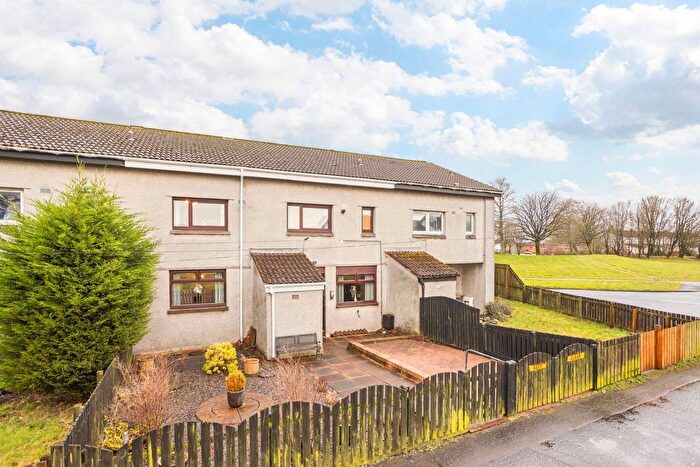
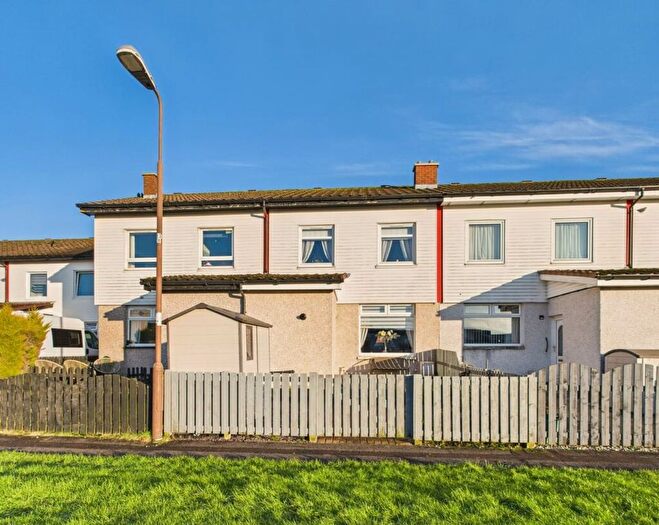
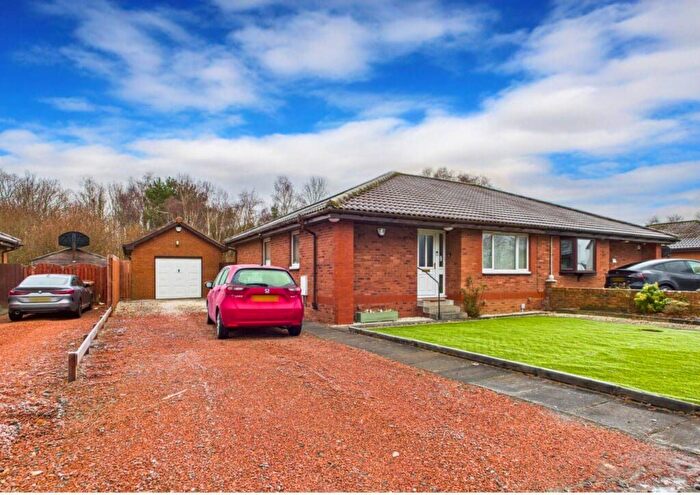
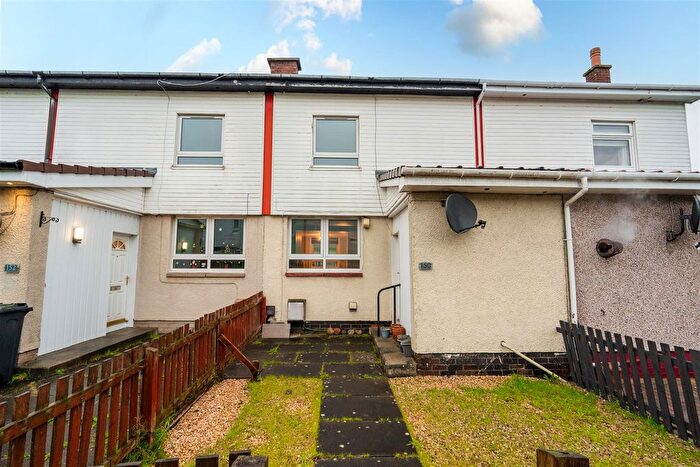
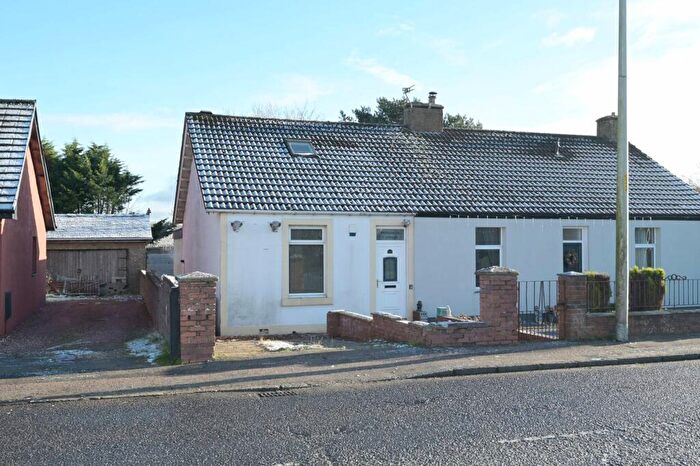
Properties for sale near EH47 7QB, Redhouse Place

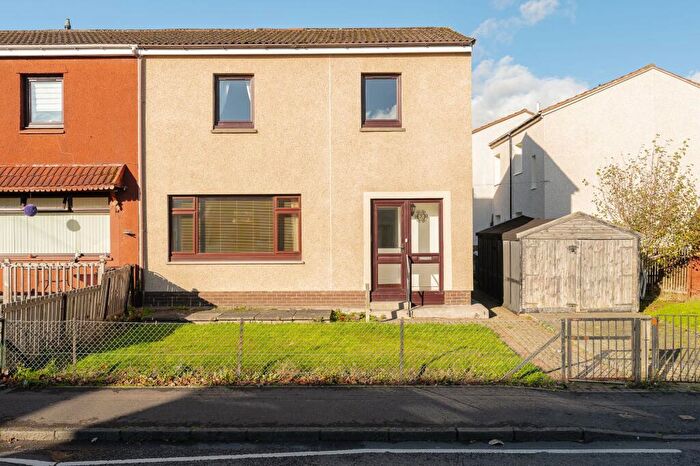
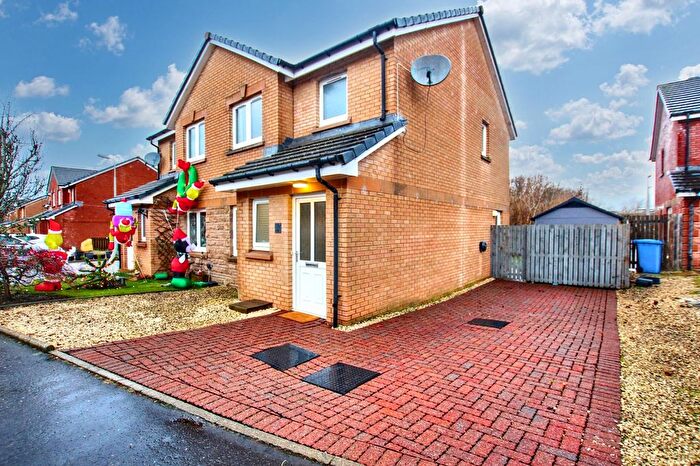
Previously listed properties near EH47 7QB, Redhouse Place
![]()
If you are looking to sell your house, let it out, or receive a property valuation, an expert can help you.
Click the button below to get started.


Price Paid in Redhouse Place, EH47 7QB, Whitburn and Blackburn
45 Redhouse Place, EH47 7QB, Whitburn and Blackburn Bathgate
Property 45 has been sold 4 times. The last time it was sold was in 17/04/2024 and the sold price was £113,000.00.
This is a Property which was sold as a New Build in 17/04/2024
| Date | Price | Classification |
|---|---|---|
| 17/04/2024 | £113,000.00 | New Build |
| 08/03/2018 | £80,000.00 | Established Building |
| 24/11/2010 | £40,000.00 | Established Building |
| 25/11/2002 | £11,800.00 | Established Building |
33 Redhouse Place, EH47 7QB, Whitburn and Blackburn Bathgate
Property 33 has been sold 3 times. The last time it was sold was in 23/10/2023 and the sold price was £125,000.00.
This is a Property which was sold as a New Build in 23/10/2023
| Date | Price | Classification |
|---|---|---|
| 23/10/2023 | £125,000.00 | New Build |
| 03/12/2007 | £97,000.00 | Established Building |
| 07/04/2006 | £67,000.00 | Established Building |
Postcodes in Redhouse Place, Whitburn and Blackburn
Navigate through other locations in Redhouse Place, Whitburn and Blackburn, Bathgate to see more property listings for sale or to rent.
Transport near EH47 7QB, Redhouse Place

House price paid reports for EH47 7QB, Redhouse Place
Click on the buttons below to see price paid reports by year or property price:
- Price Paid By Year
Property Price Paid in EH47 7QB, Redhouse Place by Year
The average sold property price by year was:
| Year | Average Sold Price | Price Change |
Sold Properties
|
|---|---|---|---|
| 2024 | £113,000 | -11% |
1 Property |
| 2023 | £125,000 | 36% |
1 Property |
| 2018 | £80,000 | 50% |
1 Property |
| 2010 | £40,000 | -143% |
1 Property |
| 2007 | £97,000 | 31% |
1 Property |
| 2006 | £67,000 | 82% |
1 Property |
| 2002 | £11,800 | - |
1 Property |