
Houses for sale & to rent in EH47 8NQ, Brucefield Drive, Whitburn and Blackburn, Bathgate
House Prices in EH47 8NQ, Brucefield Drive, Whitburn and Blackburn
Properties in EH47 8NQ have no sales history available within the last 3 years. EH47 8NQ is a postcode in Brucefield Drive located in Whitburn and Blackburn, an area in Bathgate, West Lothian, with 8 households².
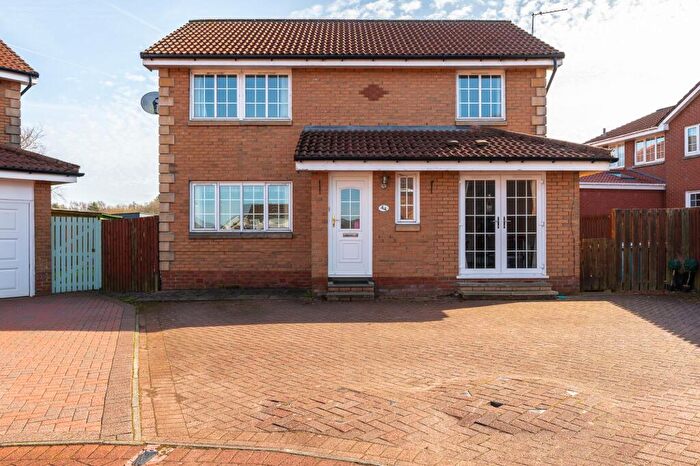
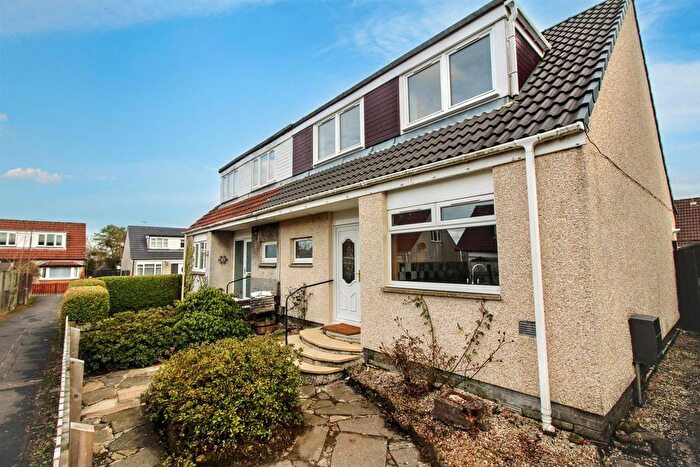
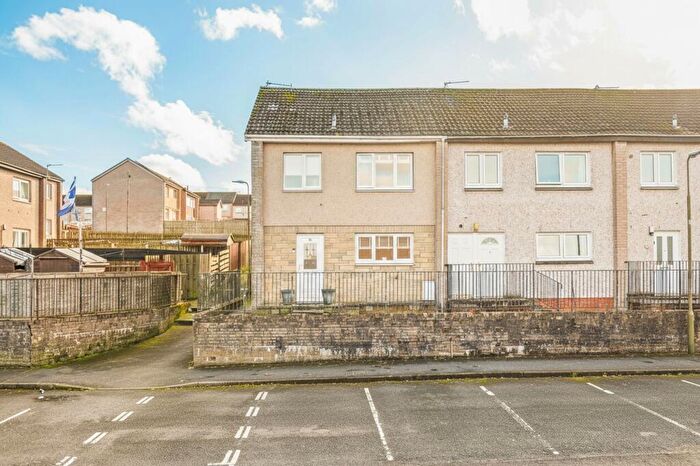
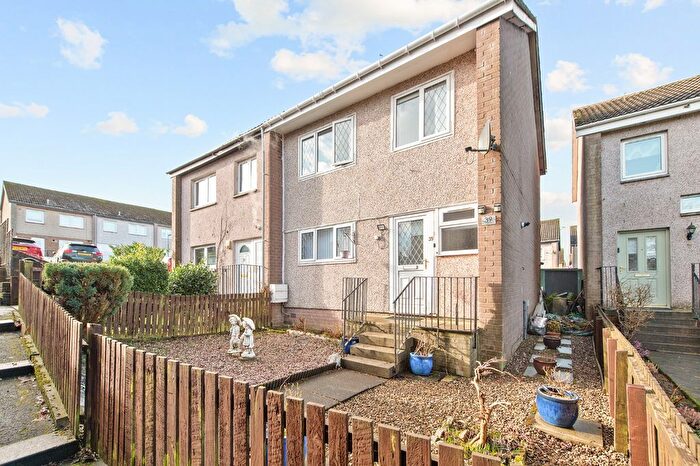
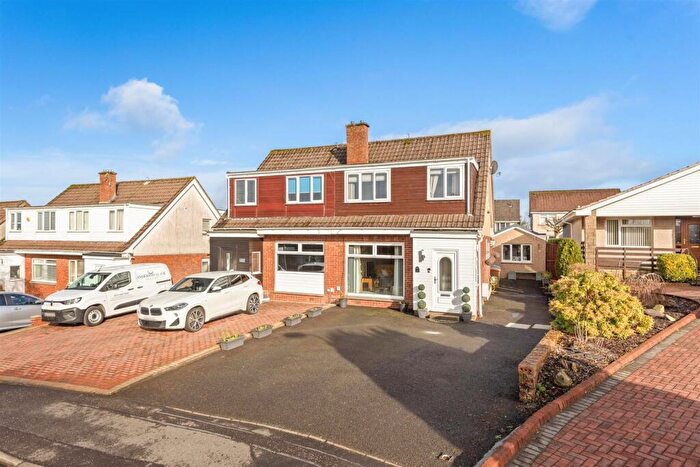
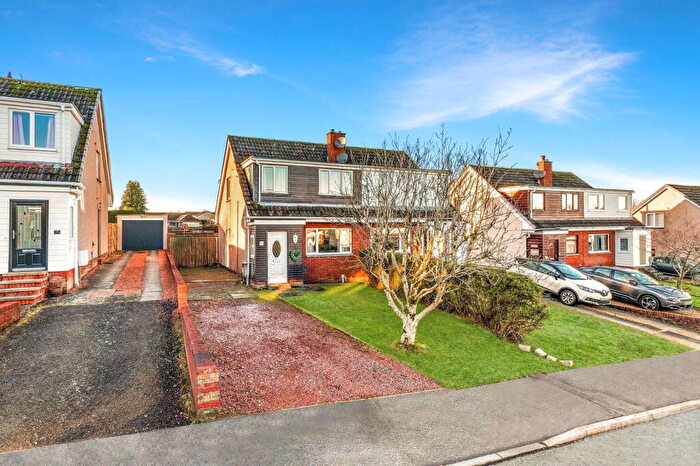
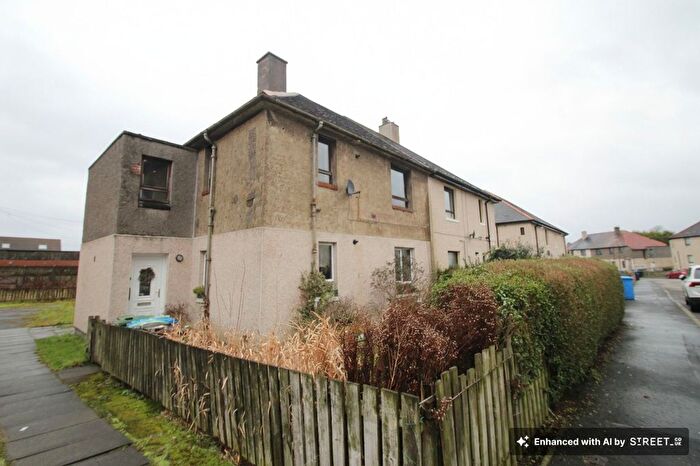
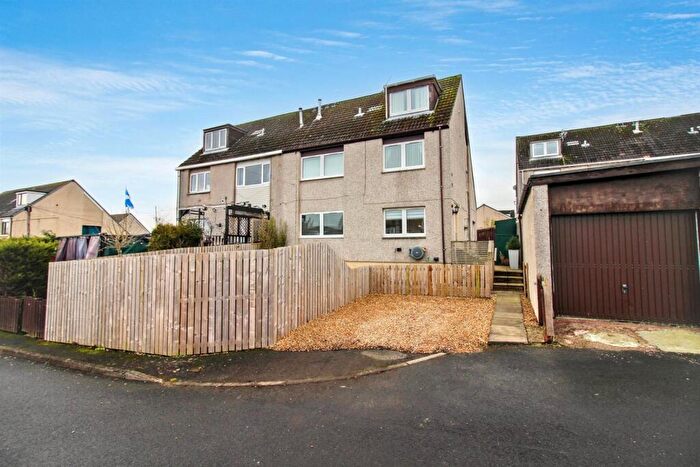
Properties for sale near EH47 8NQ, Brucefield Drive


![]()
If you are looking to sell your house, let it out, or receive a property valuation, an expert can help you.
Click the button below to get started.
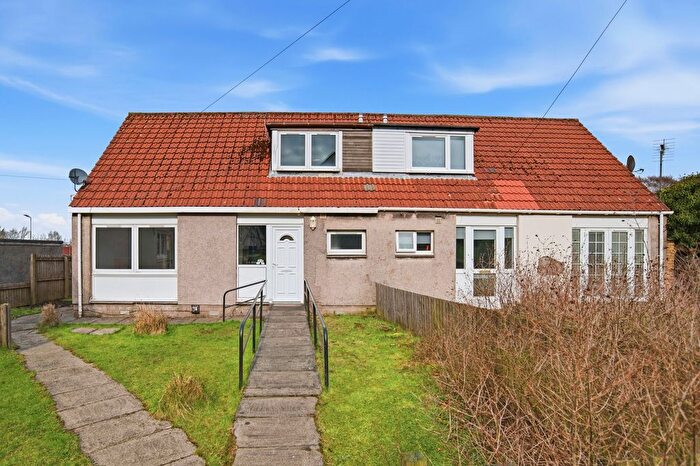
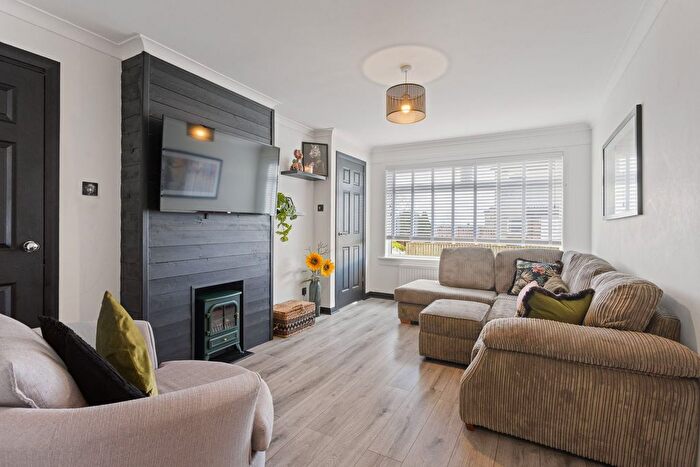
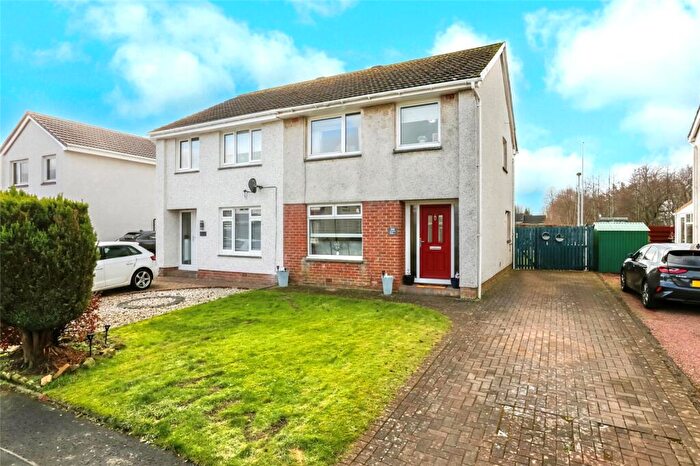
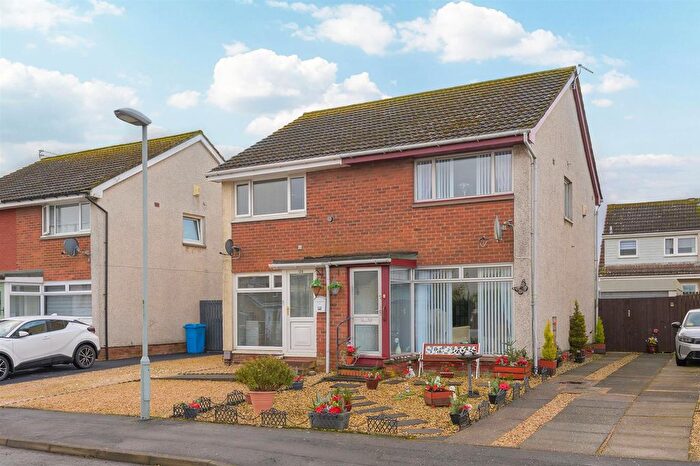
Previously listed properties near EH47 8NQ, Brucefield Drive
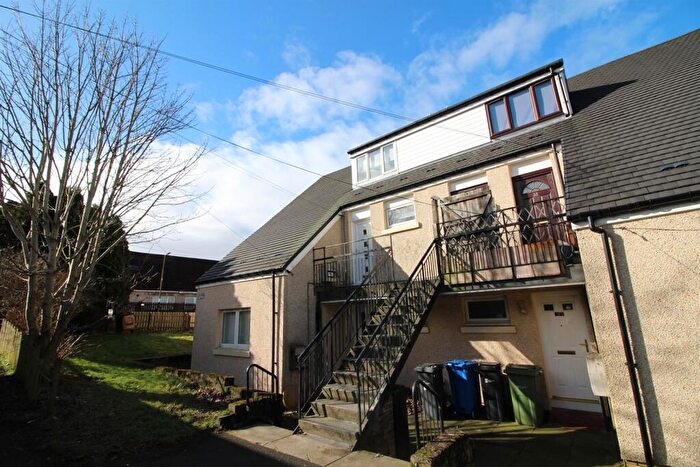
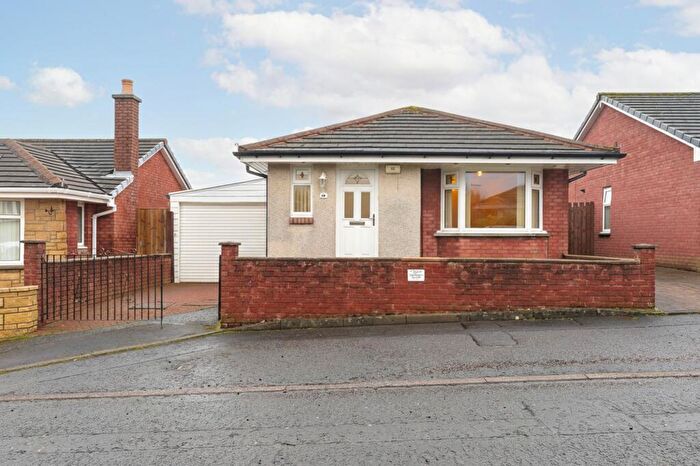
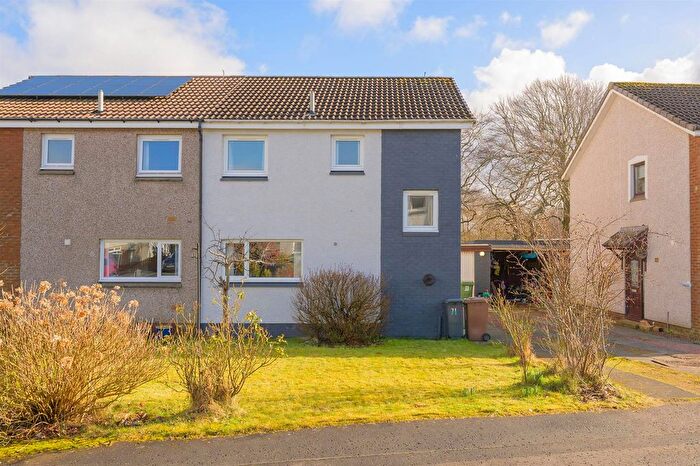
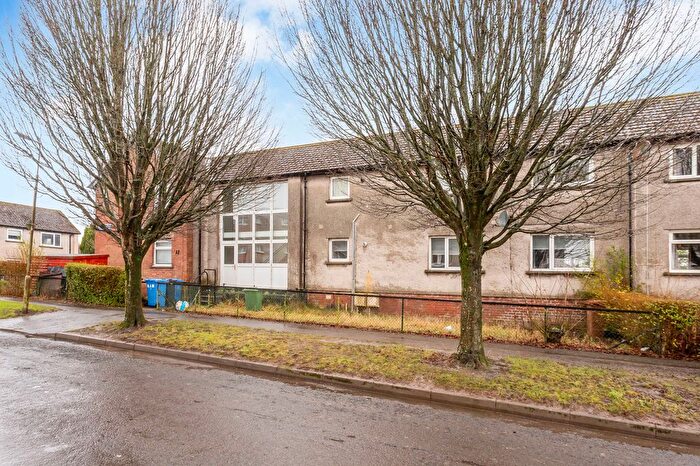
![]()
If you are looking to sell your house, let it out, or receive a property valuation, an expert can help you.
Click the button below to get started.

Price Paid in Brucefield Drive, EH47 8NQ, Whitburn and Blackburn
5 Brucefield Drive, EH47 8NQ, Whitburn and Blackburn Bathgate
Property 5 has been sold 2 times. The last time it was sold was in 20/12/2022 and the sold price was £130,000.00.
This is a Property which was sold as an Established Building in 20/12/2022
| Date | Price | Classification |
|---|---|---|
| 20/12/2022 | £130,000.00 | Established Building |
| 16/04/2003 | £9,960.00 | Established Building |
6 Brucefield Drive, EH47 8NQ, Whitburn and Blackburn Bathgate
Property 6 has been sold 1 time. The last time it was sold was in 03/11/2016 and the sold price was £100,000.00.
This is a Property which was sold as an Established Building in 03/11/2016
| Date | Price | Classification |
|---|---|---|
| 03/11/2016 | £100,000.00 | Established Building |
3 Brucefield Drive, EH47 8NQ, Whitburn and Blackburn Bathgate
Property 3 has been sold 1 time. The last time it was sold was in 15/08/2008 and the sold price was £12,072.00.
This is a Property which was sold as an Established Building in 15/08/2008
| Date | Price | Classification |
|---|---|---|
| 15/08/2008 | £12,072.00 | Established Building |
Transport near EH47 8NQ, Brucefield Drive

House price paid reports for EH47 8NQ, Brucefield Drive
Click on the buttons below to see price paid reports by year or property price:
- Price Paid By Year
Property Price Paid in EH47 8NQ, Brucefield Drive by Year
The average sold property price by year was:
| Year | Average Sold Price | Price Change |
Sold Properties
|
|---|---|---|---|
| 2022 | £130,000 | 23% |
1 Property |
| 2016 | £100,000 | 88% |
1 Property |
| 2008 | £12,072 | 17% |
1 Property |
| 2003 | £9,960 | - |
1 Property |