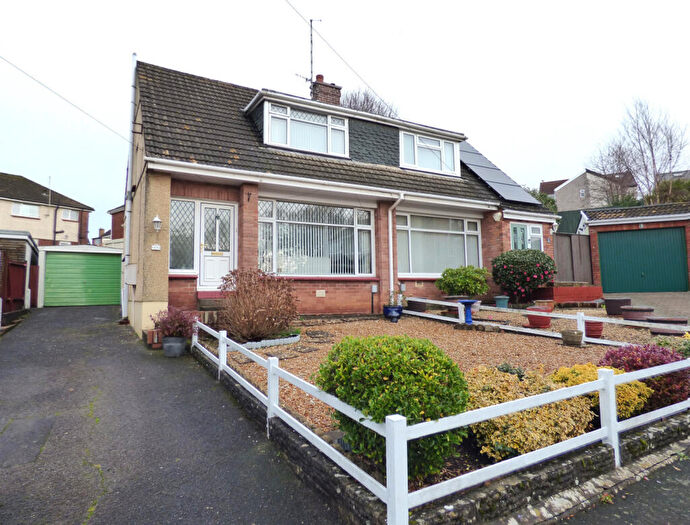
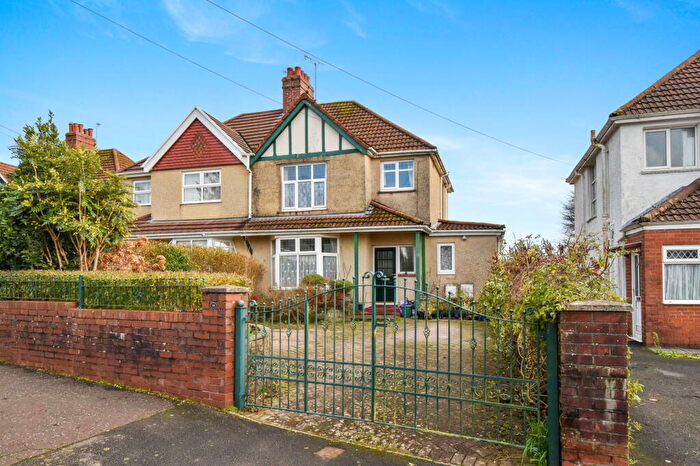
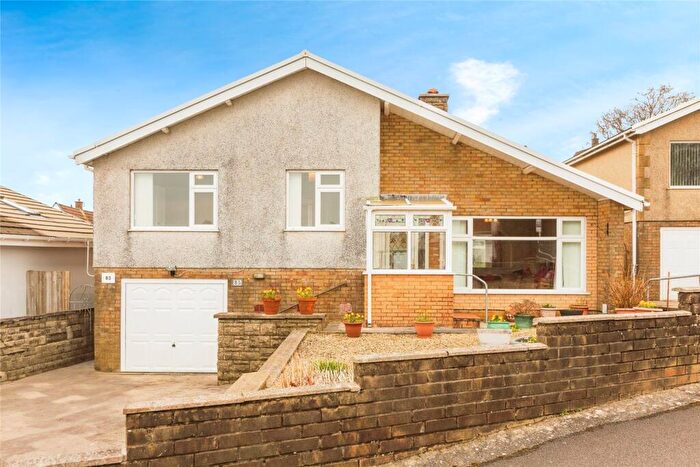
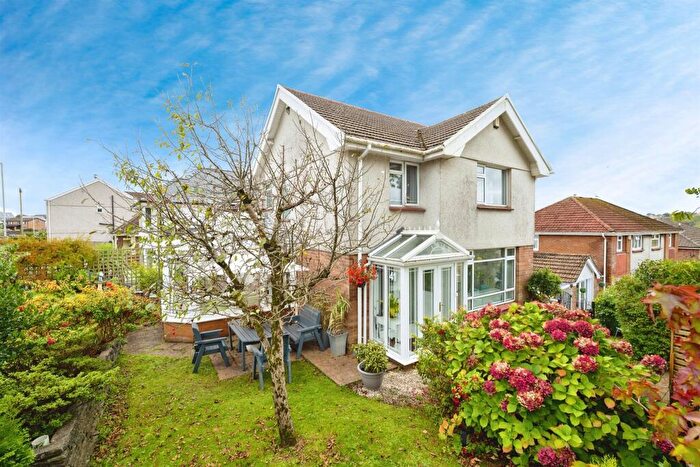
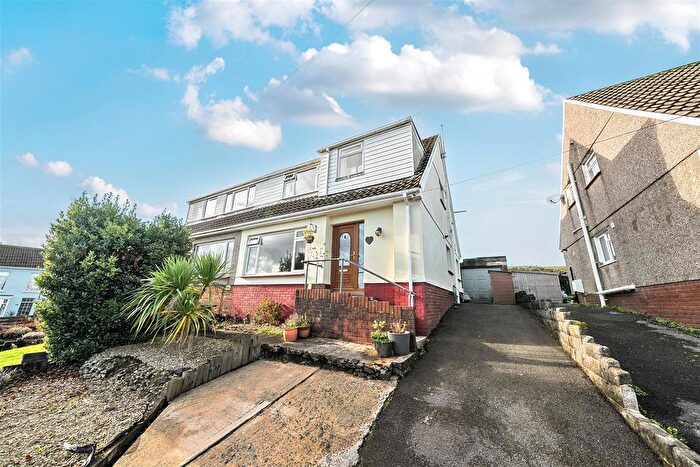
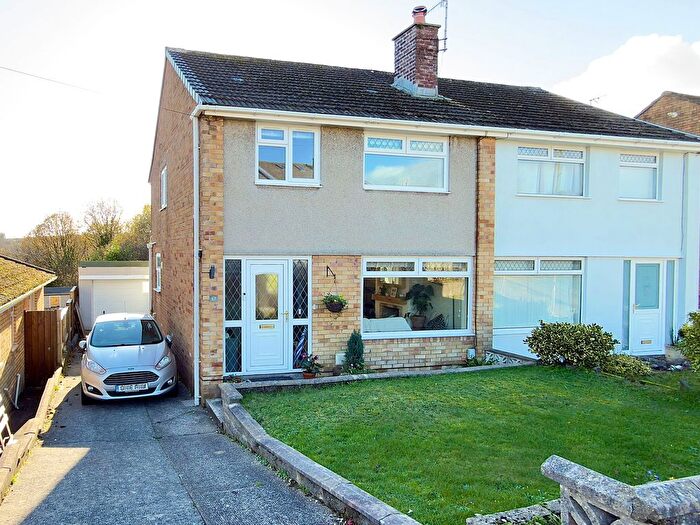
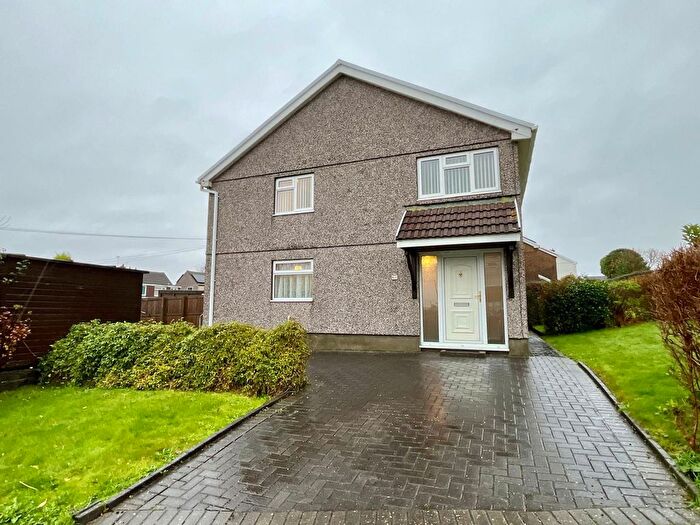
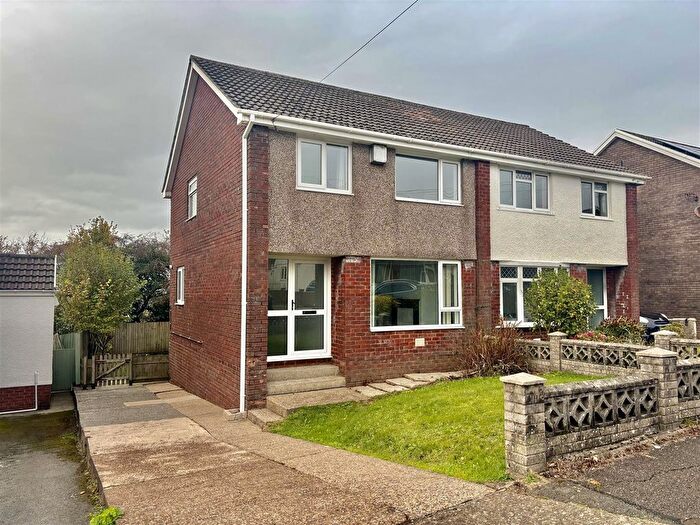
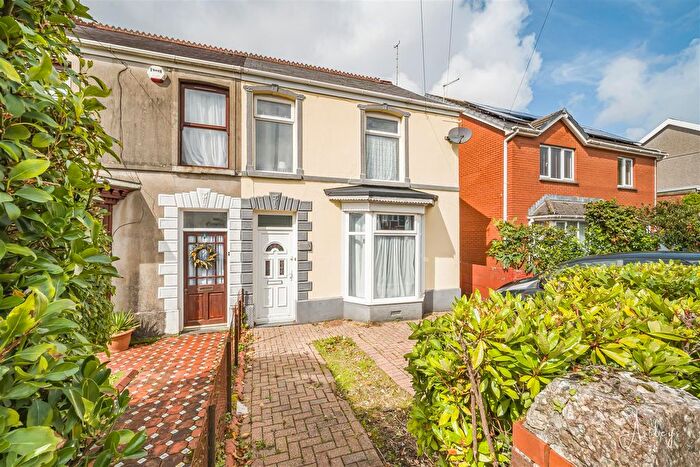
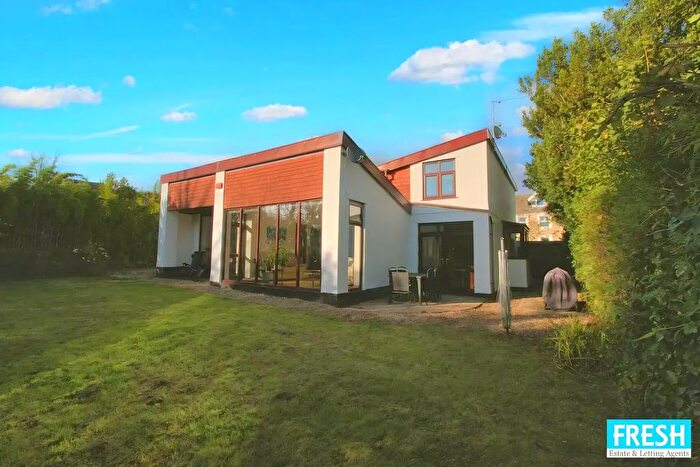
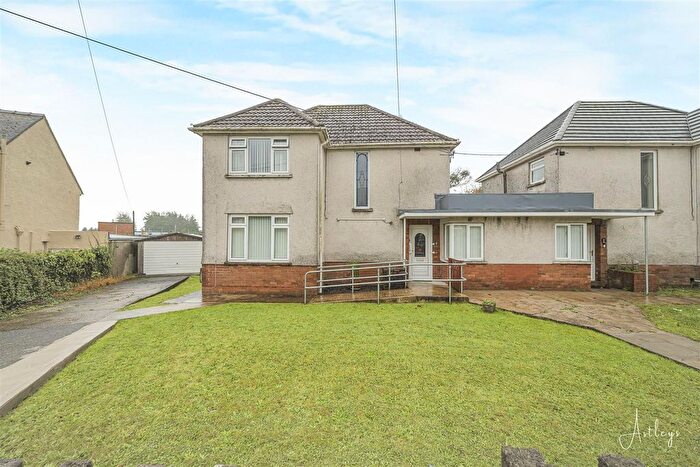
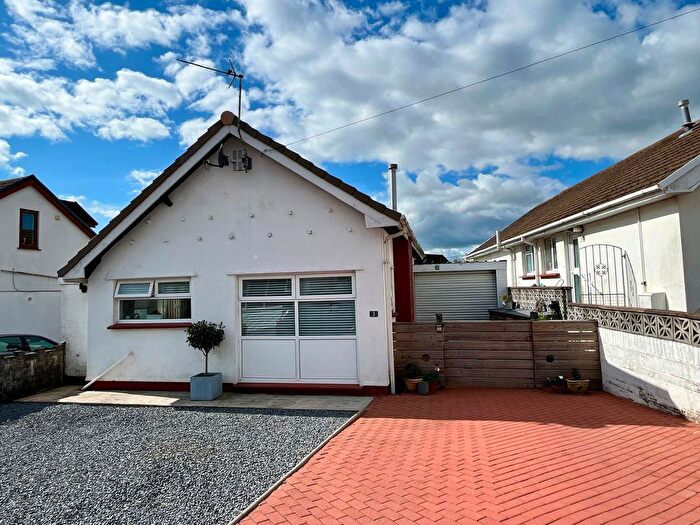
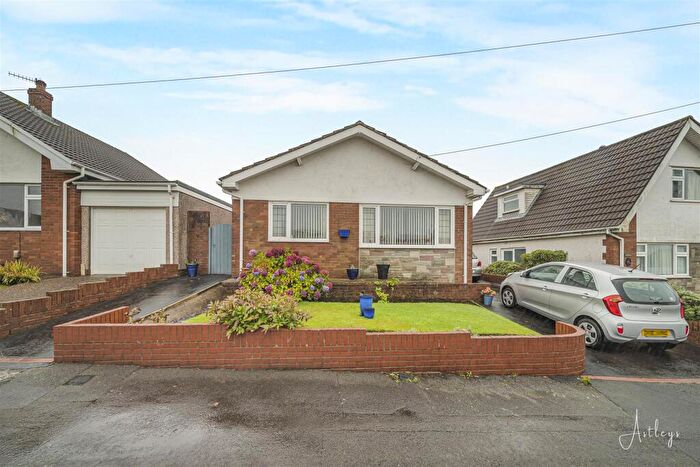
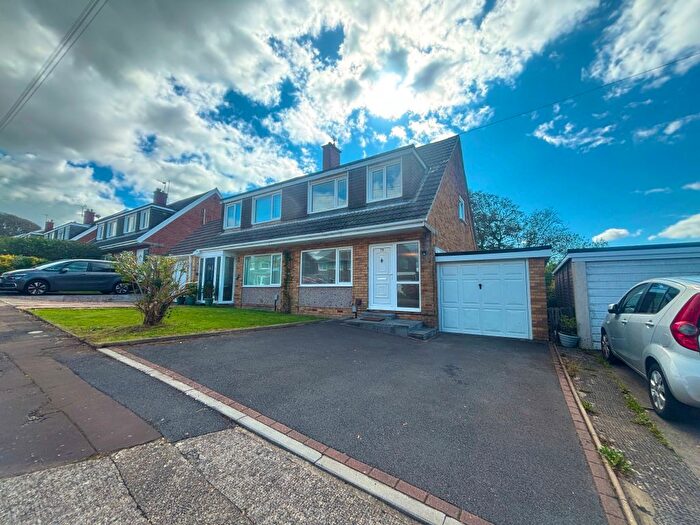
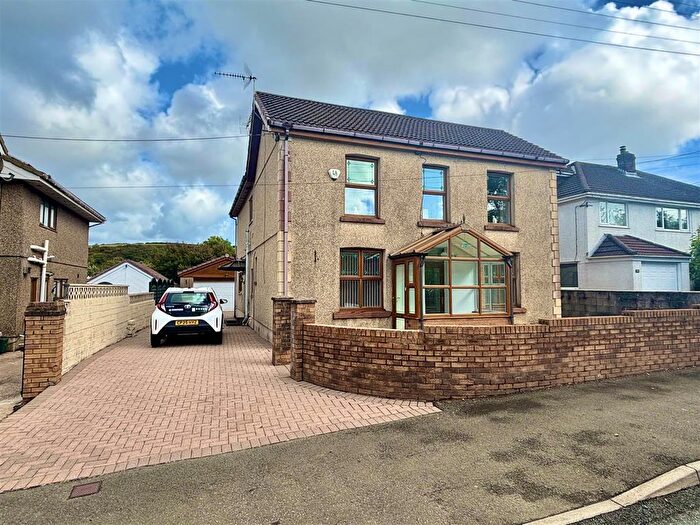
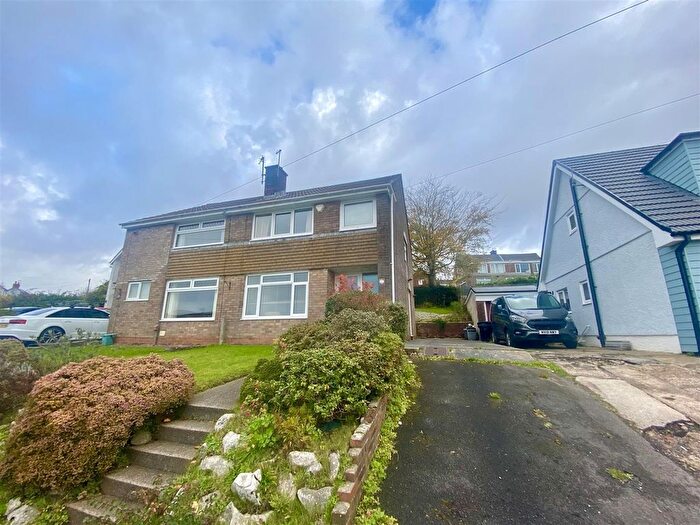
Houses for sale & to rent in Dunvant, Swansea
House Prices in Dunvant
Properties in Dunvant have an average house price of £239,504.00 and had 214 Property Transactions within the last 3 years¹.
Dunvant is an area in Swansea, Abertawe - Swansea with 1,863 households², where the most expensive property was sold for £542,500.00.
Properties for sale in Dunvant
Previously listed properties in Dunvant
Roads and Postcodes in Dunvant
Navigate through our locations to find the location of your next house in Dunvant, Swansea for sale or to rent.
| Streets | Postcodes |
|---|---|
| Bro Dawel | SA2 7RN |
| Bro Dedwydd | SA2 7PR |
| Bro Dirion | SA2 7QB |
| Broadmead | SA2 7RB |
| Brooklands Close | SA2 7TS |
| Brynaeron | SA2 7UX |
| Brynaeron Court | SA2 7XB |
| Bryndolau | SA2 7TQ |
| Cae Crwn | SA2 7PS |
| Cefn Celyn | SA2 7TU |
| Curry Close | SA2 7PJ SA2 7PL |
| Cwmyrwch | SA2 7TE |
| Cyncoed Close | SA2 7RS |
| Ddol Cottages | SA2 7UE |
| Ddol Road | SA2 7UB |
| Derlwyn | SA2 7PE SA2 7PF SA2 7PN SA2 7QA SA2 7QE |
| Dolycoed | SA2 7UG SA2 7UQ |
| Dunvant Park Houses | SA2 7SH |
| Dunvant Road | SA2 7SJ SA2 7SL SA2 7SR SA2 7SS SA2 7ST SA2 7SN |
| Dunvant Square | SA2 7TA |
| Fairwood Road | SA2 7UL |
| Garrod Avenue | SA2 7XQ |
| Glan Dulais | SA2 7RT |
| Goetre Bellaf Road | SA2 7RL SA2 7RP |
| Goetre Fawr Road | SA2 7QU |
| Graig Y Bwldan | SA2 7NY |
| Gwelfor | SA2 7NX SA2 7QH SA2 7QJ |
| Hendre | SA2 7PP |
| Hendrefoilan Road | SA2 7NU |
| Heol Brython | SA2 7UW |
| Highland Terrace | SA2 7SU |
| Howells Road | SA2 7RR SA2 7SX |
| Killan Road | SA2 7TD SA2 7TH SA2 7US SA2 7TG |
| Llanerch Road | SA2 7SP |
| Llys Teg | SA2 7QQ |
| Lon Killan | SA2 7BH |
| Maes Yr Efail | SA2 7PY |
| Meadow View | SA2 7UZ |
| Pen Y Fro | SA2 7TJ SA2 7TP SA2 7TR SA2 7TF |
| Pen Y Fro Close | SA2 7TT |
| Penallt | SA2 7PH |
| Pencoed | SA2 7PQ |
| Plas Newydd | SA2 7UN |
| Priors Crescent | SA2 7UP SA2 7UF |
| Priors Way | SA2 7UH SA2 7UJ |
| Rhiwlas | SA2 7PW |
| The Mead | SA2 7SA |
| Voylart Close | SA2 7TZ |
| Voylart Road | SA2 7UA |
| Walters Row | SA2 7TB |
| Wellfield | SA2 7NZ |
| Y Berllan | SA2 7RW |
| Y Glyn | SA2 7RQ |
| Y Gorlan | SA2 7RH |
| Yr Aran | SA2 7PU SA2 7PX |
| Yr Elain | SA2 7PT |
| SA2 7QD SA2 7UD SA2 7UU SA2 7QX SA2 7UT SA2 7XD |
Transport near Dunvant
- FAQ
- Price Paid By Year
- Property Type Price
Frequently asked questions about Dunvant
What is the average price for a property for sale in Dunvant?
The average price for a property for sale in Dunvant is £239,504. This amount is 10% higher than the average price in Swansea. There are 481 property listings for sale in Dunvant.
What streets have the most expensive properties for sale in Dunvant?
The streets with the most expensive properties for sale in Dunvant are Voylart Road at an average of £349,583, Garrod Avenue at an average of £335,000 and Ddol Road at an average of £316,000.
What streets have the most affordable properties for sale in Dunvant?
The streets with the most affordable properties for sale in Dunvant are Ddol Cottages at an average of £120,000, Cefn Celyn at an average of £146,666 and Llys Teg at an average of £180,000.
Which train stations are available in or near Dunvant?
Some of the train stations available in or near Dunvant are Gowerton, Swansea and Bynea.
Property Price Paid in Dunvant by Year
The average sold property price by year was:
| Year | Average Sold Price | Price Change |
Sold Properties
|
|---|---|---|---|
| 2025 | £239,315 | 4% |
41 Properties |
| 2024 | £228,703 | -4% |
54 Properties |
| 2023 | £238,441 | -4% |
52 Properties |
| 2022 | £249,150 | 16% |
67 Properties |
| 2021 | £209,798 | 13% |
67 Properties |
| 2020 | £182,090 | -6% |
58 Properties |
| 2019 | £192,629 | 14% |
66 Properties |
| 2018 | £166,090 | 3% |
75 Properties |
| 2017 | £160,553 | -4% |
76 Properties |
| 2016 | £166,379 | 8% |
59 Properties |
| 2015 | £153,128 | -2% |
58 Properties |
| 2014 | £156,426 | 0,4% |
49 Properties |
| 2013 | £155,803 | 11% |
43 Properties |
| 2012 | £138,347 | -12% |
45 Properties |
| 2011 | £155,437 | 11% |
44 Properties |
| 2010 | £138,165 | -26% |
36 Properties |
| 2009 | £173,741 | 23% |
31 Properties |
| 2008 | £133,465 | -17% |
34 Properties |
| 2007 | £155,999 | -5% |
79 Properties |
| 2006 | £163,280 | 7% |
97 Properties |
| 2005 | £151,903 | 12% |
52 Properties |
| 2004 | £133,695 | 20% |
50 Properties |
| 2003 | £107,029 | 25% |
72 Properties |
| 2002 | £80,588 | 3% |
63 Properties |
| 2001 | £77,899 | 10% |
64 Properties |
| 2000 | £69,759 | 17% |
69 Properties |
| 1999 | £58,156 | 0,2% |
86 Properties |
| 1998 | £58,034 | 6% |
73 Properties |
| 1997 | £54,554 | 2% |
92 Properties |
| 1996 | £53,475 | 1% |
74 Properties |
| 1995 | £52,859 | - |
52 Properties |
Property Price per Property Type in Dunvant
Here you can find historic sold price data in order to help with your property search.
The average Property Paid Price for specific property types in the last three years are:
| Property Type | Average Sold Price | Sold Properties |
|---|---|---|
| Semi Detached House | £231,077.00 | 124 Semi Detached Houses |
| Detached House | £290,296.00 | 52 Detached Houses |
| Terraced House | £197,498.00 | 38 Terraced Houses |

