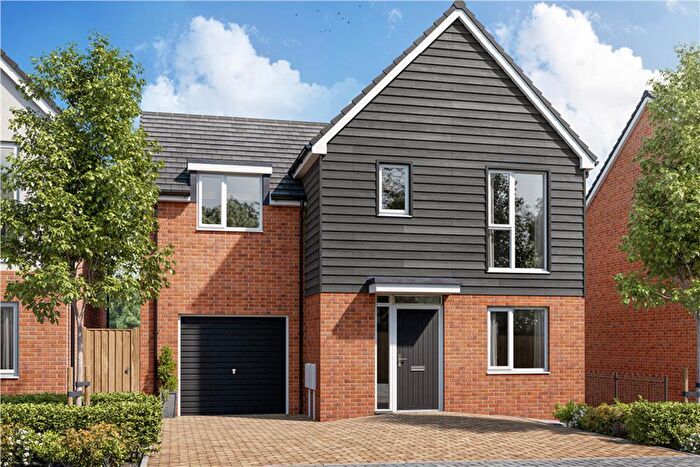
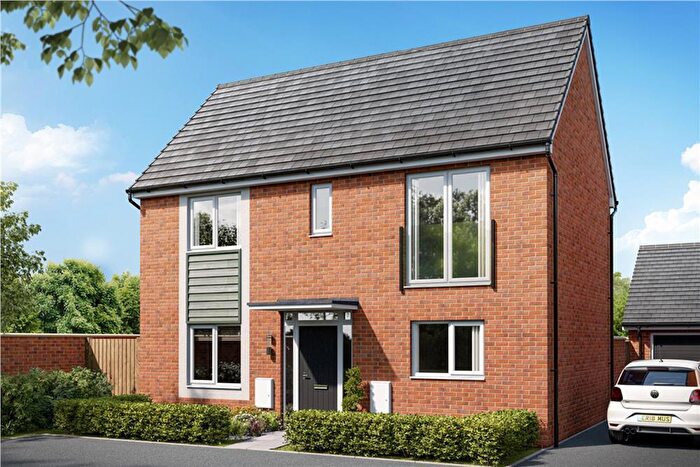
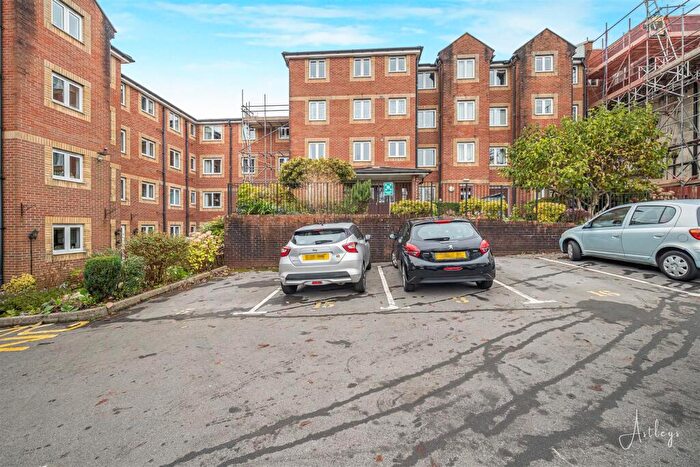
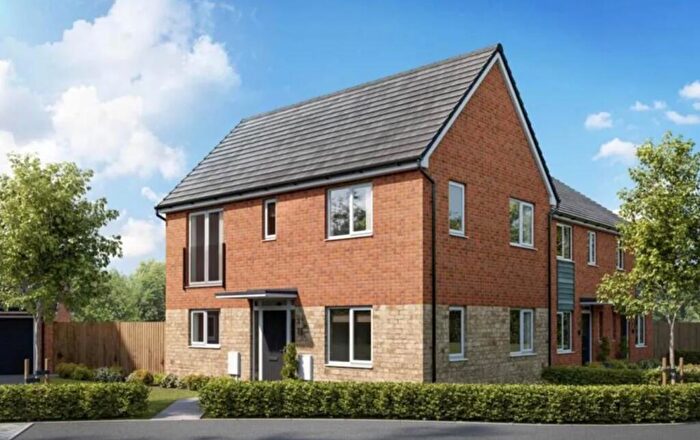
Houses for sale & to rent in Killay North, Swansea
House Prices in Killay North
Properties in Killay North have an average house price of £335,488.00 and had 153 Property Transactions within the last 3 years¹.
Killay North is an area in Swansea, Abertawe - Swansea with 964 households², where the most expensive property was sold for £1,850,000.00.
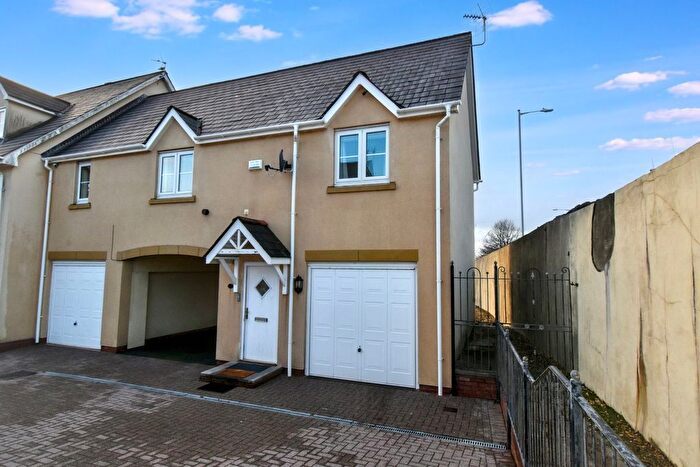
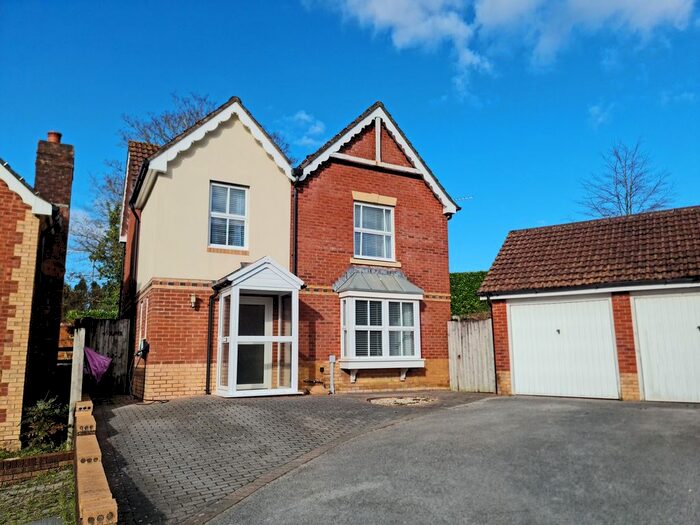
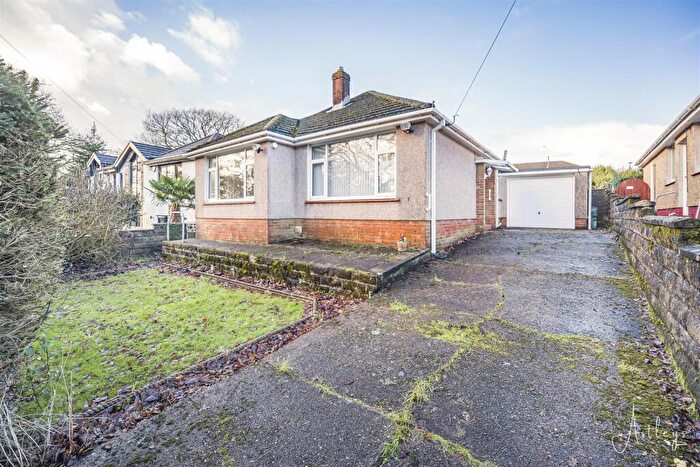
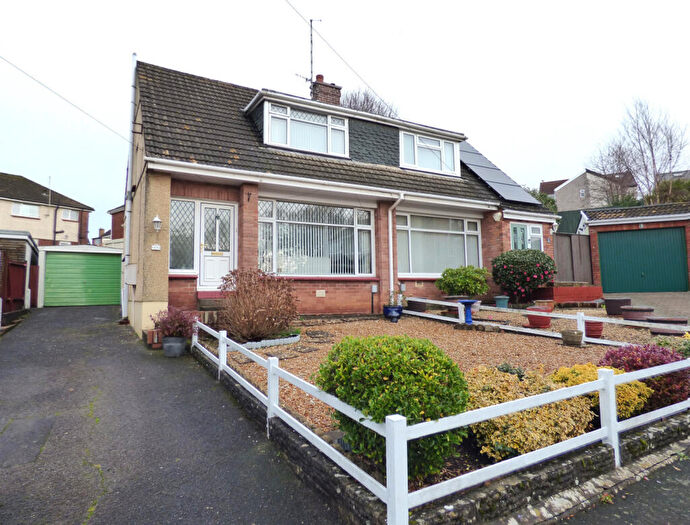
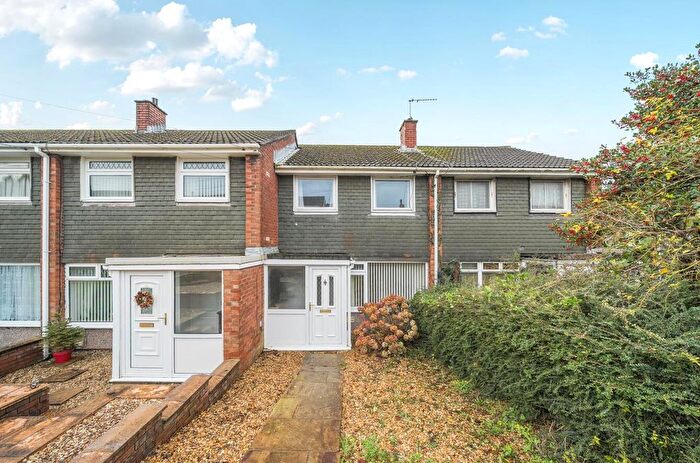
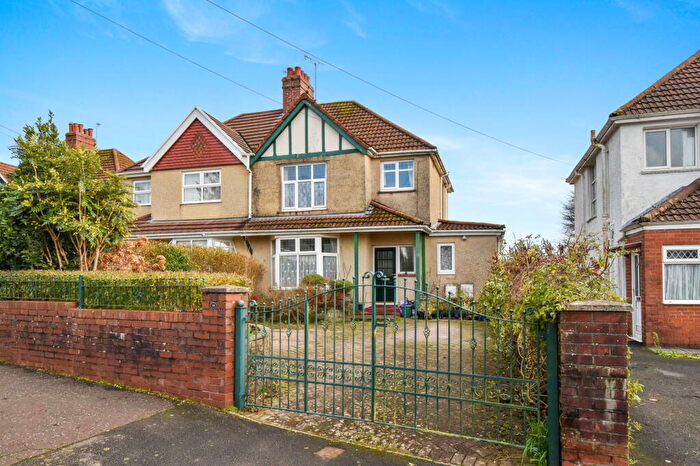
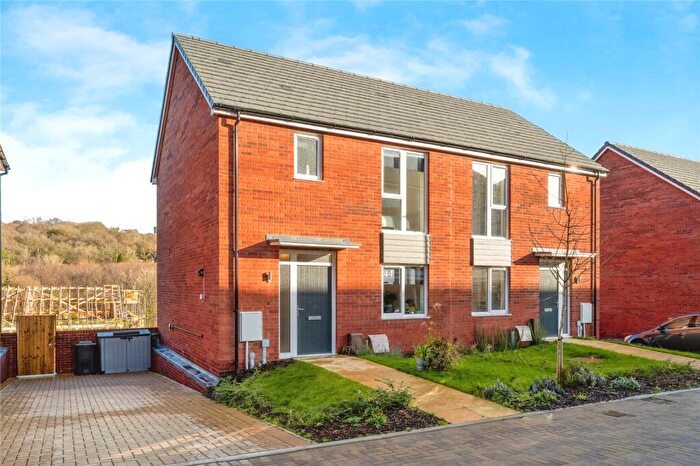
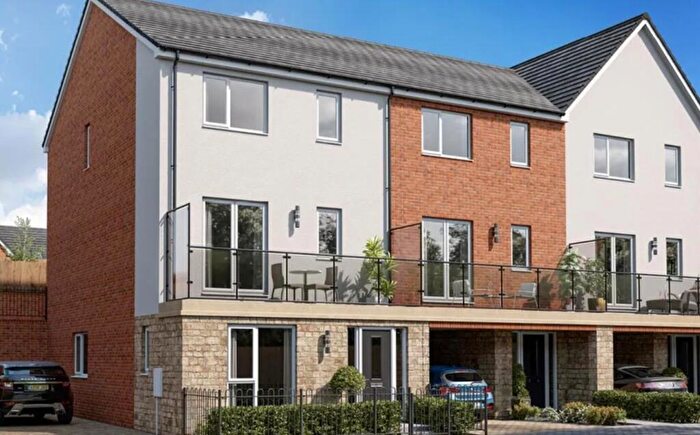
Properties for sale in Killay North
Roads and Postcodes in Killay North
Navigate through our locations to find the location of your next house in Killay North, Swansea for sale or to rent.
| Streets | Postcodes |
|---|---|
| Bron Y Bryn | SA2 7NP |
| Byron Way | SA2 7EP |
| Clos Coed Collings | SA2 7RD |
| Clos Cynan | SA2 7DL |
| Clos Islwyn | SA2 7ET |
| Coleridge Crescent | SA2 7DJ SA2 7ER |
| Cowper Close | SA2 7DG |
| Dunvant Road | SA2 7NL SA2 7NN SA2 7NR SA2 7NW SA2 7LF |
| Dylan Close | SA2 7BW |
| Dylan Road | SA2 7BN |
| Eliot Close | SA2 7DN |
| Fairy Grove | SA2 7BY |
| Ffordd Dryden | SA2 7PA SA2 7PD |
| Ffordd Picton Turberville | SA2 7RG |
| Ffordd Taliesin | SA2 7DF |
| Ffordd Yr Olchfa | SA2 7RE SA2 7RF |
| Goetre Fach Road | SA2 7SG SA2 7SQ |
| Goetre Fawr Road | SA2 7QP |
| Gower Road | SA2 7AE |
| Hafan Y Don | SA2 7NT |
| Hendrefoilan Road | SA2 7PB |
| Heol Glasnant | SA2 7BX |
| Keats Grove | SA2 7BS |
| Lamb Lane | SA2 7ES |
| Landor Avenue | SA2 7BP |
| Lon Alfa | SA2 7DH |
| Pentre Banadl | SA2 7DD |
| Student Village | SA2 7PG |
| Tennyson Way | SA2 7DQ |
| Twyni Teg | SA2 7NS |
| Wimmerfield Avenue | SA2 7BZ |
| Wimmerfield Close | SA2 7DE |
| Wimmerfield Crescent | SA2 7BU SA2 7DB |
| Wimmerfield Drive | SA2 7BR |
| SA2 7PZ SA2 7QG SA2 7QL SA2 7QN SA2 7QW SA5 4RT |
Transport near Killay North
- FAQ
- Price Paid By Year
- Property Type Price
Frequently asked questions about Killay North
What is the average price for a property for sale in Killay North?
The average price for a property for sale in Killay North is £335,488. This amount is 54% higher than the average price in Swansea. There are 905 property listings for sale in Killay North.
What streets have the most expensive properties for sale in Killay North?
The streets with the most expensive properties for sale in Killay North are Gower Road at an average of £1,090,000, Pentre Banadl at an average of £500,000 and Clos Coed Collings at an average of £424,915.
What streets have the most affordable properties for sale in Killay North?
The streets with the most affordable properties for sale in Killay North are Tennyson Way at an average of £171,190, Cowper Close at an average of £207,500 and Wimmerfield Avenue at an average of £218,000.
Which train stations are available in or near Killay North?
Some of the train stations available in or near Killay North are Gowerton, Swansea and Bynea.
Property Price Paid in Killay North by Year
The average sold property price by year was:
| Year | Average Sold Price | Price Change |
Sold Properties
|
|---|---|---|---|
| 2025 | £337,311 | -3% |
30 Properties |
| 2024 | £348,876 | -1% |
56 Properties |
| 2023 | £352,999 | 16% |
33 Properties |
| 2022 | £294,831 | 4% |
34 Properties |
| 2021 | £281,629 | -4% |
54 Properties |
| 2020 | £293,775 | 20% |
28 Properties |
| 2019 | £235,465 | 2% |
59 Properties |
| 2018 | £231,208 | -6% |
45 Properties |
| 2017 | £244,933 | 18% |
55 Properties |
| 2016 | £201,906 | 4% |
44 Properties |
| 2015 | £193,309 | 2% |
27 Properties |
| 2014 | £190,047 | 9% |
35 Properties |
| 2013 | £172,170 | -4% |
32 Properties |
| 2012 | £179,161 | -7% |
26 Properties |
| 2011 | £192,503 | 1% |
39 Properties |
| 2010 | £189,658 | -2% |
25 Properties |
| 2009 | £193,849 | 9% |
22 Properties |
| 2008 | £176,210 | -8% |
19 Properties |
| 2007 | £190,309 | 8% |
44 Properties |
| 2006 | £175,884 | -12% |
46 Properties |
| 2005 | £197,296 | -1% |
47 Properties |
| 2004 | £199,216 | 36% |
48 Properties |
| 2003 | £126,690 | 12% |
49 Properties |
| 2002 | £110,927 | 7% |
68 Properties |
| 2001 | £103,363 | 16% |
57 Properties |
| 2000 | £86,697 | 3% |
68 Properties |
| 1999 | £84,369 | 3% |
72 Properties |
| 1998 | £82,136 | 8% |
88 Properties |
| 1997 | £75,890 | 5% |
89 Properties |
| 1996 | £72,344 | -5% |
70 Properties |
| 1995 | £75,606 | - |
65 Properties |
Property Price per Property Type in Killay North
Here you can find historic sold price data in order to help with your property search.
The average Property Paid Price for specific property types in the last three years are:
| Property Type | Average Sold Price | Sold Properties |
|---|---|---|
| Semi Detached House | £278,784.00 | 43 Semi Detached Houses |
| Detached House | £375,046.00 | 79 Detached Houses |
| Terraced House | £335,030.00 | 26 Terraced Houses |
| Flat | £200,500.00 | 5 Flats |

